


INTRODUCTION
The incidence of acute myeloid leukemia (AML) increases with age, with a median age of approximately 70 years at diagnosis [1,2]. The prognosis of elderly patients with AML is poor for various reasons, including patientsŌĆÖ medical comorbidities, performance status, and disease biology [3ŌĆō5]. Compared with younger patients, elderly patients with AML have different genetic characteristics, and the treatment of elderly patients with AML remains challenging due to intolerance and resistance to intensive chemotherapy [4,6,7]. These factors lead physicians to favor less-intensive treatment rather than standard intensive chemotherapy [8,9]. Hypomethylating agents (HMAs) are widely used in clinical practice because they are relatively well tolerated with low treatment-related toxicity [10]. HMAs are particularly appropriate in the treatment of AML in elderly patients with comorbidities, poor performance status, and intolerance to combination therapy with venetoclax [10].
The genomic approach in clinical medicine has improved by developing next-generation sequencing (NGS). Thus, with NGS testing, AML can be categorized according to genetic risk [9,11]. However, the risk stratification of 2017 European LeukemiaNet (ELN) is generally focused on younger patients who are fit on standard induction treatment [11,12]. In addition, the therapeutic responses of AML patients were defined by morphologic complete remission (CR) [11]. Most patients with AML have molecular mutations at diagnosis, and NGS analysis has been widely used to detect and trace gene mutations. Therefore, NGS-based measurable residual disease (MRD) monitoring has been used to predict relapse in patients who have undergone intensive treatment [13,14]. Recent studies have been conducted to detect MRD to predict relapse risk [13ŌĆō17]. However, the genetic mutations associated with prognosis among older HMA-treated AML patients have not been well delineated, and an appropriate MRD marker for elderly AML patients has yet to be established [18,19].
In this retrospective study, we analyzed the prognostic impact of genetic mutations at AML diagnosis in elderly patients treated with decitabine. Additionally, we aimed to determine the prognostic significance of NGS-based disease monitoring in our cohort.
METHODS
Patients
Patients diagnosed with AML between 2013 and 2020 were enrolled from a single institution. Eligible patients were those aged 65 years or older, with a confirmed diagnosis of AML according to the 2016 World Health Organization criteria, receiving decitabine for first-line therapy, and available for NGS using bone marrow (BM) samples at diagnosis. Patients diagnosed with acute promyelocytic leukemia were excluded. All patients received decitabine in standard doses (20 mg/m2 by intravenous infusion for 5 consecutive days) every 4 weeks. Among 64 patients who received at least four cycles of decitabine, 55 underwent follow-up BM biopsy after the fourth decitabine cycle, and two patients underwent BM biopsy after the second and third decitabine cycles, respectively, due to disease progression. Forty-nine patientsŌĆÖ follow-up BM samples underwent sequential targeted NGS sequencing. The study was conducted according to the principles of the Declaration of Helsinki. This study was approved by the Institutional Review Board of the Chonnam National University Hwasun Hospital, Korea (IRB No. CNUHH-2020-147). The details of the patients who underwent treatment are summarized in Supplementary Fig. 1.
Molecular analysis: NGS
NGS was performed on 123 samples collected from BM at the time of initial diagnosis and 49 follow-up BM samples. Deep sequencing was performed by targeting the coding regions of 51 genes with recurrent driver mutations based on data extracted from large cohort studies investigating AML and other myeloid malignancies (Supplementary Table 1) [20,21]. The targeted panel was constructed using a custom Agilent probe set (Agilent Technologies, Santa Clara, CA, USA). We defined the threshold of MRD positivity as variant allelic frequency (VAF) Ōēź 0.2% for follow-up BM biopsies based on the mutation locus background error rates, given that the mutations were present at diagnosis at VAF Ōēź 2% [13]. The detailed sample preparation, NGS, and variant calling procedures are provided in the Supplementary Materials.
Statistical analysis
Clinical characteristics were analyzed using chi-square tests for categorical variables, and two-sided StudentŌĆÖs t tests were used to analyze the quantitative variables. The statistical significance of VAF changes was determined using paired t tests. VAF clearance (╬öVAF) was calculated using the following formula: (VAFdx ŌĆō VAFfu) / VAFdx ├Ś 100. Using the R package ŌĆśrpartŌĆÖ for recursive partitioning to define a significant clearance rate (╬ö) of VAF, we defined ╬ö58.6% as the optimal cut-off value (Supplementary Fig. 2). For patients with multiple genetic alterations, the maximum VAF clearance rate was considered the ╬öVAF. The genetic risk stratification, along with definitions of CR, CR with incomplete hematologic recovery (CRi), morphologic leukemia-free state (MLFS), partial remission (PR), and no response, followed the 2017 ELN recommendations [11]. The overall response rate was defined as the proportion of patients who achieved CR, CRi, PR, and MLFS. Overall survival (OS) was calculated from the diagnosis of AML to the date of death or last follow-up. Event-free survival (EFS) was calculated as the interval from the date of the first administration of decitabine to the date of disease progression or date of death from any cause, whichever occurred first. The Kaplan-Meier method was used to analyze OS and EFS. The log-rank test was used to analyze the survival outcomes. Cox regression models were used for the multivariate analysis of various factors. To clarify the immortal time bias, landmark analyses were performed with patients (n = 84) who survived at least 3.6 months (because the median time from treatment initiation to follow-up BM examination after four decitabine cycles was 3.6 months). A p value less than 0.05 was considered statistically significant. Data analysis was performed using SPSS Statistics for Windows, version 26.0 (IBM Corp., Armonk, NY, USA) and EZR, version 1.54 (Jichi Medical University, Saitama, Japan) [22].
RESULTS
Characteristics of enrolled patients
A total of 123 patients diagnosed with AML were eligible. With a median age of 75 years (range, 67 to 89 years), 112 patients (91.1%) were diagnosed with de novo AML and 11 (8.9%) with secondary AML. According to the 2017 ELN risk stratification, 22 patients (17.9%) were classified as favorable, 62 (50.4%) as intermediate, and 39 (31.7%) as adverse risk. Favorable cytogenetic abnormalities were detected in three patients (2.4%), and most patients (n = 71, 57.7%) had normal karyotypes. Twenty patients (16.3%) had complex aberrant karyotypes. The median number of decitabine cycles was 6 (range, 1 to 41), and the median follow-up duration was 15 months (range, 9.5 to 48.6 months) among survivors. There were 109 deaths (88.6%), and the most common causes of death were infection (43.1%) and disease progression (41.5%). The median OS was 6.3 months (95% confidence interval [CI], 5.1 to 8.1; Supplementary Fig. 3A), and the median EFS was 6.3 months (95% CI, 4.5 to 7.7; Supplementary Fig. 3B). Other details of the patientsŌĆÖ characteristics and clinical courses are summarized in Table 1 and Supplementary Fig. 1.
Genetic mutation status at diagnosis
In the diagnostic samples, 108 patients (87.8%) had detectable genetic mutations, with a median of two mutations per patient (range, 1 to 6; mean, 2.3 per patient) and a median VAF of 32.5% (range, 2.0% to 95.0%). The patientsŌĆÖ mutational profile is shown in Supplementary Fig. 4. The most frequently detected mutations (in terms of categories of related genes) were those of activated signaling genes (n = 58; 47.2%), followed by DNA-methylationŌĆōrelated genes (n = 55, 44.7%), the gene encoding nucleophosmin 1 (n = 26, 21.1%), spliceosome-complex genes (n = 26, 21.1%), transcription-factor fusions (n = 21, 17.1%), and tumor-suppressor genes (n = 18, 14.6%). The most frequently detected mutations at diagnosis were mutations of FLT3 (n = 34, 27.6%; FLT3-ITD, n = 24 [high ratio, n = 10; low ratio, n = 14)]; FLT3-TKD, n = 10), followed by IDH1/IDH2 (24.3%; IDH1, n = 12; IDH2, n = 19), NRAS/KRAS (n = 18, 14.6%), DNMT3A (n = 18, 14.5%), TP53 (n = 15, 12.1%), and TET2 (n = 14, 11.0%) (Supplementary Fig. 4C). DNA methylation-related genes were more commonly detected in the intermediate ELN risk group than other risk groups (p = 0.019). Among 15 patients who carried no detectable mutations of known AML-associated driver genes, nine patients had normal karyotypes, and one patient had a complex karyotype.
Prognostic impact of cytogenetics, mutation status at diagnosis, and treatment response
Patients with complex karyotypes (n = 20; hazard ratio [HR], 1.52; 95% CI, 0.93 to 2.48; p = 0.095) showed a trend of poor survival compared with the other patients (Supplementary Fig. 5A). Patients with TET2 (n = 14; HR, 2.05; 95% CI, 1.15 to 3.63; p = 0.014) and TP53 (n = 15; HR, 1.64; 95% CI, 0.95 to 2.56; p = 0.097) mutations had poor OS. Patients with mutations of tumor-suppressor genes trended toward poor survival compared with the other groups (HR, 1.54; 95% CI, 0.92 to 2.56; p = 0.097). The survival analysis, conducted according to genetic mutations at diagnosis, is depicted in Supplementary Fig. 5B.
The overall response rate to decitabine treatment in this cohort was 34.1% (42/123; CR, n = 8; CRi, n = 6; PR, n = 22; MLFS, n = 6; Supplementary Fig. 6A). There were no significant differences in overall response rates according to 2017 ELN risk stratification, cytogenetic abnormality, genetic mutation, or category of related genes (Supplementary Fig. 6B, Table 2). Responders (n = 42; those who achieved CR, CRi, PR, or MLFS) had significantly better survival outcomes compared with non-responders (n = 42) in the land-mark analysis (median OS, 15.3 months vs. 6.5 months; p < 0.001; median EFS, 14.7 months vs. 6.5 months; p < 0.001) (Supplementary Fig. 3C, D). Among responders, the achievement of CR/CRi (n = 14) or PR (n = 22) was associated with better OS, but MLFS (n = 6) was associated with inferior OS (median OS, 19.3 months vs. 16.0 months vs. 8.1 months; p = 0.023) and inferior EFS (median EFS, 15.3 months vs. 15.1 months vs. 7.2 months; p = 0.036) (Supplementary Fig. 3E, F).
NGS-based MRD status
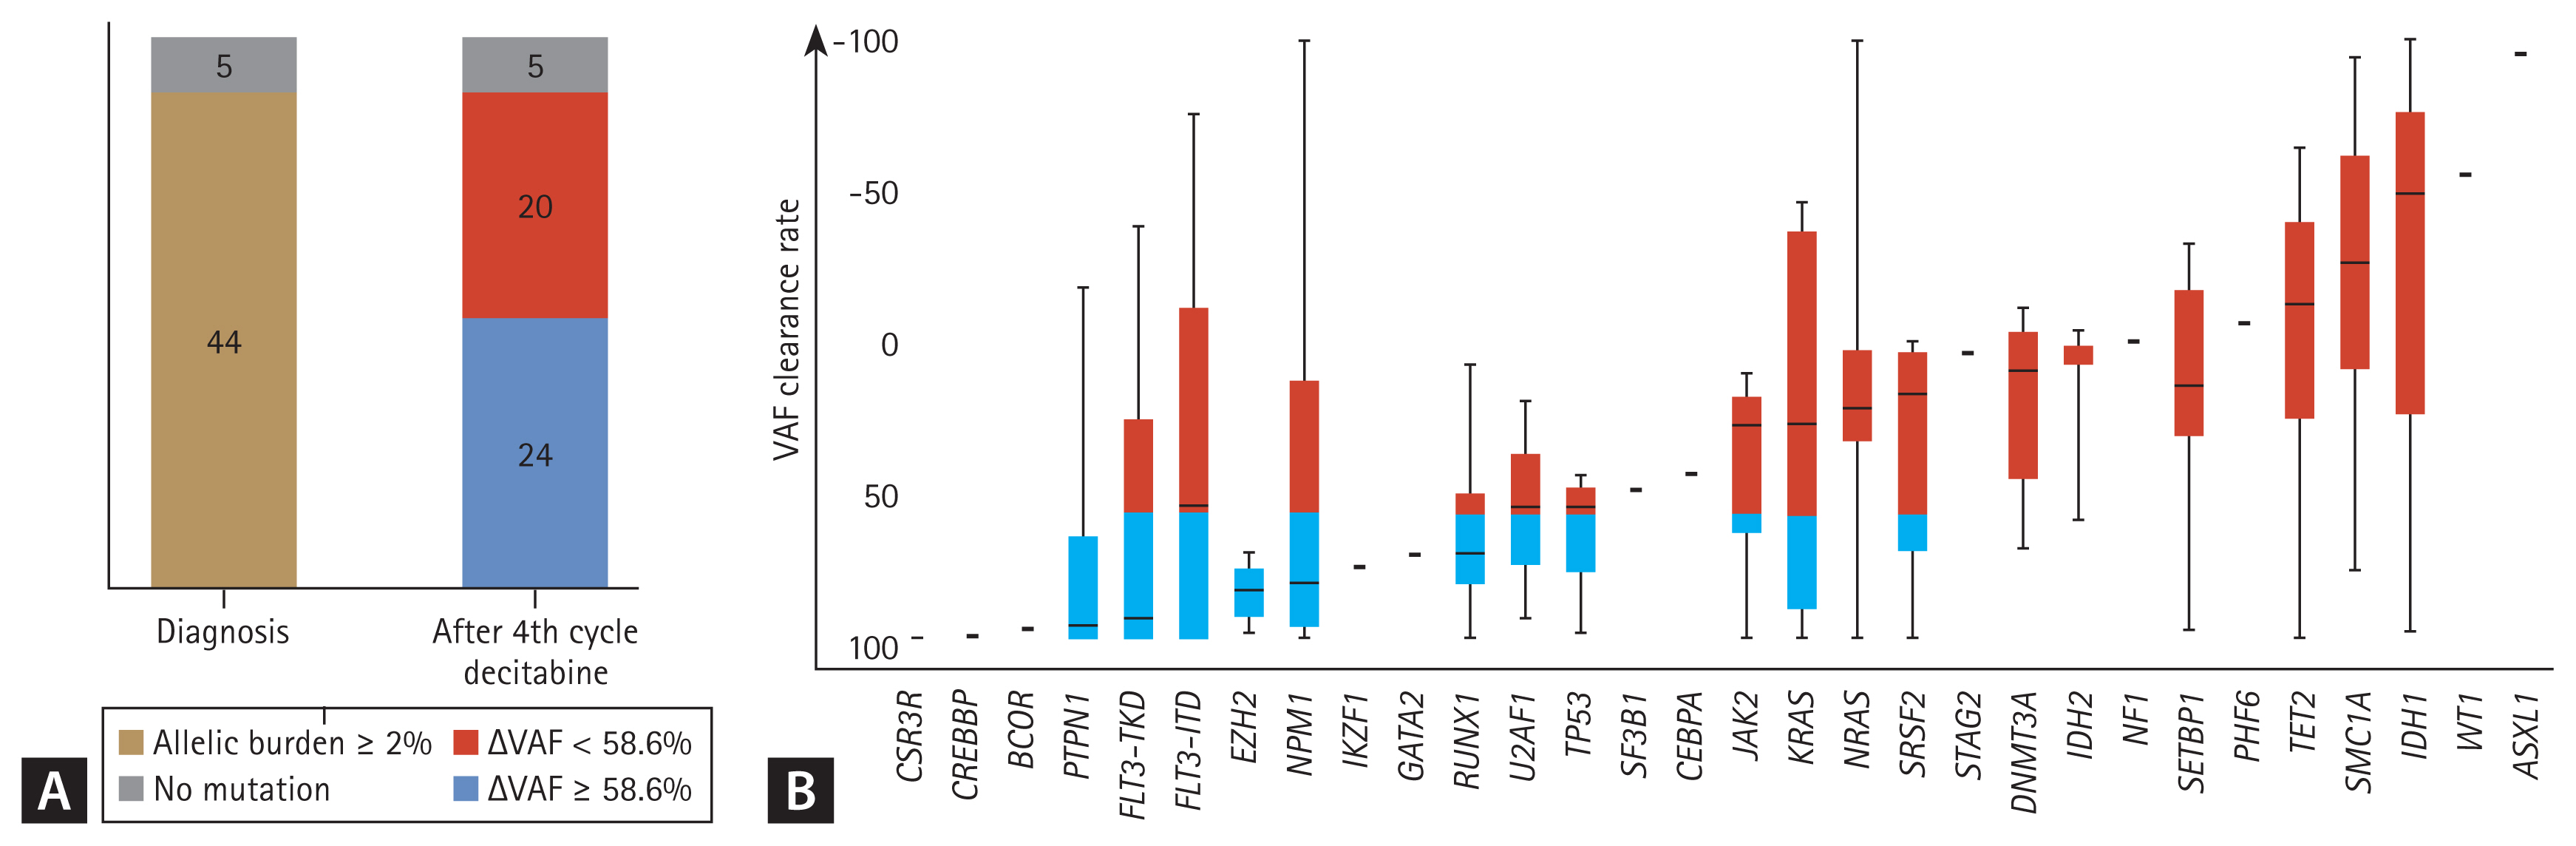
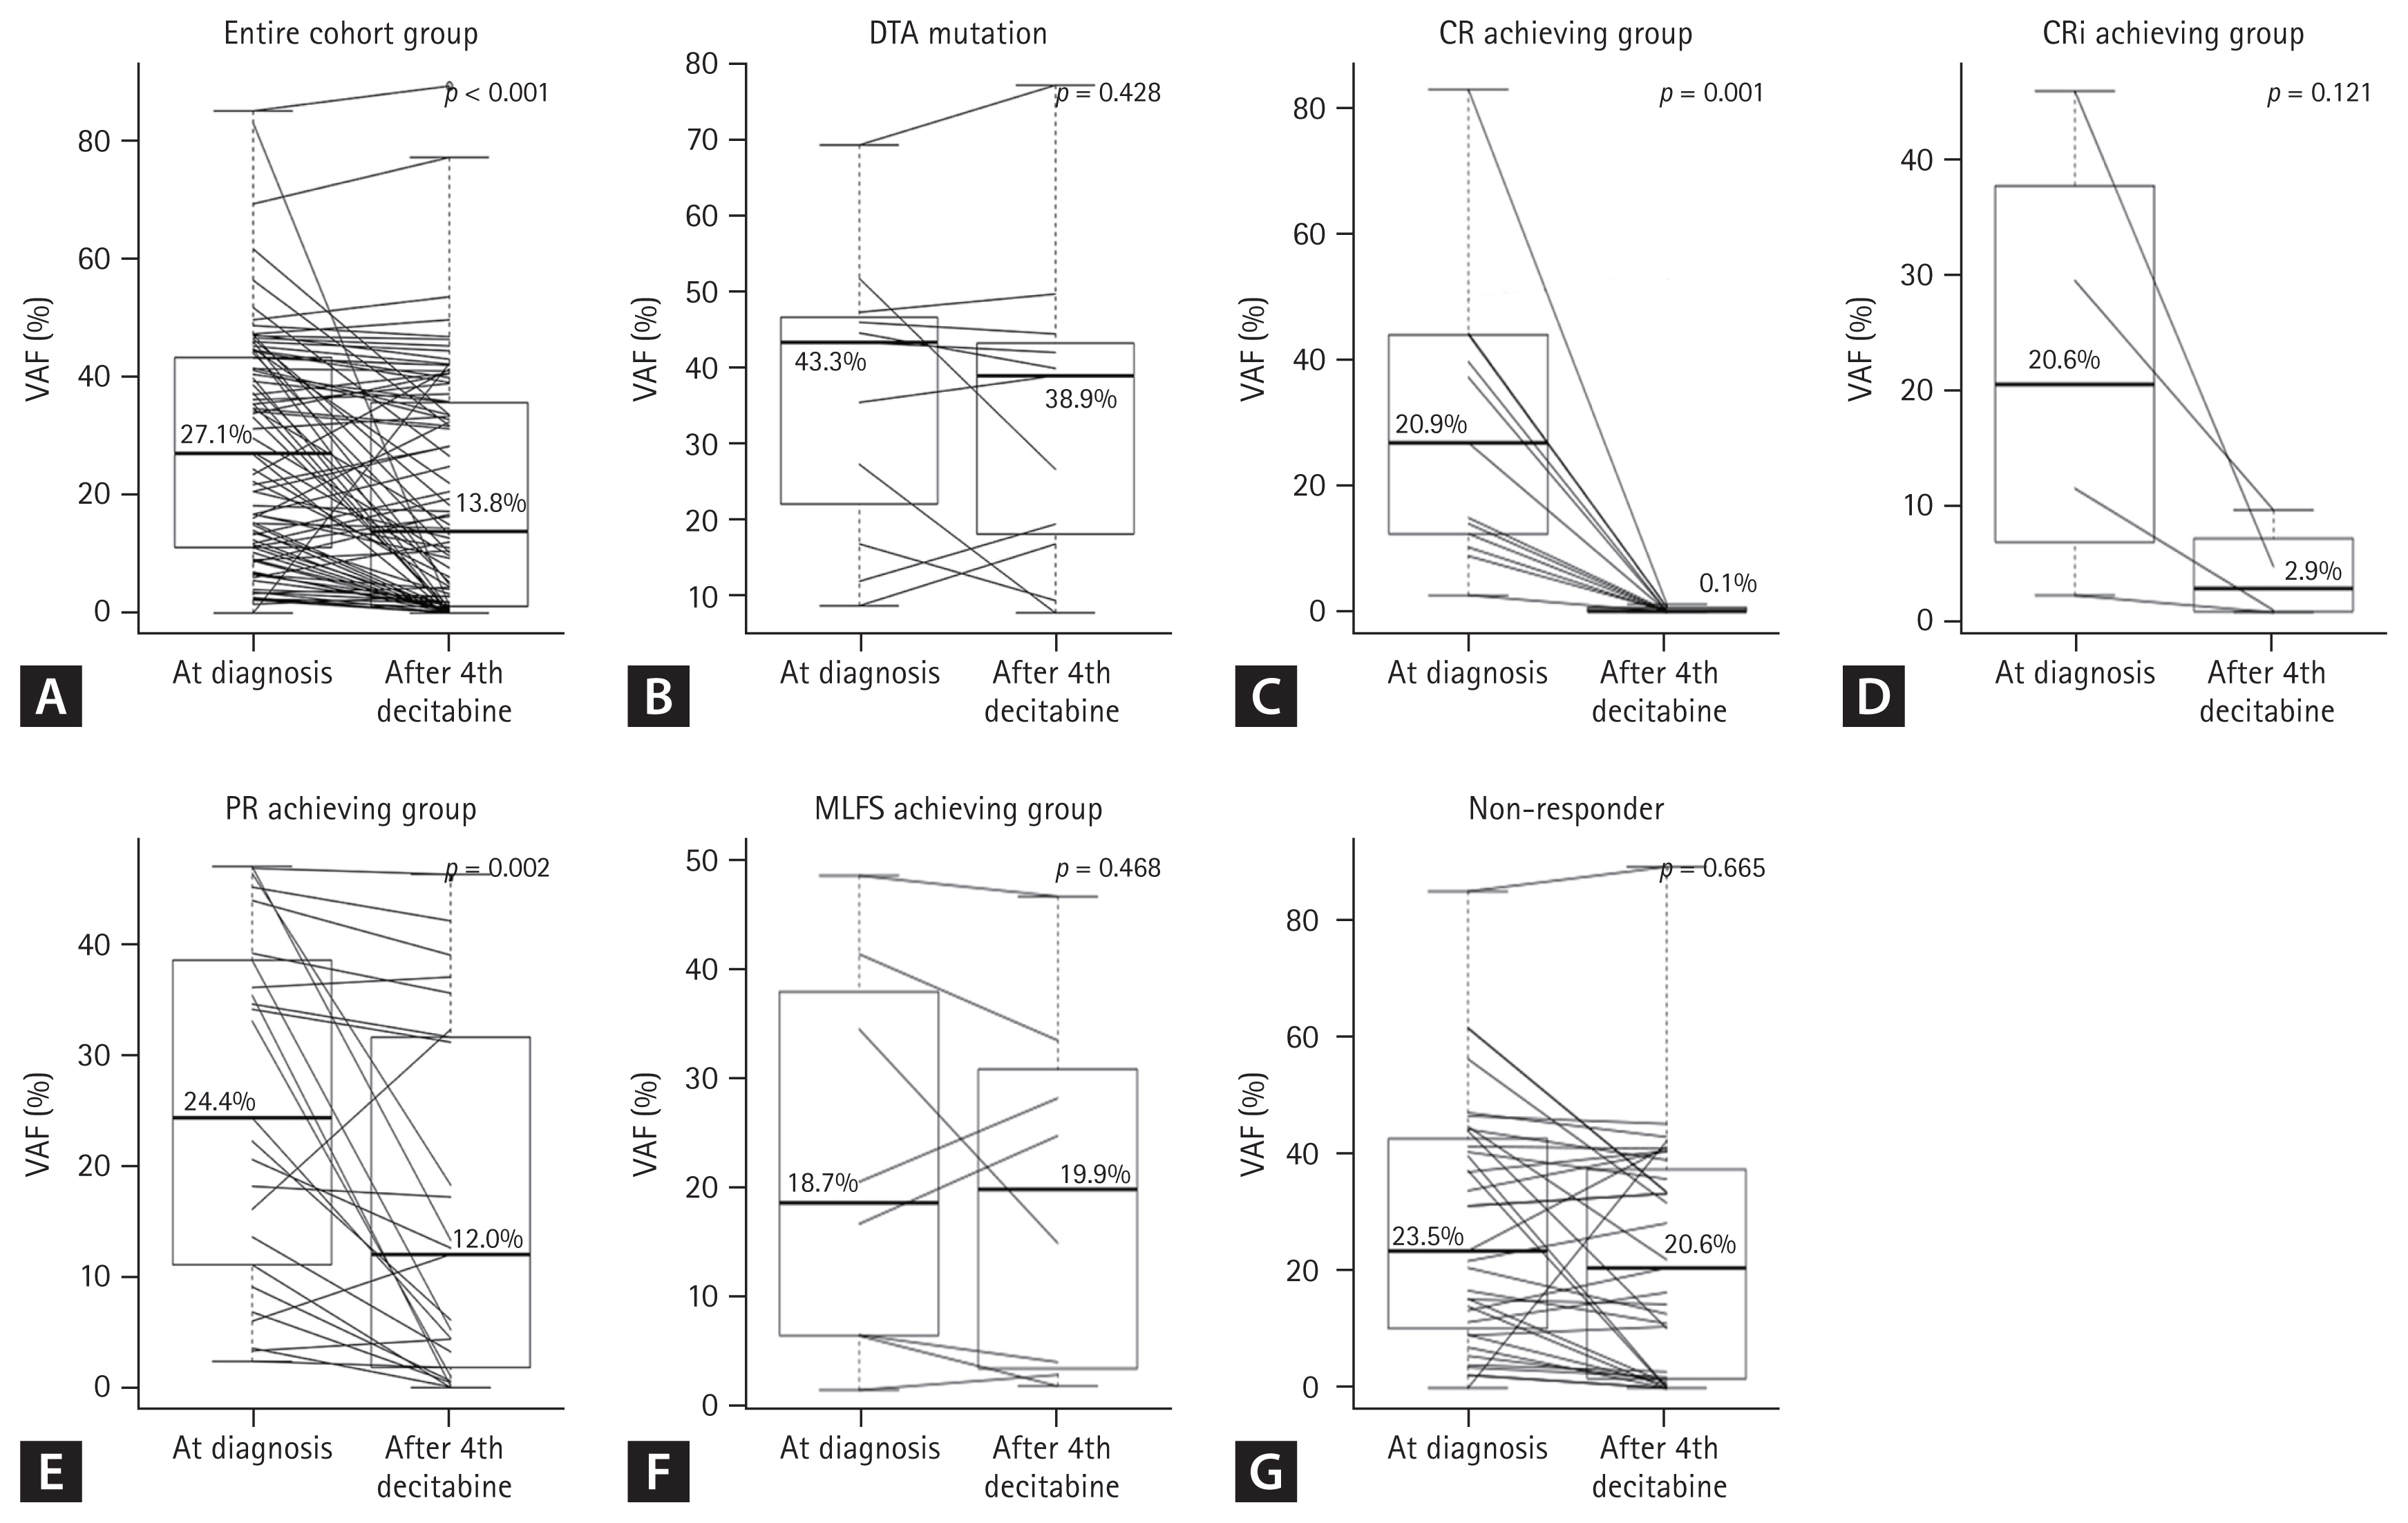
Of the 49 patients available for targeted NGS analysis after the fourth decitabine cycle, 44 had trackable gene mutations at diagnosis (Fig. 1). Eight of 44 patients (18.2%) achieved MRD negativity after four cycles of decitabine treatment. Among patients with each mutation, the median clearance rate of VAF was Δ43.7%. Figure 2 shows the clearance rates of VAF after the fourth decitabine cycle. Mutations of DNMT3A, TET2, and ASXL1 (DTA genes) were detected in samples from 29 patients at diagnosis. The DTA mutations, which are associated with age-related clonal hematopoiesis, were also persistently highly detected after the fourth cycle of decitabine (p = 0.428, Fig. 2B). Therefore, DTA mutations were excluded from the VAF clearance analysis. In the CR and CRi groups, the median VAFs at diagnosis decreased significantly after the fourth decitabine cycle (from 20.9% to 0.1% in the CR group, p = 0.001, Fig. 2C; from 20.6% to 2.9% in the CRi group, p = 0.121, Fig. 2D). In the PR group, the median VAF also decreased from 24.4% to 12.0% (p = 0.002, Fig. 2E). However, in the MLFS and non-responder groups, the median VAF was persistently maintained (from 18.7% to 19.9% in the MLFS group, p = 0.468, Fig. 2F; from 23.5% to 20.6% in the non-responder group; p = 0.665, Fig. 2G).
In the survival analysis, a 10% increase in mutation clearance improved OS by 11.7% (HR, 0.883; 95% CI, 0.837 to 0.930; p = 3.00 ├Ś 10ŌłÆ6). Based on a clearance rate of VAF ╬ö58.6%, which was the most informative cut-off point, 24 patients (54%) had VAF reductions Ōēź 58.6% (Fig. 1A). There were no associations of 2017 ELN risk stratification, cytogenetics, and categories of related gene abnormalities between responders and non-responders (Table 2). However, there was a significantly higher proportion of responders than non-responders (p = 0.043, Table 3) with reduced VAF (╬öVAF Ōēź 58.6%).
PTPN1, FLT3-TKD, EZH2, RUNX1, and TP53 mutations were associated with a median ╬öVAF Ōēź 58.6%. DNA-methylation gene (DMNT3A, TET2, IDH1, and IDH2) mutations were associated with a median ╬öVAF < 58.6% (Fig. 1B).
Correlation between survival and ΔVAF
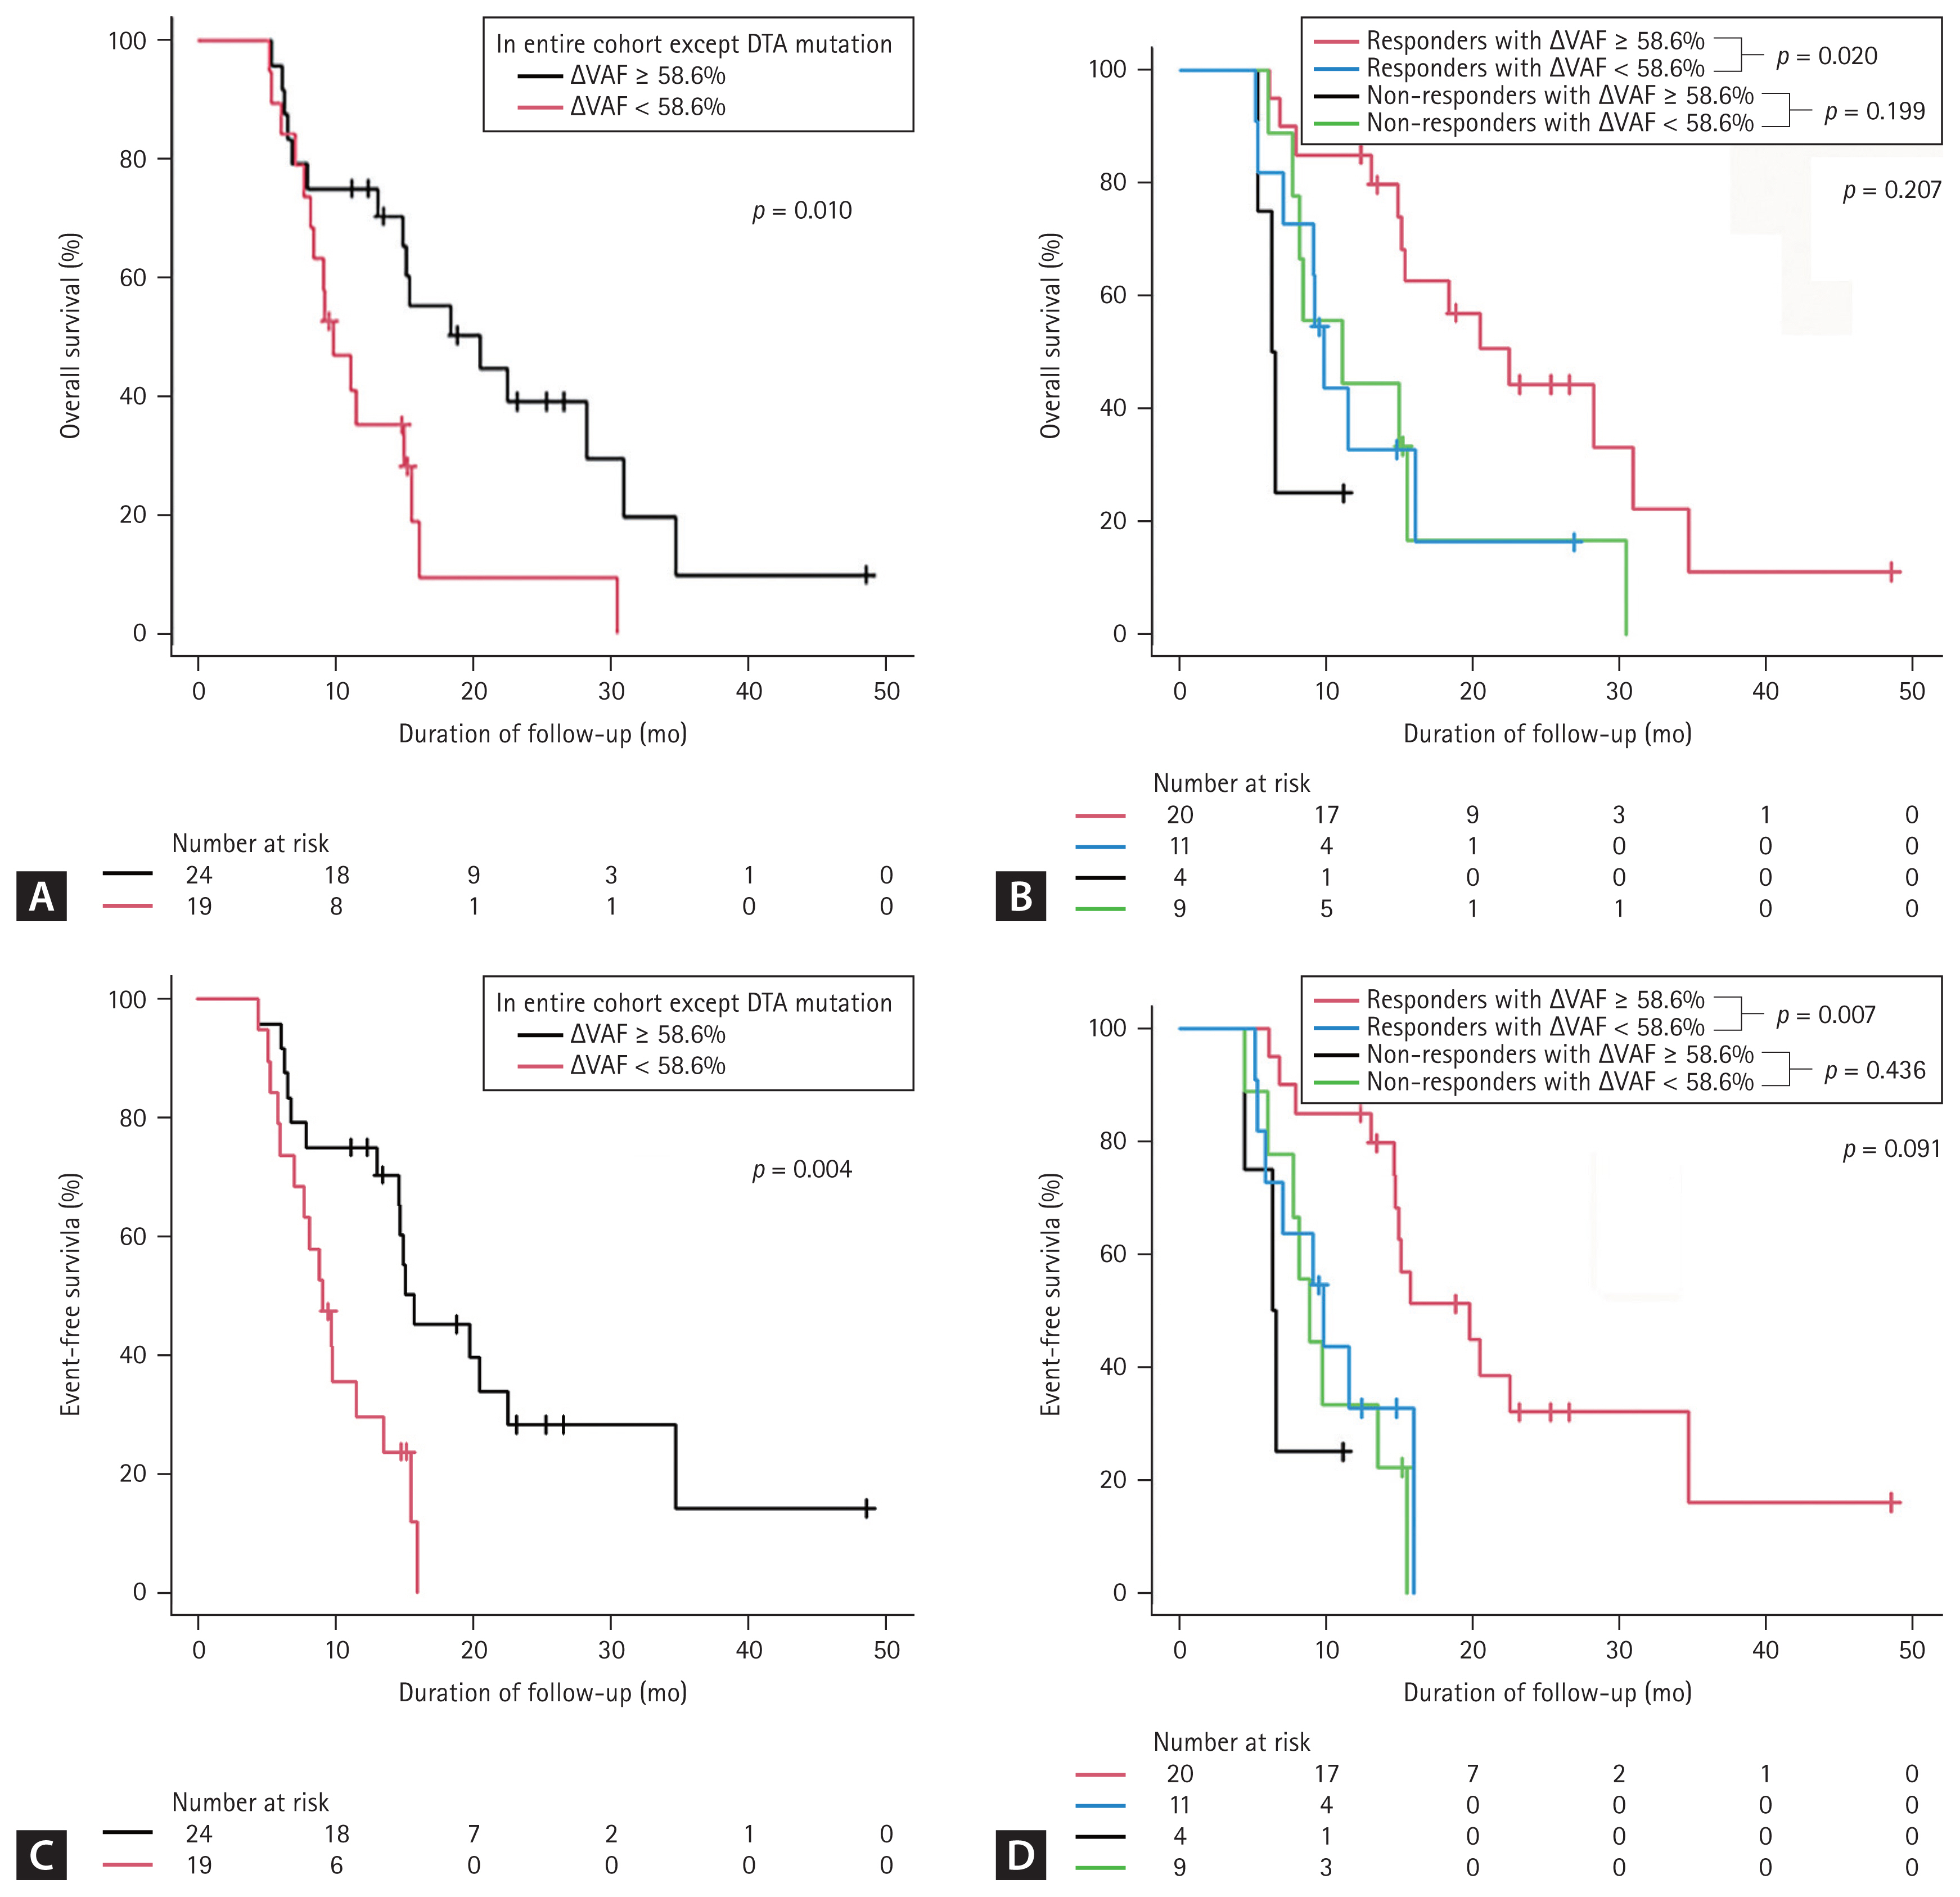
The median OS of patients with ╬öVAF Ōēź 58.6% (n = 24) was significantly longer than that of patients with ╬öVAF < 58.6% (n = 20 [median OS, 20.5 months vs. 9.8 months; p = 0.033]). MRD-negative patients had a good prognosis, with a median OS and EFS of 20.5 months, respectively. After DTA mutations were excluded, the survival outcomes remained similar to those derived from the analysis that included DTA mutations (median OS of ╬öVAF Ōēź 58.6% [n = 24], 20.5 months; ╬öVAF < 58.6% [n = 19], 9.8 months; p = 0.010; Fig. 3A). In addition, the median EFS of patients with reduced VAF was significantly longer than that of patients with ╬öVAF < 58.6% (median EFS, 15.7 months vs. 9.1 months, p = 0.007). In the analysis excluding the DTA mutations, the survival outcomes remained similar to those derived from the analysis that included the DTA mutations (median EFS of ╬öVAF Ōēź 58.6% [n = 24], 15.7 months; ╬öVAF < 58.6% [n = 19], 9.1 months; p = 0.004, Fig. 3C).
╬öVAF Ōēź 58.6% was more frequently observed in responders (p = 0.043, Table 3). Therefore, we further analyzed the prognostic significance of ╬öVAF Ōēź 58.6% in responders. Responders with ╬öVAF Ōēź 58.6% had significantly longer OS and EFS than responders with ╬öVAF < 58.6% (Fig. 3B, D). The median OS in the responders with ╬öVAF Ōēź 58.6% (n = 20) was 22.5 months, which was longer than the median 12.7 months in responders with ╬öVAF < 58.6% (n = 11, p = 0.020, Fig. 3B).
Table 4 summarizes the results of the univariate and multivariate Cox regression analyses to evaluate the variables associated with OS and EFS. Univariate analysis revealed ╬öVAF Ōēź 58.6%, TET2 mutation, and TP53 mutation to be significant predictors of OS and EFS (all, p < 0.05). Multivariate Cox regression analysis revealed ╬öVAF Ōēź 58.6% (OS [p = 0.047; HR, 0.46; 95% CI, 0.21 to 0.99], EFS [p = 0.019; HR, 0.39; 95% CI, 0.17 to 0.86]), TET2 (OS [p = 0.020; HR, 4.54; 95% CI, 1.27 to 16.25], and EFS [p = 0.019; HR, 4.67; 95% CI, 1.29 to 16.85]) to be independent predictors of OS and EFS (Table 4).
DISCUSSION
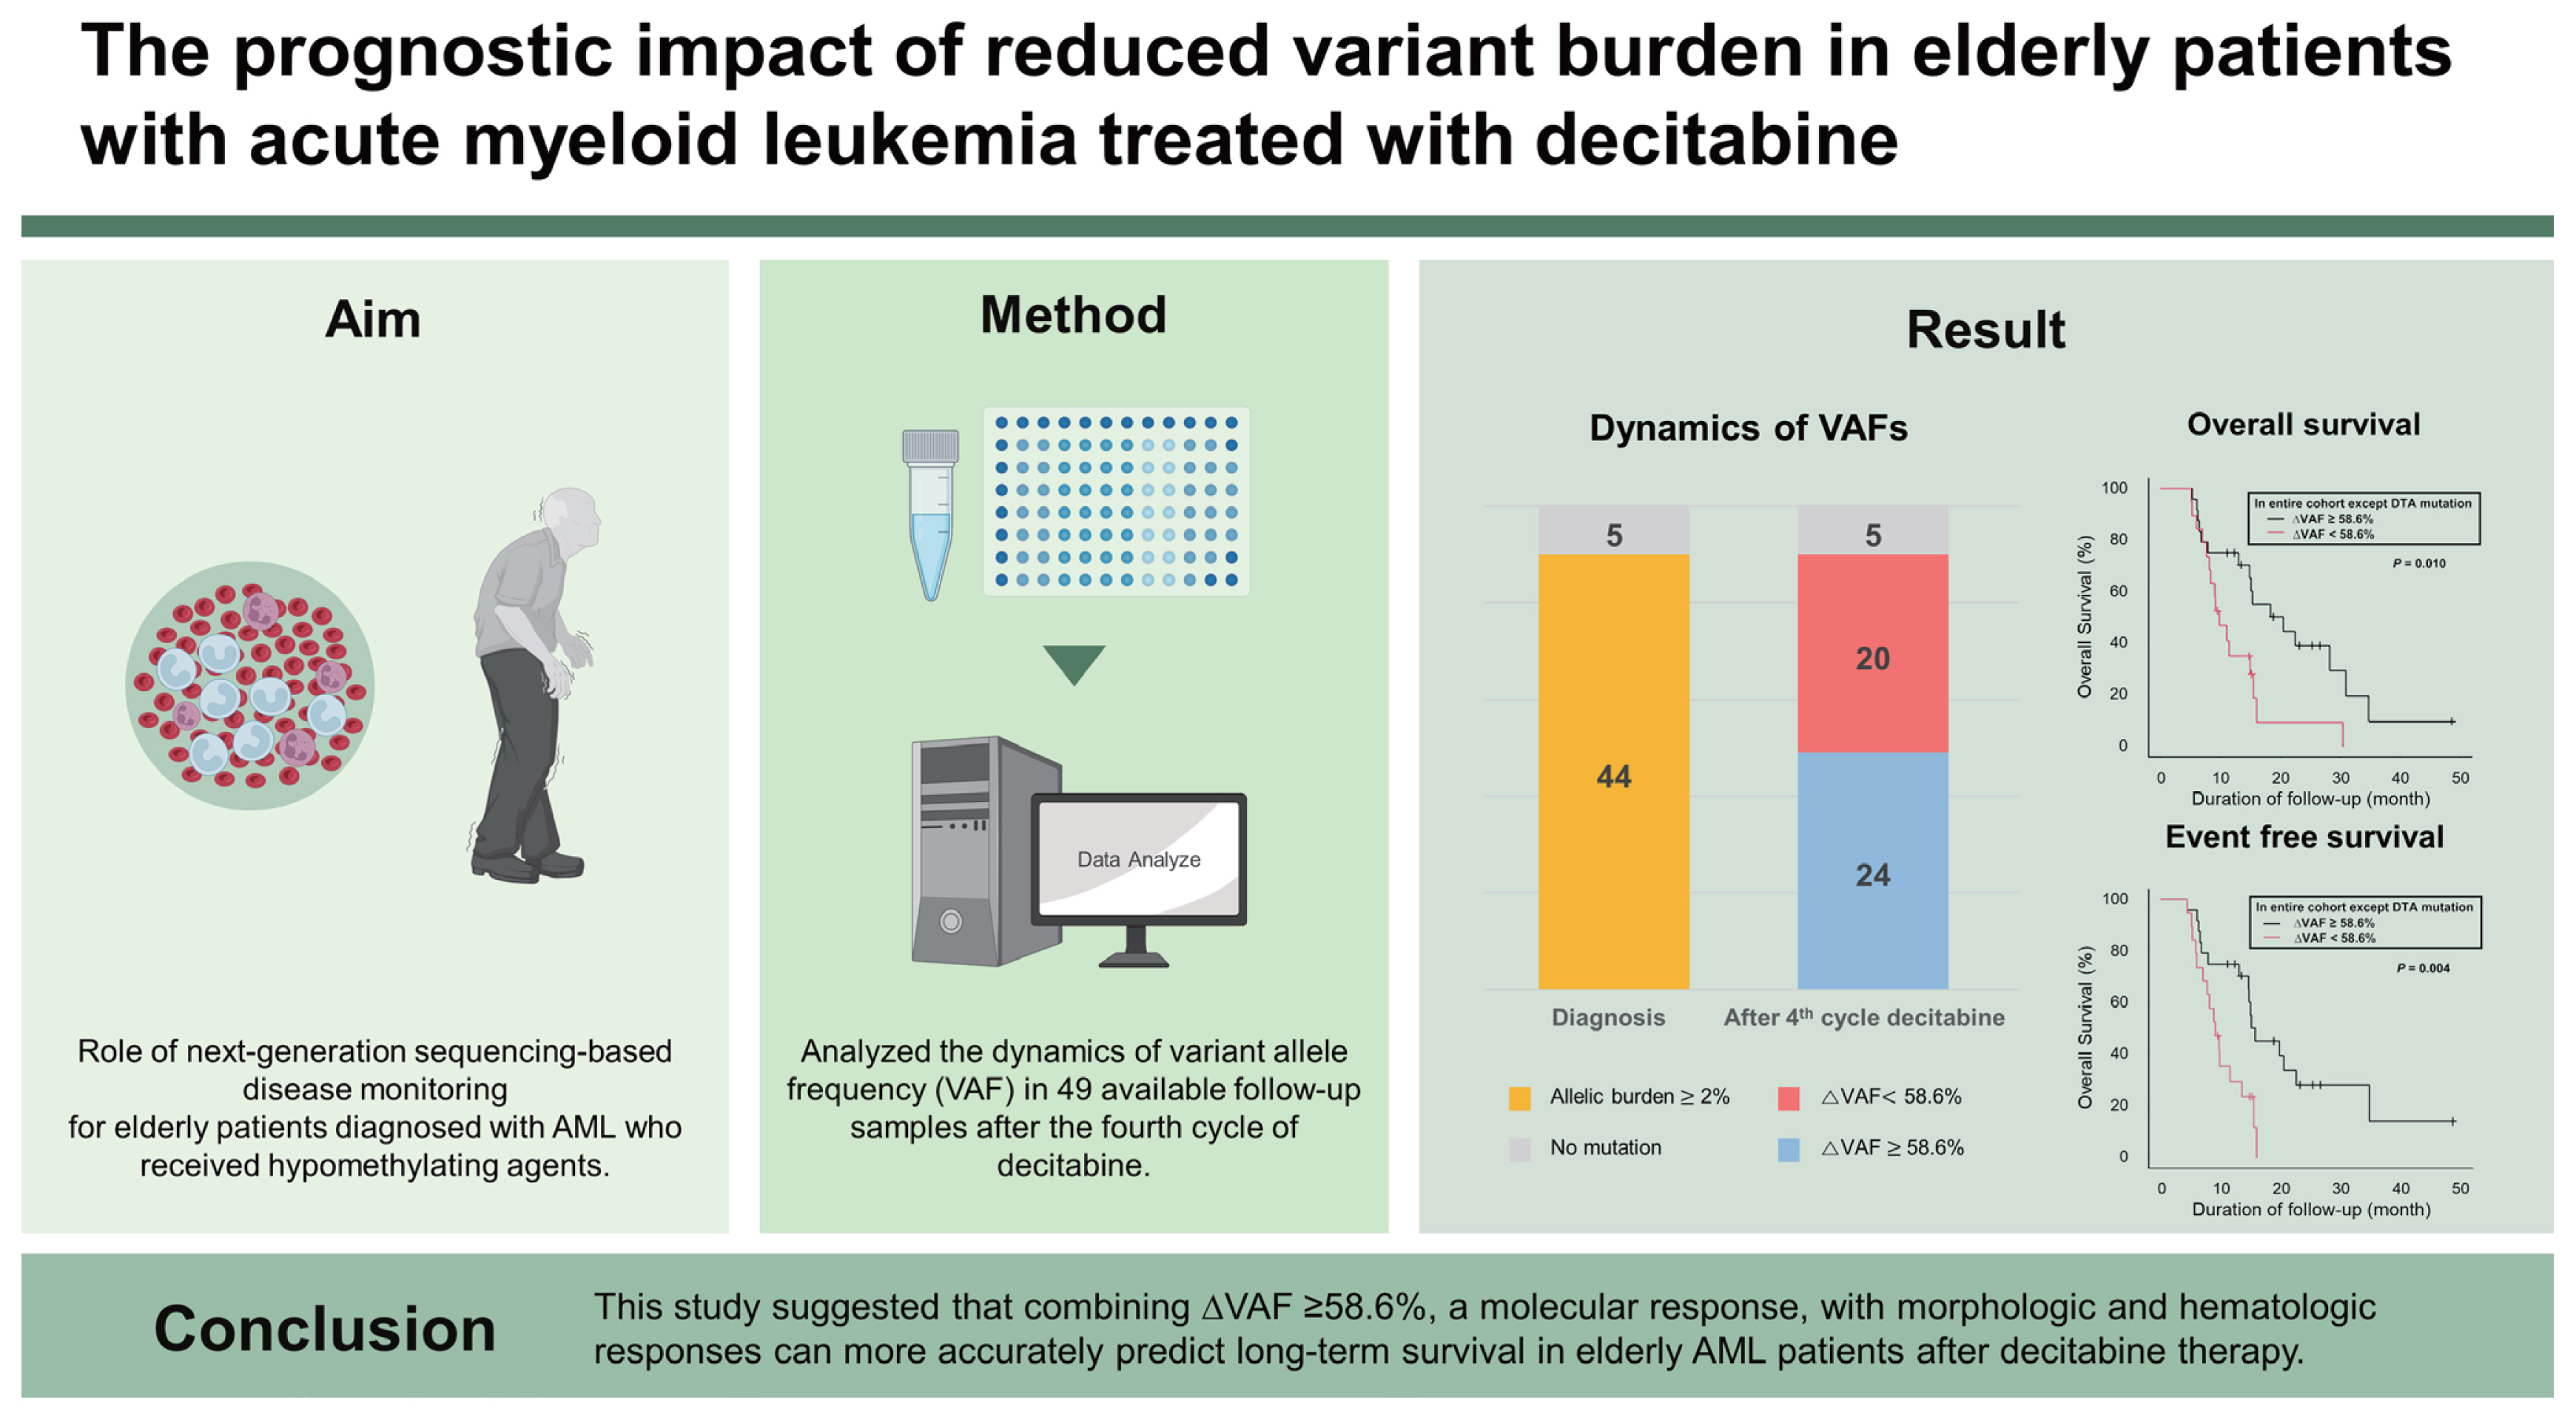
This study aimed to identify the prognostic significance of VAF reductions in elderly AML patients after decitabine treatment. The group with reduced VAF (╬öVAF Ōēź 58.6%) had significantly longer OS and EFS than the group without ╬öVAF Ōēź 58.6%. Additionally, responders with ╬öVAF Ōēź 58.6% had significantly longer OS and EFS. For elderly AML patients after decitabine treatment, long-term responses can be more accurately predicted when the ╬öVAF Ōēź 58.6%, with additional evidence from morphologic and hematologic HMA treatment responses.
MRD assessments are widely studied as prognostic factors after induction chemotherapy and after transplantation [13,14,23]. However, NGS-based MRD assessment in patients receiving low-intensity treatment has not been fully evaluated. The goal of intensive treatment is to achieve CR, and MRD clearance is an important predictable molecular marker of relapse. Recently, Boddu et al. [24] demonstrated the clinical relevance of MRD negativity in older patients with AML treated with HMAs. Using multicolor flow cytometry, they showed a significant advantage of MRD negativity in terms of the cumulative incidence of relapse [24]. However, this result did not translate to improved survival [24]. In that study, 13 patients were MRD-negative among 24 patients in the reduced-VAF group. The expectation of molecular clearance with only HMA treatment in older AML patients is questionable because somatic mutations with relatively high VAF remain after HMA administration [25,26]. Therefore, MRD negativity is not a conclusive prognostic marker for elderly AML patients treated with HMAs. In our study, reduced VAF (╬öVAF Ōēź 58.6%) was shown to be a feasible prognostic marker for predicting OS and EFS for elderly patients. These results emphasize the importance of VAF reduction, along with MRD negativity, in elderly AML patients treated with HMAs. The goal of HMA treatment in this patient population is to prolong survival rather than achieve cure.
Our study demonstrated that decitabine-treated elderly AML patients who achieved CR/CRi or PR had prolonged survival. Similar to our study, Molica et al. [27] found that the achievement of CR or PR after HMA treatment was significantly associated with better outcomes; they also observed no differences between CR and PR in elderly AML patients. However, that study did not clearly define MLFS. Our study found that such favorable outcomes were not associated with an MLFS in elderly AML patients. One of the reasons for the non-survival benefit in the MLFS group could be the accompanying infection and bleeding due to the cytopenia associated with an MLFS. Although limited in number, four out of six patients died from complications of cytopenia in our cohort. The other reason might be that an MLFS may make it difficult to predict a morphologic response due to the associated BM aplastic state. In our study, the MLFS patients had relatively stable VAFs compared with other responders (CR/CRi or PR)ŌĆöthe median ╬öVAFs were 11.5% vs. 88.0%, respectively. The MLFS can be interpreted as a depletion of leukemic cells but not a true decrease in leukemic burden compared with normal hematopoietic cells. Our study findings suggested that combining the MLFS evidence with ╬öVAF Ōēź 58.6% may address the limitations associated with the aplastic state in the MLFS.
Our data also demonstrate the prognostic significance of genetic mutations in the diagnosis of elderly AML patients receiving decitabine treatment. Metzeler et al. [28] found that the mutation spectrum of elderly AML patients differed from that of younger patients. The high rates of SRSF2, DNMT3A, TET2, and TP53 mutations in our elderly AML patients were concordant with other study findings [28,29]. These genes are age-associated and mediate clonal hematopoiesis. They are frequently mutated in elderly patients, and these results represent biological differences in the AML afflicting younger and elderly patients [30,31]. Unlike other studies, in our study, DNMT3A and RUNX1 mutations at diagnosis were not associated with inferior survival outcomes [32,33]. Differences in treatment modalities (intensive vs. non-intensive treatment) between studies could partially explain these conflicting findings. Since our study focused on the group receiving decitabine monotherapy, it was meaningful in that it demonstrated the significance of the genetic mutations in the HMA-treated group. Consistent with previous studies, we identified that TET2 and TP53 mutations at diagnosis were genetic risk predictors of poor survival [32,33]. It can be concluded that it is difficult to improve the survival of elderly AML patients with TP53 or TET2 mutations using HMA monotherapy. Elderly AML patients who carry these mutations could be recommended to register for clinical trials for early access to novel treatments. In our study, IDH1/IDH2 mutations were potentially associated with shorter survival in this patient population. A recent study found that patients with IDH1/IDH2-mutated AML had favorable outcomes when treated with HMAs and venetoclax [34]. Our data may provide additional evidence to recommend HMAs combined with venetoclax or IDH1/ IDH2 inhibitors because it is difficult to expect improved survival with HMAs alone in elderly AML patients with IDH1/ IDH2 mutations [35,36].
There were several limitations to our study. First, the use of ΔVAF is associated with selection bias because only patients who received at least four cycles of decitabine were included in the ΔVAF groups. For this reason, it is difficult to predict early mortality or early treatment failure at diagnosis. Second, this retrospective cohort included a small number of patients. However, our study provides appropriate evidence for applying NGS-based disease monitoring to elderly AML patients treated with HMAs. This study also suggests that a different approach to MRD monitoring is required for elderly AML patients.
Recently, HMAs with venetoclax has become a new standard treatment for older patients with AML [9,35,37]. However, the estimated median OS for patients with reduced VAF (╬öVAF Ōēź 58.6%) was 20.5 months, which was higher than that associated with the combination of HMA therapy and venetoclax (17.5 months) [38]. Some elderly AML patients are not suitable candidates for venetoclax plus HMAs because of treatment-related myelosuppression, comorbidities, and economic issues. ╬öVAF is an early predictor of long-term survival associated with decitabine monotherapy, and such prediction can help determine whether to continue treatment or consider other treatments at an early stage before the loss of the treatment response. Based on our data, VAF clearance could be an additional prognostic indicator of survival outcomes for elderly AML patients, particularly those who achieved PR or better responses after HMA treatment. Despite achieving overall responses to HMAs, patients with stable VAF may be unlikely to achieve long-term survival, and an early regimen change should be considered.
This study investigated the clinical significance of genetic mutations at the time of diagnosis in elderly AML patients receiving HMAs. Moreover, VAF clearance could provide additional information for predicting long-term survival in elderly AML patients responding to decitabine. ╬öVAF Ōēź 58.6% combined with evidence from morphologic and hematologic treatment responses could be proposed as a marker for determining whether to maintain decitabine treatment or combine novel agents to improve survival prognosis.
KEY MESSAGE
1. Variant allele frequency (VAF) clearance could provide additional information for predicting longterm survival in elderly acute myeloid leukemia patients responding to decitabine
2. VAF clearance with morphologic and hematologic responses could be proposed as a marker for determining whether to maintain decitabine treatment or combine novel agents to improve survival prognosis.
 PDF Links
 PubReader
 ePub Link
 Full text via DOI
 Download Citation
 Supplement figure 1
 Print
Print


