Korean J Intern Med > Volume 36(6); 2021 > Article
Lin, Han, Guo, Wei, Guo, Zhai, Li, Ruan, Hu, Li, and He: Atrial fibrillation in critically ill patients who received prolonged mechanical ventilation: a nationwide inpatient report

Abstract

Background/Aims

To evaluate temporal trends of atrial fibrillation (AF) prevalence in critically ill patients who received prolonged mechanical ventilation (MV) in the United States.

Methods

We used the 2008 to 2014 National Inpatient Sample to compute the weighted prevalence of AF among hospitalized adult patients on prolonged MV. We used multivariable-adjusted models to evaluate the association of AF with clinical factors, in-hospital mortality, hospitalization cost, and length of stay (LOS).

Results

We identified 2,578,165 patients who received prolonged MV (21.27% of AF patients). The prevalence of AF increased from 14.63% in 2008 to 24.43% in 2014 (p for trend < 0.0001). Amongst different phenotypes of critically ill patients, the prevalence of AF increased in patients with severe sepsis, asthma exacerbation, congestive heart failure exacerbation, acute stroke, and cardiac arrest. Older age, male sex, white race, medicare access, higher income, urban teaching hospital setting, and Western region were associated with a higher prevalence of AF. AF in critical illness was a risk factor for in-hospital death (odds ratio, 1.13; 95% confidence interval, 1.11 to 1.15), but in-hospital mortality in critically ill patients with AF decreased from 11.6% to 8.3%. AF was linked to prolonged LOS (2%, p < 0.0001) and high hospitalization cost (4%, p < 0.0001). LOS (−1%, p < 0.0001) and hospitalization cost (−4%, p < 0.0001) decreased yearly.

Conclusions

The prevalence of comorbid AF is increasing, particularly in older patients. AF may lead to poorer prognosis, and high-quality intensive care is imperative for this population.

INTRODUCTION

Atrial fibrillation (AF) is one of the most common cardiovascular health problems in the general population [1], and its prevalence ranges from 0.1% among people younger than 55 years to 9.1% among those older than 85 years [2]. AF is also common in critically ill patients [3], accounting for more than 61% of all kinds of arrhythmias. The incidence of AF is increasing in critically ill patients and a direct relationship between incidence and disease severity has been observed [4].
The outcomes of critically ill patients with AF are somewhat conflicting. Some studies have suggested that AF development in critical illness is associated with increased mortality and longer hospital stay [3,5,6]. However, in a single-center prospective observational study, there was no difference in mortality rates between patients with arrhythmia and those without [7]. Although some organizations published guidelines for AF management, they did not include patients with a critical illness [8,9]; also, the risk of anticoagulation therapy during the critical illness is unclear, so the management of AF in patients with critical illness remains a great challenge [10].
AF in critically ill patients has attracted much attention in recent years. Although AF incidence and risk factors were reported by some studies, the trends and outcomes of critically ill patients with AF remain unclear. The National Inpatient Sample (NIS) offers an opportunity to retrospectively evaluate the association between critical illness and AF. Our primary aim was to describe and quantify temporal trends in the prevalence of AF in critically ill patients in the United States (US) from 2008 to 2014. Secondarily, we evaluated the association between the emergence of AF and different characteristics, such as patient demographics and hospital characteristics. Finally, we examined the impact of AF on subsequent outcomes among patients with critical illness.

METHODS

Data source

We used NIS data from 2008 to 2014. The NIS is the largest all-payer inpatient health care database in the US and was made available by the Healthcare Cost and Utilization Project of the Agency for Healthcare Research and Quality. Before 2012, data of discharges were obtained by sampling 20% of the hospitals in the US. After 2012, the NIS underwent a redesign to estimate a 20% sample of discharges from all participating hospitals, which can represent over 95% of the US population [11]. Details about the NIS are available at www.hcup-us.ahrq.gov/nisoverview.jsp. This study was approved by the Committee on Ethics of Medical Research, Second Military Medical University (Navy Medical University), PLA (approval number: NMUMREC-2019-166). The NIS is a public and open-access database, which does not contain identified information. Written informed consent by the patients was waived due to a retrospective nature of our study.

Study population

We identified critically ill patients by using International Classification of Diseases, Ninth Revision, Clinical Modification (ICD-9-CM) procedure code for continuous invasive mechanical ventilation for 96 or consecutive hours (96.72).[12] The exclusion criterion was age < 18 years. We identified a total of 2,578,165 patients (weighted) with critical illnesses.

Covariate assessment

The NIS variables were used to identify patients’ demographic characteristics including age, sex, race, income by ZIP code, and insurance type. Hospital characteristics included location/teaching status, bed size, and region [13]. We used the Elixhauser Comorbidity Index (ECI), which includes 29 comorbidities, to account for the burden of comorbidity [14]. The CHA2DS2-VASc score was used to estimate the acute ischemic stroke risk in AF [15]. We also identified the types of organ failure (Supplementary Table 1) and acute medical conditions (Supplementary Table 2) associated with critically ill status using standard ICD-9-CM codes and used them to adjust the multivariable models [16].

Primary and secondary outcomes

The primary objective of this study was to determine the temporal trend of AF among critically ill patients from 2008 to 2014. AF was defined using ICD-9 code (427.31) in discharge diagnosis fields. The code has a specificity of 98% and sensitivity of 80% for AF [17]. The secondary objectives included in-hospital mortality, length of stay (LOS), hospitalization cost, and discharge location. The hospitalization cost was recalculated after adjustment for inflation. Discharge location was divided into home, long-term acute care hospital or skilled nursing facility (LTACH/SNF), and died.

Statistical analysis

We derived the national estimates for the critically ill patients’ measurements using the NIS survey-weighted methods. Using the strata and weights with appropriate survey commands, we can calculate the national estimates from 20% of all admissions in the NIS. According to the occurrence of AF, the chi-square or t test was used to compare patients’ baseline characteristics. The trends of the prevalence in AF were analyzed in subgroups categorized by age, sex, race, insurance type, and discharge status using the Cochran-Armitage trend test.
We constructed three models to assess the association between AF and patient-specific characteristics and hospital and clinical factors. We used a univariate logistic regression analysis (model 1) to identify the putative factors associated with AF. Hospital demographics, clinical factors, ECI score, and CHA2DS2-VASc score are included in model 2.
Several models were performed to elucidate the associations between in-hospital mortality, LOS, and hospitalization cost and AF. In model A, we used AF as the single predictor to identify the risk associated with in-hospital mortality, LOS, and hospitalization cost. To perform a sensitivity analysis, we adjusted for demographic factors, hospital factors, ECI, anticoagulants, and CHA2DS2-VASC score in model B. For binary outcomes, we used unconditional logistic regression. Since LOS and hospitalization cost were violations of normality, the log-transformation was used. In order to analyze whether stroke or bleeding was linked to the relationship between AF and in-hospital mortality, we used stroke and bleeding as mediators respectively to construct two mediation models (adjusted for demographic factors and hospital factors). The models were also used to evaluate the trends in in-hospital mortality, LOS, and hospitalization cost in critically ill patients with and without comorbid AF. Using year as a continuous predictor, we used logistic regression to analyze in-hospital mortality and linear regression to analyze LOS and hospitalization cost.
Two-sided p values ≤ 0.05 were considered significant. All statistical analyses were performed using SAS version 9.4 (SAS Institute Inc., Cary, NC, USA).

RESULTS

Baseline characteristics

We identified a weighted sample of 2,578,165 critically ill patients from 2008 to 2014, of whom 21.27% had a diagnosis of AF. The characteristics of patients with AF versus those without are displayed in Table 1. Patients with AF were more likely to be older (71.48 years vs. 60.15 years, p < 0.0001), more likely to be of white race (68.03% vs. 56.60%, p < 0.0001), more likely to be covered by Medicare (73.28% vs. 51.81%, p < 0.0001), and more likely to have a higher income (76th to 100th percentile: 21.14% vs. 17.47%, p < 0.0001).

Trends of AF prevalence in subgroups

The AF prevalence in critically ill patients increased from 14.63% in 2008 to 24.43 % in 2014 (p for trend < 0.0001). When we excluded the patients who had undergone cardiovascular operations, the trends of AF increased from 14.26% in 2008 to 23.42 % in 2014 (p for trend < 0.0001). Fig. 1 and Supplementary Table 3 show the temporal trends of AF prevalence in critically ill patients in subgroups categorized by age, sex, race, and insurance. Across all subgroups, AF prevalence steadily increased from 2008 to 2014 (p for trend < 0.0001). The AF prevalence was higher in patients older than 75 years and higher in men than in women (25.14% vs. 23.54%, respectively). AF was more prevalent in people of white race and patients with Medicare. The temporal trends of AF in subgroups categorized by organ failure type also increased consistently over the study period (p for trend < 0.0001). A higher prevalence of renal failure (45.80% to 65.51%), neurologic failure (21.22% to 37.31%), and metabolic failure (14.85% to 28.47%) was noted (Supplementary Table 4). Amongst different phenotypes of critically ill patients, the prevalence of AF increased in the patients with severe sepsis (38.76% to 53.14%), asthma exacerbation (1.59% to 1.83%), congestive heart failure exacerbation (7.98% to 26.42%), acute stroke (3.77% to 4.37%), and cardiac arrest (2.36% to 3.41%) (Supplementary Table 5).

Trends in risk predictors and outcomes with or without AF

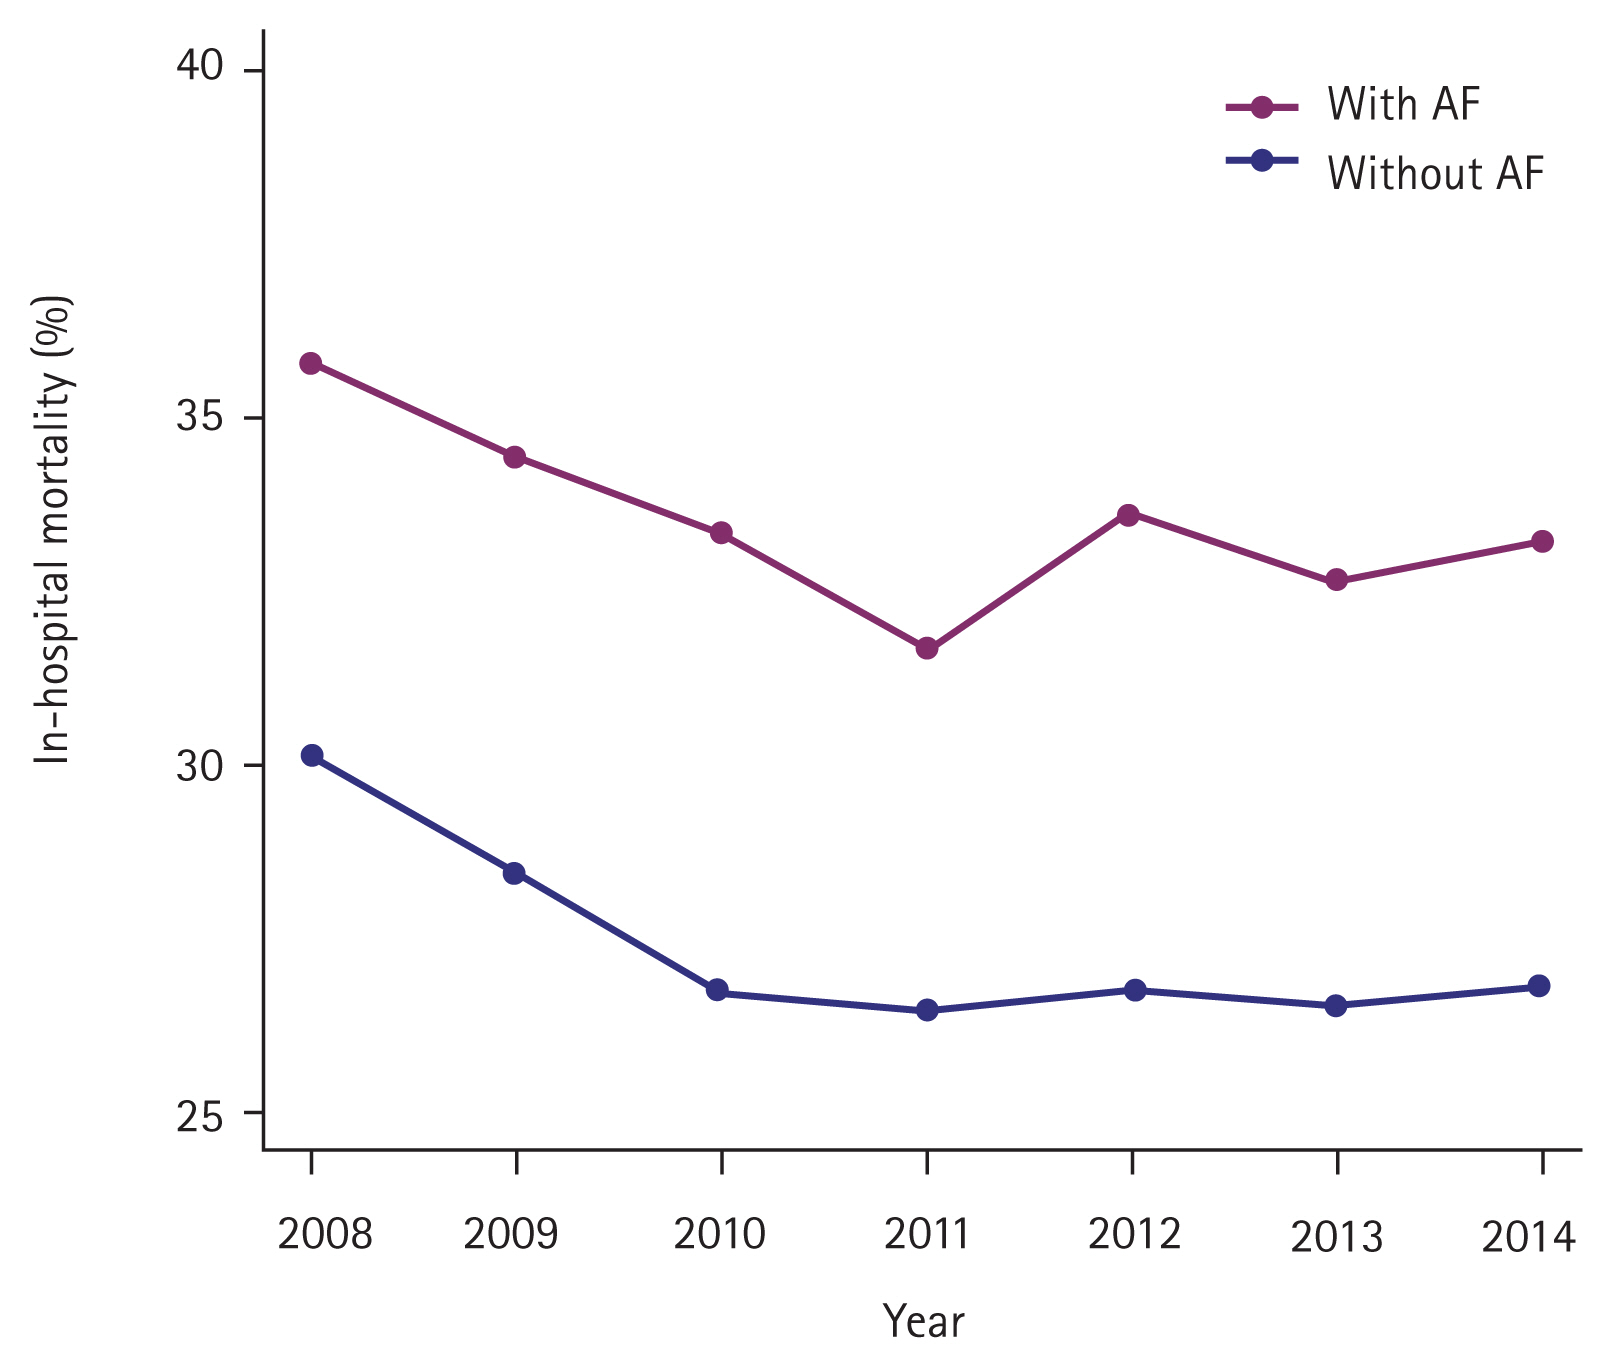
Temporal trends in risk predictor profiles among critically ill patients with AF versus without are shown in Supplementary Fig. 1. The prevalence of all risk predictor profiles increased consistently from 2008 to 2014 (p for trend < 0.0001) and patients with AF had a higher prevalence. On the contrary, in-hospital mortality decreased consistently regardless of AF status (with AF: 35.85% to 33.20%, p for trend < 0.0001; without AF: 30.11% to 26.90%, p for trend < 0.0001) (Fig. 2, Supplementary Table 6). However, the trend of LOS increased in patients with AF (15.33 to 15.88 days, p for trend = 0.6211) and decreased in patients without AF (17.32 to 15.71 days, p for trend = 0.0015) (Fig. 3, Supplementary Table 7). Declining in-hospital mortality was accompanied by changing discharge status for critically ill patients with AF, with a significant increase to LTACH/SNF (49.27% to 53.87%, p for trend < 0.0001) and a decrease in discharge to home (14.91% to 12.94%, p for trend < 0.0001) (Fig. 4, Supplementary Table 8).

Association of AF with patient and hospital characteristics in critical illness

The temporally increasing trend of AF prevalence persisted over the study period after multivariable adjustment. The prevalence of AF increased by 8% each year from 2008 to 2014 (odds ratio [OR], 1.08; 95% confidence interval [CI], 1.07 to 1.09) (Table 2). Age older than 75 years, white race, Medicare insurance, male sex, higher income, urban teaching hospital, larger hospital bed size,, major operating room procedure, higher ECI score, higher CHA2DS2-VASc score, prior stroke, coronary artery disease, and long-term anticoagulant use were significantly associated with the increased prevalence of AF. Among the comorbidities, deficiency anemia, coagulopathy, hypertension, hypothyroidism, fluid and electrolyte disorders, renal replacement therapy use, obesity, chronic renal failure, and valvular disease were more significantly associated with increased prevalence of AF (Table 2, Supplementary Table 9).

Association between AF and clinical outcomes

The unadjusted in-hospital mortality rate was significantly higher in patients with AF than in those without AF (OR, 1.32; 95% CI, 1.30 to 1.35) (Table 3). When stroke was used as a mediator, only 4.20% of the impact of AF on in-hospital mortality could be attributed to stroke. When bleeding was used as a mediator, only 0.03% of the impact of AF on in-hospital mortality could be attributed to bleeding. After multivariable adjustment, patients with AF still had a 10% higher risk than those without AF (OR, 1.12; 95% CI, 1.10 to 1.13), but the risk of death decreased each year regardless of AF diagnosis.
In the unadjusted regression model, patents with AF had a shorter LOS (−3%, p < 0.0001) and lower hospitalization cost (2%, p = 0.0018). However, after multivariable adjustment, an AF diagnosis was still linked to a prolonged LOS (2%, p < 0.0001) and higher hospitalization cost (5%, p < 0.0001). The LOS (−1%, p < 0.0001) and hospitalization cost (−2%, p < 0.0001) in critically ill patients with AF also decreased each year.

DISCUSSION

Our analysis is the first to evaluate the temporal trends of AF prevalence in adult critically ill patients in the US. Many prior analyses studied the incidence of AF in critically ill patients [3,5,18] but were limited by sample size and lacked the required granularity to evaluate the AF trend. We found that the proportion of critically ill patients with comorbid AF increased from 14.63% in 2008 to 24.43% in 2014. In this analysis of over 2 million critically ill patients, close to 1 in 5 (21.27%) had a diagnosis of AF, a value that was nearly 10-fold higher than that in the general population [1]. This rate is higher than the prevalence of AF reported by previous studies, which was 4.5% to 15% in intensive care unit (ICU) patients [1922], but is lower as per the Seguin and Launey [23] report (46%). The prevalence of AF in critically ill patients increased with age; over 70% of affected patients were over 65 years. The prevalence was also greater among patients who were white, male, and covered by Medicare, a finding that is consistent with a previous report of critically ill patients [24].
With population aging and the increasing prevalence of comorbidities, the prevalence of AF is anticipated to increase [25]. Our analysis indicated that the prevalence of AF increased significantly over the study period, which is consistent with previous studies [4]. The increased prevalence of AF in critically ill patients may be associated with several factors. First, with the development of medical treatments, improvements in survival result in more hospitalizations of critically ill patients, although in-hospital mortality rates are declining [26]. Second, the trend of increased AF prevalence may also be the result of advances in detection and surveillance, while the improved awareness of AF among physicians increased the prevalence of AF as well [27]. Third, the aging of the population and the increase in comorbidities in the general US population also increases AF risk factors [2830]. The same results were seen in patients with end-stage renal disease and end-stage chronic obstructive pulmonary disease [31,32].
AF in critically ill patients may be new-onset or recurrent [33]. Advanced age is considered one of the most potent risk factors for independently predicting AF [34]. In our study, compared to patients younger than 45 years, those older than 75 years were nearly 10-fold more likely to develop AF. In the meantime, each additional year of age was associated with an 8% increase in the risk of developing AF. Admission to a larger urban teaching hospital was significantly associated with AF relative to small and rural hospitals. Larger urban teaching hospitals receive more critically ill patients and have advanced detection and surveillance capabilities [35]. We found that patients with an ECI > 3 were 2.5-fold more likely to develop AF than those with an ECI of 0. Several comorbidities common in critically ill patients are substrates for AF occurrence and potentially impact patient prognosis [36]. Duby et al. [37] reported that the risk of AF in critically ill patients with congestive heart failure, hypertension, or heart disease was 4 to 7 times higher than that of patients without these comorbidities. We found that a higher CHA2DS2-VASc score was significantly associated with the increased prevalence of AF. As a scoring system for predicting cardioembolic risk, CHA2DS2-VASc scores can help clinicians make decisions about antithrombotic therapy, although this has not been validated in critical illness [38].
In our study, the in-hospital mortality decreased from 35.85% to 33.20%. It is possible that treatment advances led to improved survival in critically ill patients. Compared to patients without AF, those with AF had a 10% higher risk of in-hospital mortality, which is lower than that of previous studies [5,39]. Arrigo et al. [5] demonstrated an association between AF and increased risk of in ICU and post-ICU mortality using a prospective observational multi-center cohort study. A prospective single-center study also identified AF as an independent predictor for in-hospital mortality in critical illness [24]. However, their results are limited by small sample sizes. AF can be triggered by accelerated atrial remodeling and arrhythmias, while acute loss of atrial contraction and ventricular tachycardia often result in reduced cardiac output and hemodynamic impairment [40]. Previous studies have showed an increased risk of embolic stroke and heart failure in patients with AF, which can lead to clinical deterioration and mortality [36,41]. Alternatively, AF may simply be a marker of multiple organ failure, leading to increase in-hospital mortality [42]. However, the evidence for AF as an independent risk factor for in-hospital mortality remains limited and further studies are needed. Due to database limitations, our study was limited to in-hospital mortality and was not able to study short-term or long-term post-discharge mortality. We found that patients with AF had a 2% higher risk of prolonged LOS and 4% higher relative hospitalization costs than those without AF; that is, AF exerts a negative impact on hospitalization outcomes.
Managing AF in critically ill patients is challenging, and the strategies used in outpatients may not have the same effect [43]. Meanwhile, the efficacy of antiarrhythmic therapies may be reduced [44], though both rate and rhythm controlling agents are frequently used in the management of critically ill patients. Due to procoagulant activity and ongoing inflammation, the risk of thrombus formation and embolization is higher in critically ill patients [45]. Although guidelines and recommendations are lacking, AF in critically ill patients will trigger anticoagulation [46]. Considering the need for urgent surgery or risk for coagulopathy in the ICU, the choice of anticoagulant is a big problem for physicians, and we cannot exclude the association between mortality and anticoagulant use in critically ill patients [42].
Our study has some strengths. To our knowledge, it is the newest assessment of temporal trends of AF in critically ill patients in the US. Previous studies identified the association between AF and morbidity outcomes and in-hospital mortality, but they were insufficiently sized. To analyze sensitivity, we constructed three models to access the association between AF and patient-specific characteristics and hospital and clinical factors as well as six models to elucidate the associations between in-hospital mortality, LOS, and hospitalization cost and AF. However, our study also has several limitations. We used the ICD-9-CM procedure code to capture the critically ill status. However, the continuous mechanical ventilation does not equal critically ill. There are critically ill patients who are not mechanically ventilated and mechanically ventilated patients who are not critically ill. It’s specific but not sensitive to representative critically ill [12,47]. In addition, we couldn’t evaluate the frequency of new-onset AF, history of recurrent AF or permanent AF in this setting of patients. Compared to true clinical data, the NIS contains administrative data that may be subject to coding errors [48]. Meanwhile, we are not sure that the temporal trend observed in AF prevalence is not related to coding habits. Because mechanical ventilation is a predictive risk factor for AF and the need for mechanical ventilation are significantly greater in patients with AF [49], so the AF prevalence in our study may be higher than estimated. In addition, NIS cannot track personal records or information, including post-discharge survival status. These analyses were based on inpatient participants, so the conclusions can be generalized to inpatient settings. Long-term or post-discharge mortality is beyond the scope of our study, and future studies need to take these aspects into further consideration.
In conclusion, we found that the proportion of critically ill patients with comorbid AF steadily increased from 2008 to 2014 in a large national sample. AF was associated with higher in-hospital mortality, longer LOS, and higher hospitalization costs. More knowledge about the incidence and risk predictors of AF can benefit critical patients; thus, high-level evidence is needed to guide the management of AF in critically ill patients.

KEY MESSAGE

1. The newest assessment of temporal trends of atrial fibrillation (AF) in critically ill patients in the United States.
2. Prevalence of comorbid AF is increasing, particularly in older patients.
3. AF in critical illness was a risk factor for in-hospital death.

Conflict of Interest

No potential conflict of interest relevant to this article was reported.

Acknowledgments

This work was supported by The Fourth Round of Shanghai Three-year Action Plan on Public Health Discipline and Talent Program: Evidence-based Public Health and Health Economics (No. 15GWZK0901).

Figure 1
Temporal atrial fibrillation prevalence in subgroups categorized by age (A), sex (B), race (C), and insurance (D).
kjim-2020-142f1.jpg
Figure 2
Trends in in-hospital mortality in critical illness patients. AF, atrial fibrillation.
kjim-2020-142f2.jpg
Figure 3
Trends in length of stay in critical illness patients. AF, atrial fibrillation.
kjim-2020-142f3.jpg
Figure 4
Trends in discharge status (home and long-term acute care hospital or skilled nursing facility [LTACH/SNF]) for critically ill patients with atrial fibrillation.
kjim-2020-142f4.jpg
Table 1
Baseline characteristics of critical illness patients with and without atrial fibrillation
Variable Atrial fibrillation
Present (n = 548,412) Absent (n = 2,029,754) p value
Age, yr 71.48 ± 0.08 60.15 ± 0.11 < 0.0001
Age group, yr < 0.0001
 18–44 12,698 (2.32) 337,033 (16.60)
 45–64 132,350 (24.13) 832,922 (41.04)
 65–74 158,293 (28.86) 437,421 (21.55)
 ≥ 75 245,071 (44.69) 422,378 (20.81)
Female sex 242,415 (44.20) 924,743 (45.56) < 0.0001
Race < 0.0001
 White 373,079 (68.03) 1,148,796 (56.60)
 Black 60,874 (11.10) 353,268 (17.40)
 Hispanic 36,393 (6.64) 189,589 (9.34)
 Other 35,314 (6.44) 133,625 (6.58)
 Missing 42,752 (7.80) 204,476 (10.07)
Type of insurance < 0.0001
 Medicare 401,854 (73.28) 1,051,519 (51.81)
 Medicaid 41,756 (7.61) 352,518 (17.37)
 Private 82,355 (15.02) 446,891 (22.02)
 Self-pay 11,271 (2.06) 102,862 (5.07)
 Other 11,175 (2.04) 75,965 (3.74)
Income quartile < 0.0001
 Q1 164,735 (30.04) 712,001 (35.08)
 Q2 136,771 (24.94) 512,055 (25.23)
 Q3 130,985 (23.88) 451,192 (22.23)
 Q4 115,920 (21.14) 354,505 (17.47)
Hospital bed size 0.0513
 Small 61,954 (11.30) 217,981 (10.74)
 Medium 127,790 (23.30) 467,814 (23.05)
 Large 358,668 (65.40) 1,343,958 (66.21)
Hospital type < 0.0001
 Rural 27,945 (5.10) 105,971 (5.22)
 Urban non-teaching 210,056 (38.30) 708,199 (34.89)
 Urban teaching 310,411 (56.60) 1,215,584 (59.89)
Hospital region < 0.0001
 Northeast 106,250 (19.37) 412,274 (20.31)
 Midwest 124,624 (22.72) 415,599 (20.48)
 South 202,648 (36.95) 796,770 (39.25)
 West 114,889 (20.95) 405,111 (19.96)
 Elective 71,652 (13.09) 226,196 (11.18) < 0.0001
Elixhauser Comorbidity Index < 0.0001
 0 4,076 (0.74) 59,183 (2.92)
 1 19,952 (3.64) 167,890 (8.27)
 2 47,377 (8.64) 280,748 (13.83)
 ≥ 3 477,007 (86.98) 1,521,932 (74.98)
Major operating room procedure 133,955 (24.43) 475,624 (23.43) < 0.0001
Tracheostomy 109,653 (19.99) 456,056 (22.47) < 0.0001
Long-term anticoagulants 46,527 (8.48) 31,122 (1.53) < 0.0001
Coronary artery disease 178,355 (32.52) 336,474 (16.58) < 0.0001
Prior stroke 54,728 (9.98) 137,032 (6.75) < 0.0001
CHA2DS2-VASC 3.10 (1.88–4.30) 1.80 (0.56–3.19) < 0.0001
Phenotypes of critically ill
 Pneumonia 351,695 (64.13) 1,274,619 (62.80) < 0.0001
 Severe sepsis 267,766 (48.83) 1,002,057 (49.37) 0.0218
 COPD exacerbation 72,951 (13.30) 209,021 (10.30) < 0.0001
 Asthma exacerbation 9,406 (1.72) 46,964 (2.31) < 0.0001
 Congestive heart failure exacerbation 103,704 (18.91) 217,379 (10.71) < 0.0001
 Acute stroke 21,655 (3.95) 109,685 (5.40) < 0.0001
 Acute coronary syndrome 70,070 (12.78) 223,085 (10.99) < 0.0001
 Cardiac arrest. 15,917 (2.90) 47,040 (2.32) < 0.0001
Organs failure (0, 1, 2, ≥ 3) < 0.0001
 0 106,538 (19.43) 500,667 (24.67)
 1 179,079 (32.65) 655,771 (32.31)
 2 148,563 (27.09) 501,398 (24.70)
 ≥ 3 114,232 (20.83) 371,918 (18.32)
Discharge status < 0.0001
 Home 73,171 (13.34) 448,200 (22.08)
 LTACH/SNF 292,161 (53.27) 1,024,328 (50.47)
 Death 183,079 (33.38) 557,225 (27.45)
LOS, day 16.14 (10.32–24.91) 16.33 (10.20–26.33) < 0.0001
Adjusted cost, dollar 56,468.98 (34,457.05–94,727.91) 55,716.04 (34,577.59–91,424.39) < 0.0001

Values are presented as mean ± SE, number (%), or median (interquartile range).

COPD, chronic obstructive pulmonary disease; IMV, invasive mechanical ventilation; LTACH/SNF, long-term acute care hospital or skilled nursing facility; LOS, length of stay.

Table 2
Association of comorbid atrial fibrillation with patient and hospital characteristics in critical illness
Variable Unadjusted model 1 Multivariable model 2a Multivariable model 3b


OR (95% CI) p value OR (95% CI) p value OR (95% CI) p value
Year, per unit increase 1.09 (1.08–1.10) < 0.0001 1.07 (1.07–1.08) < 0.0001 1.08 (1.07–1.09) < 0.0001

Age, yr

 Per unit increase 1.05 (1.05–1.05) < 0.0001 1.04 (1.04–1.04) < 0.0001 1.05 (1.05–1.05) < 0.0001

 45–64 vs. 18–44 4.22 (4.03–4.41) < 0.0001 3.28 (3.13–3.43) < 0.0001 3.22 (3.07–3.37) < 0.0001

 65–74 vs. 18–44 9.60 (9.17–10.1) < 0.0001 5.56 (5.28–5.84) < 0.0001 6.08 (5.79–6.39) < 0.0001

 ≥ 75 vs. 18–44 15.39 (14.7–16.1) < 0.0001 7.69 (7.28–8.12) < 0.0001 9.55 (9.07–10.0) < 0.0001

Race

 Black vs. white 0.53 (0.51–0.55) < 0.0001 0.57 (0.56–0.59) < 0.0001 0.61 (0.59–0.62) < 0.0001

 Hispanic vs. white 0.59 (0.57–0.62) < 0.0001 0.65 (0.62–0.67) < 0.0001 0.67 (0.65–0.70) < 0.0001

 Others vs. white 0.81 (0.78–0.85) < 0.0001 0.79 (0.76–0.82) < 0.0001 0.82 (0.78–0.85) < 0.0001

 Missing vs. white 0.64 (0.60–0.69) < 0.0001 0.79 (0.74–0.83) < 0.0001 0.81 (0.76–0.87) < 0.0001

Insurance

 Medicaid vs. Medicare 0.31 (0.30–0.32) < 0.0001 0.89 (0.86–0.92) < 0.0001 0.92 (0.89–0.96) < 0.0001

 Private vs. Medicare 0.48 (0.47–0.49) < 0.0001 1.02 (1.00–1.05) 0.0543 1.02 (1.00–1.05) 0.0593

 Self-pay vs. Medicare 0.29 (0.27–0.31) < 0.0001 0.88 (0.83–0.92) < 0.0001 0.92 (0.87–0.97) 0.0020

 Others vs. Medicare 0.38 (0.36–0.41) < 0.0001 0.90 (0.86–0.95) < 0.0001 0.92 (0.87–0.97) 0.0011

Female 0.95 (0.93–0.96) < 0.0001 0.70 (0.69–0.72) < 0.0001 0.82 (0.81–0.83) < 0.0001

Income quartile

 Q2 vs. Q1 1.15 (1.13–1.18) < 0.0001 1.03 (1.01–1.05) 0.0141 1.02 (1.00–1.05) 0.0801

 Q3 vs. Q1 1.25 (1.22–1.29) < 0.0001 1.08 (1.06–1.11) < 0.0001 1.07 (1.05–1.10) < 0.0001

 Q4 vs. Q1 1.41 (1.37–1.46) < 0.0001 1.15 (1.12–1.18) < 0.0001 1.14 (1.11–1.17) < 0.0001

Hospital bed size

 Medium vs. small 0.96 (0.91–1.01) 0.1506 1.03 (0.98–1.07) 0.2428 1.03 (0.99–1.08) 0.1793

 Large vs. small 0.94 (0.89–0.99) 0.0141 1.09 (1.04–1.13) < 0.0001 1.10 (1.05–1.15) < 0.0001

Hospital type

 Urban nonteaching vs. rural 1.12 (1.05–1.21) 0.0011 1.05 (0.99–1.12) 0.0756 1.04 (0.98–1.11) 0.1580

 Urban teaching vs. rural 0.97 (0.90–1.04) 0.3773 1.08 (1.02–1.15) 0.0106 1.10 (1.04–1.17) 0.0015

Hospital region

 Midwest vs. northeast 1.16 (1.09–1.24) < 0.0001 1.20 (1.15–1.26) < 0.0001 1.15 (1.10–1.21) < 0.0001

 South vs. northeast 0.99 (0.93–1.05) 0.6629 1.06 (1.01–1.11) 0.0108 1.02 (0.98–1.07) 0.3488

 West vs. northeast 1.10 (1.04–1.17) 0.0013 1.10 (1.05–1.15) < 0.0001 1.11 (1.06–1.16) < 0.0001

 Elective 1.20 (1.15–1.25) < 0.0001 1.15 (1.11–1.19) < 0.0001 1.14 (1.10–1.18) < 0.0001

Elixhauser Comorbidity Index

 1 vs. 0 1.73 (1.58–1.89) < 0.0001 1.48 (1.35–1.62) < 0.0001

 2 vs. 0 2.45 (2.24–2.68) < 0.0001 1.84 (1.68–2.03) < 0.0001

 ≥ 3 vs. 0 4.55 (4.14–5.00) < 0.0001 2.55 (2.30–2.82) < 0.0001

Major operating room procedure 1.06 (1.04–1.08) < 0.0001 1.03 (1.01–1.05) 0.0036 1.06 (1.04–1.08) < 0.0001

Long-term anticoagulants 5.95 (5.69–6.23) < 0.0001 4.87 (4.66–5.09) < 0.0001 4.54 (4.35–4.74) < 0.0001

CHA2DS2-VASC score 1.41 (1.40–1.41) < 0.0001 1.19 (1.18–1.20) < 0.0001

Prior stroke 1.53 (1.49–1.57) < 0.0001 1.13 (1.10–1.17) < 0.0001

Coronary artery disease 2.43 (2.38–2.48) < 0.0001 1.39 (1.36–1.42) < 0.0001

AIDS 0.25 (0.21–0.31) < 0.0001 0.64 (0.52–0.78) < 0.0001

Alcohol abuse 0.56 (0.54–0.57) < 0.0001 0.92 (0.89–0.95) < 0.0001

Deficiency anemias 1.28 (1.25–1.31) < 0.0001 1.10 (1.08–1.12) < 0.0001

Rheumatoid arthritis 1.12 (1.07–1.17) < 0.0001 1.04 (1.00–1.09) 0.0667

Chronic blood loss anemia 1.16 (1.09–1.22) < 0.0001 1.09 (1.03–1.16) 0.0024

Congestive heart failure 2.40 (2.35–2.44) < 0.0001 1.58 (1.56–1.61) < 0.0001

Chronic pulmonary disease 1.51 (1.48–1.54) < 0.0001 1.15 (1.13–1.17) < 0.0001

Coagulopathy 1.19 (1.16–1.21) < 0.0001 1.24 (1.22–1.27) < 0.0001

Depression 0.94 (0.91–0.96) < 0.0001 0.91 (0.89–0.94) < 0.0001

Diabetes, uncomplicated 1.40 (1.37–1.43) < 0.0001 1.06 (1.04–1.08) < 0.0001

Diabetes with chronic complications 1.18 (1.15–1.22) < 0.0001 0.93 (0.90–0.96) < 0.0001

Drug abuse 0.34 (0.32–0.35) < 0.0001 0.78 (0.75–0.83) < 0.0001

Hypertension 1.78 (1.75–1.82) < 0.0001 1.20 (1.18–1.23) < 0.0001

Hypothyroidism 1.62 (1.58–1.66) < 0.0001 1.16 (1.13–1.19) < 0.0001

Liver disease 0.65 (0.63–0.67) < 0.0001 0.90 (0.87–0.94) < 0.0001

Lymphoma 1.06 (1.00–1.13) 0.0455 0.98 (0.91–1.04) 0.4764

Fluid and electrolyte disorders 1.12 (1.09–1.14) < 0.0001 1.04 (1.02–1.06) < 0.0001

Metastatic cancer 0.89 (0.86–0.93) < 0.0001 0.94 (0.90–0.98) 0.0024

Other neurological disorders 0.81 (0.79–0.83) < 0.0001 0.88 (0.86–0.90) < 0.0001

Obesity 1.19 (1.17–1.22) < 0.0001 1.20 (1.17–1.23) < 0.0001

Paralysis 0.80 (0.78–0.82) < 0.0001 0.92 (0.89–0.95) < 0.0001

Peripheral vascular disorders 1.61 (1.57–1.65) < 0.0001 1.05 (1.02–1.07) 0.0003

Psychoses 0.61 (0.58–0.63) < 0.0001 0.80 (0.77–0.83) < 0.0001

Pulmonary circulation disorders 1.67 (1.63–1.71) < 0.0001 1.25 (1.22–1.28) < 0.0001

Renal failure 1.62 (1.59–1.65) < 0.0001 1.07 (1.04–1.09) < 0.0001

Solid tumor without metastasis 1.20 (1.15–1.24) < 0.0001 0.99 (0.95–1.03) 0.4994

Peptic ulcer disease 1.00 (0.74–1.34) < 0.0001 0.97 (0.71–1.31) 0.8194

Valvular disease 2.87 (2.79–2.95) < 0.0001 1.63 (1.58–1.68) < 0.0001

Weight loss 1.02 (1.00–1.05) 0.0403 0.97 (0.95–0.99) 0.0068

OR, odds ratio; CI, confidence interval; AIDS, acquired immunodeficiency syndrome.

a Multivariable model 2: obtained from logistic regression model accounting for survey design and adjusting for year, age, race, insurance, sex, income, hospital region, hospital location/teaching status, hospital bed size, elective, Elixhauser Comorbidity Index, major operating room procedure, long-term anticoagulants, CHA2DS2-VASC score.

b Multivariable model 3: multivariable model 2 exclude Elixhauser Comorbidity Index and CHA2DS2-VASc scores, and added prior stroke, coronary artery disease, AIDS, alcohol abuse, deficiency anemias, rheumatoid arthritis, chronic blood loss anemia, congestive heart failure, chronic pulmonary disease, coagulopathy, depression, diabetes, uncomplicated, diabetes with chronic complications, drug abuse, hypertension, hypothyroidism, liver disease, lymphoma, fluid and electrolyte disorders, metastatic cancer, other neurological disorders, obesity, paralysis, peripheral vascular disorders, psychoses, pulmonary circulation disorders, renal failure, solid tumor without metastasis, peptic ulcer disease, valvular disease, weight loss.

Table 3
Association of AF with clinical outcomes in critical illness
Model Died, OR (95% Cl) Length of stay Adjusted cost


Estimate p value Estimate p value Estimate p value
Association of AF compared to no AF with each outcome among all participants

 Model A 1.32 (1.30–1.35) < 0.0001 −0.03 < 0.0001 −0.02 0.0018

 Model B 1.12 (1.10–1.13) < 0.0001 0.02 < 0.0001 0.05 < 0.0001

Association of each outcome with unit increase in year when restricted to participants with comorbid AF

 Model A 0.99 (0.98–0.99) 0.0007 −0.01 0.0174 −0.03 < 0.0001

 Model B 0.99 (0.98–1.00) 0.0184 −0.01 0.0156 −0.02 < 0.0001

Association of each outcome with unit increase in year when restricted to participants without comorbid AF

 Model A 0.98 (0.97–0.98) < 0.0001 −0.02 < 0.0001 −0.03 < 0.0001

 Model B 0.98 (0.98–0.99) < 0.0001 −0.02 < 0.0001 −0.03 < 0.0001

Model A: AF as the single predictor; Multivariable model B: adjusted for demographic factors, hospital factors, Elixhauser Comorbidity Index, anticoagulants, and CHA2DS2-VASC score.

AF, atrial fibrillation; OR, odds ratio; CI, confidence interval.

REFERENCES

1. Kirchhof P. The future of atrial fibrillation management: integrated care and stratified therapy. Lancet 2017;390:1873–1887.
crossref pmid
2. Go AS, Hylek EM, Phillips KA, et al. Prevalence of diagnosed atrial fibrillation in adults: national implications for rhythm management and stroke prevention: the AnTicoagulation and Risk Factors in Atrial Fibrillation (ATRIA) Study. JAMA 2001;285:2370–2375.
crossref pmid
3. Yoshida T, Uchino S, Yokota T, Fujii T, Uezono S, Takinami M. The impact of sustained new-onset atrial fibrillation on mortality and stroke incidence in critically ill patients: a retrospective cohort study. J Crit Care 2018;44:267–272.
crossref pmid
4. Yoshida T, Fujii T, Uchino S, Takinami M. Epidemiology, prevention, and treatment of new-onset atrial fibrillation in critically ill: a systematic review. J Intensive Care 2015;3:19.
crossref pmid pmc
5. Arrigo M, Ishihara S, Feliot E, et al. New-onset atrial fibrillation in critically ill patients and its association with mortality: a report from the FROG-ICU study. Int J Cardiol 2018;266:95–99.
crossref pmid
6. Mitric G, Udy A, Bandeshe H, Clement P, Boots R. Variable use of amiodarone is associated with a greater risk of recurrence of atrial fibrillation in the critically ill. Crit Care 2016;20:90.
crossref pmid pmc
7. Reinelt P, Karth GD, Geppert A, Heinz G. Incidence and type of cardiac arrhythmias in critically ill patients: a single center experience in a medical-cardiological ICU. Intensive Care Med 2001;27:1466–1473.
crossref pmid
8. Lip GYH, Banerjee A, Boriani G, et al. Antithrombotic therapy for atrial fibrillation: chest guideline and expert panel report. Chest 2018;154:1121–1201.
crossref pmid
9. January CT, Wann LS, Calkins H, et al. 2019 AHA/ACC/HRS focused update of the 2014 AHA/ACC/HRS guideline for the management of patients with atrial fibrillation: a report of the American College of Cardiology/American Heart Association task force on clinical practice guidelines and the Heart Rhythm Society in collaboration with the Society of Thoracic Surgeons. Circulation 2019;140:e125–e151.
pmid
10. Chean CS, McAuley D, Gordon A, Welters ID. Current practice in the management of new-onset atrial fibrillation in critically ill patients: a UK-wide survey. PeerJ 2017;5:e3716.
crossref pmid pmc
11. Healthcare Cost and Utilization Project. Overview of the National (Nationwide) Inpatient Sample (NIS) [Internet] Rockville (MD): HCUP, 2019. [cited 2020 Jun 24]. Available from: https://www.hcup-us.ahrq.gov/nisoverview.jsp .

12. Hill CE, Blank LJ, Thibault D, et al. Continuous EEG is associated with favorable hospitalization outcomes for critically ill patients. Neurology 2019;92:e9–e18.
crossref pmid pmc
13. Ghaferi AA, Osborne NH, Birkmeyer JD, Dimick JB. Hospital characteristics associated with failure to rescue from complications after pancreatectomy. J Am Coll Surg 2010;211:325–330.
crossref pmid
14. Lieffers JR, Baracos VE, Winget M, Fassbender K. A comparison of Charlson and Elixhauser comorbidity measures to predict colorectal cancer survival using administrative health data. Cancer 2011;117:1957–1965.
crossref pmid
15. Otite FO, Khandelwal P, Chaturvedi S, Romano JG, Sacco RL, Malik AM. Increasing atrial fibrillation prevalence in acute ischemic stroke and TIA. Neurology 2016;87:2034–2042.
crossref pmid pmc
16. Kumar G, Majumdar T, Jacobs ER, et al. Outcomes of morbidly obese patients receiving invasive mechanical ventilation: a nationwide analysis. Chest 2013;144:48–54.
crossref pmid pmc
17. Alonso A, Agarwal SK, Soliman EZ, et al. Incidence of atrial fibrillation in whites and African-Americans: the Atherosclerosis Risk in Communities (ARIC) study. Am Heart J 2009;158:111–117.
crossref pmid pmc
18. Chen AY, Sokol SS, Kress JP, Lat I. New-onset atrial fibrillation is an independent predictor of mortality in medical intensive care unit patients. Ann Pharmacother 2015;49:523–527.
crossref pmid
19. Seguin P, Signouret T, Laviolle B, Branger B, Malledant Y. Incidence and risk factors of atrial fibrillation in a surgical intensive care unit. Crit Care Med 2004;32:722–726.
crossref pmid
20. Seguin P, Laviolle B, Maurice A, Leclercq C, Malledant Y. Atrial fibrillation in trauma patients requiring intensive care. Intensive Care Med 2006;32:398–404.
crossref pmid
21. Meierhenrich R, Steinhilber E, Eggermann C, et al. Incidence and prognostic impact of new-onset atrial fibrillation in patients with septic shock: a prospective observational study. Crit Care 2010;14:R108.
crossref pmid pmc
22. Makrygiannis SS, Margariti A, Rizikou D, et al. Incidence and predictors of new-onset atrial fibrillation in noncardiac intensive care unit patients. J Crit Care 2014;29:697.
crossref pmid
23. Seguin P, Launey Y. Atrial fibrillation is not just an artefact in the ICU. Crit Care 2010;14:182.
crossref pmid pmc
24. Shaver CM, Chen W, Janz DR, et al. Atrial fibrillation is an independent predictor of mortality in critically Ill patients. Crit Care Med 2015;43:2104–2111.
crossref pmid pmc
25. Krijthe BP, Kunst A, Benjamin EJ, et al. Projections on the number of individuals with atrial fibrillation in the European Union, from 2000 to 2060. Eur Heart J 2013;34:2746–2751.
crossref pmid pmc
26. Schnabel RB, Yin X, Gona P, et al. 50 Year trends in atrial fibrillation prevalence, incidence, risk factors, and mortality in the Framingham Heart Study: a cohort study. Lancet 2015;386:154–162.
crossref pmid pmc
27. Taggar JS, Coleman T, Lewis S, Heneghan C, Jones M. Accuracy of methods for diagnosing atrial fibrillation using 12-lead ECG: a systematic review and meta-analysis. Int J Cardiol 2015;184:175–183.
crossref pmid
28. Menke A, Rust KF, Fradkin J, Cheng YJ, Cowie CC. Associations between trends in race/ethnicity, aging, and body mass index with diabetes prevalence in the United States: a series of cross-sectional studies. Ann Intern Med 2014;161:328–335.
crossref pmid
29. Flegal KM, Kruszon-Moran D, Carroll MD, Fryar CD, Ogden CL. Trends in obesity among adults in the United States, 2005 to 2014. JAMA 2016;315:2284–2291.
crossref pmid
30. Menke A, Casagrande S, Geiss L, Cowie CC. Prevalence of and trends in diabetes among adults in the United States, 1988–2012. JAMA 2015;314:1021–1029.
crossref pmid
31. Kumar N, Khera R, Garg N. Atrial fibrillation associated hospitalizations in patients with end-stage renal disease in the United States, 2003–2012. Heart Rhythm 2016;13:2027–2033.
crossref pmid
32. Xiao X, Han H, Wu C, et al. Prevalence of atrial fibrillation in hospital encounters with end-stage COPD on home oxygen: national trends in the United States. Chest 2019;155:918–927.
crossref pmid
33. Crawford TC, Oral H. Cardiac arrhythmias: management of atrial fibrillation in the critically ill patient. Crit Care Clin 2007;23:855–872.
crossref pmid
34. Makrygiannis SS, Rizikou D, Patsourakos NG, et al. New-onset atrial fibrillation and clinical outcome in non-cardiac intensive care unit patients. Aust Crit Care 2018;31:274–277.
crossref pmid
35. Lin MP, Ma J, Weissman JS, Bernard KR, Schuur JD. Hospital-level variation and predictors of admission after ED visits for atrial fibrillation: 2006 to 2011. Am J Emerg Med 2016;34:2094–2100.
crossref pmid
36. Moss TJ, Calland JF, Enfield KB, et al. New-onset atrial fibrillation in the critically Ill. Crit Care Med 2017;45:790–797.
crossref pmid pmc
37. Duby JJ, Heintz SJ, Bajorek SA, Heintz BH, Durbin-Johnson BP, Cocanour CS. Prevalence and course of atrial fibrillation in critically Ill trauma patients. J Intensive Care Med 2017;32:140–145.
crossref pmid
38. Lip GY, Nieuwlaat R, Pisters R, Lane DA, Crijns HJ. Refining clinical risk stratification for predicting stroke and thromboembolism in atrial fibrillation using a novel risk factor-based approach: the euro heart survey on atrial fibrillation. Chest 2010;137:263–272.
crossref pmid
39. Gupta S, Tiruvoipati R, Green C. Atrial fibrillation and mortality in critically Ill patients: a retrospective study. Am J Crit Care 2015;24:336–341.
crossref pmid
40. Bosch NA, Cimini J, Walkey AJ. Atrial fibrillation in the ICU. Chest 2018;154:1424–1434.
crossref pmid pmc
41. Walkey AJ, Wiener RS, Ghobrial JM, Curtis LH, Benjamin EJ. Incident stroke and mortality associated with new-onset atrial fibrillation in patients hospitalized with severe sepsis. JAMA 2011;306:2248–2254.
crossref pmid pmc
42. Sibley S, Muscedere J. New-onset atrial fibrillation in critically ill patients. Can Respir J 2015;22:179–182.
crossref pmid pmc
43. Morelli A, Ertmer C, Westphal M, et al. Effect of heart rate control with esmolol on hemodynamic and clinical outcomes in patients with septic shock: a randomized clinical trial. JAMA 2013;310:1683–1691.
crossref pmid
44. Rudiger A, Breitenstein A, Arrigo M, Salzberg SP, Bettex D. Suitability, efficacy, and safety of vernakalant for new onset atrial fibrillation in critically ill patients. Crit Care Res Pract 2014;2014:826286.
crossref pmid pmc
45. Watson T, Shantsila E, Lip GY. Mechanisms of thrombogenesis in atrial fibrillation: Virchow’s triad revisited. Lancet 2009;373:155–166.
crossref pmid
46. Klein Klouwenberg PM, Frencken JF, Kuipers S, et al. Incidence, predictors, and outcomes of new-onset atrial fibrillation in critically Ill patients with sepsis: a cohort study. Am J Respir Crit Care Med 2017;195:205–211.
crossref pmid
47. Kerlin MP, Weissman GE, Wonneberger KA, et al. Validation of administrative definitions of invasive mechanical ventilation across 30 intensive care units. Am J Respir Crit Care Med 2016;194:1548–1552.
crossref pmid pmc
48. Lawthers AG, McCarthy EP, Davis RB, Peterson LE, Palmer RH, Iezzoni LI. Identification of in-hospital complications from claims data. Is it valid? Med Care 2000;38:785–795.
pmid
49. Carrera P, Thongprayoon C, Cheungpasitporn W, Iyer VN, Moua T. Epidemiology and outcome of new-onset atrial fibrillation in the medical intensive care unit. J Crit Care 2016;36:102–106.
crossref pmid

Editorial Office
101-2501, Lotte Castle President, 109 Mapo-daero, Mapo-gu, Seoul 04146, Korea
Tel: +82-2-2271-6792    Fax: +82-2-790-0993    E-mail: kaim@kams.or.kr                

Copyright © 2024 by Korean Association of Internal Medicine.

Close layer
prev next