


INTRODUCTION
Because osteoporotic fractures are associated with high morbidity and mortality [1,2], it is important to prevent fractures through the early detection of high fracture risk and appropriate treatment. Low bone mineral density (BMD) is the strongest predictor of osteoporotic fractures [3]. However, combining BMD with clinical risk factors yields better fracture risk prediction than BMD alone [4,5]. Accordingly, algorithms that combine clinical risk factors with BMD have been developed to better estimate fracture risk and several studies have compared the efficacies, strengths, and limitations of numerous predictive models for osteoporotic fractures [6]. Among the prediction models for osteoporotic fractures, the World Health Organization Fracture Risk Assessment Tool (FRAX) algorithm [7], Qfracture algorithm [8], and Garvan Fracture Risk Calculator (Garvan) [9] are the most commonly used. Because FRAX is the most externally validated model [6], several international guidelines recommend its use for fracture risk assessment. As the risk and incidence of osteoporotic fractures vary widely between populations [10], it is necessary to develop ethnicity-specific predictive models for osteoporotic fracture risk; however, Asian-specific prediction models for estimating the individual risk of osteoporotic fractures remain rare. Therefore, a Korean fracture risk prediction model based on clinical risk factors was developed in previous study [11]. However, previously developed fracture risk assessment tools are limited in the clinical practice because they are too complicated and involve many risk factors. Additionally, because they are dependent on the recall of family history and past history of fractures, their accuracy can be limited in elderly populations. Moreover, because they assess the 10-year fracture risk, they cannot be applied to predict the imminent risk of fractures. This study aimed to develop a simpler and more practical fracture risk prediction model to predict the imminent risk of fractures in elderly Korean women.
METHODS
Study population
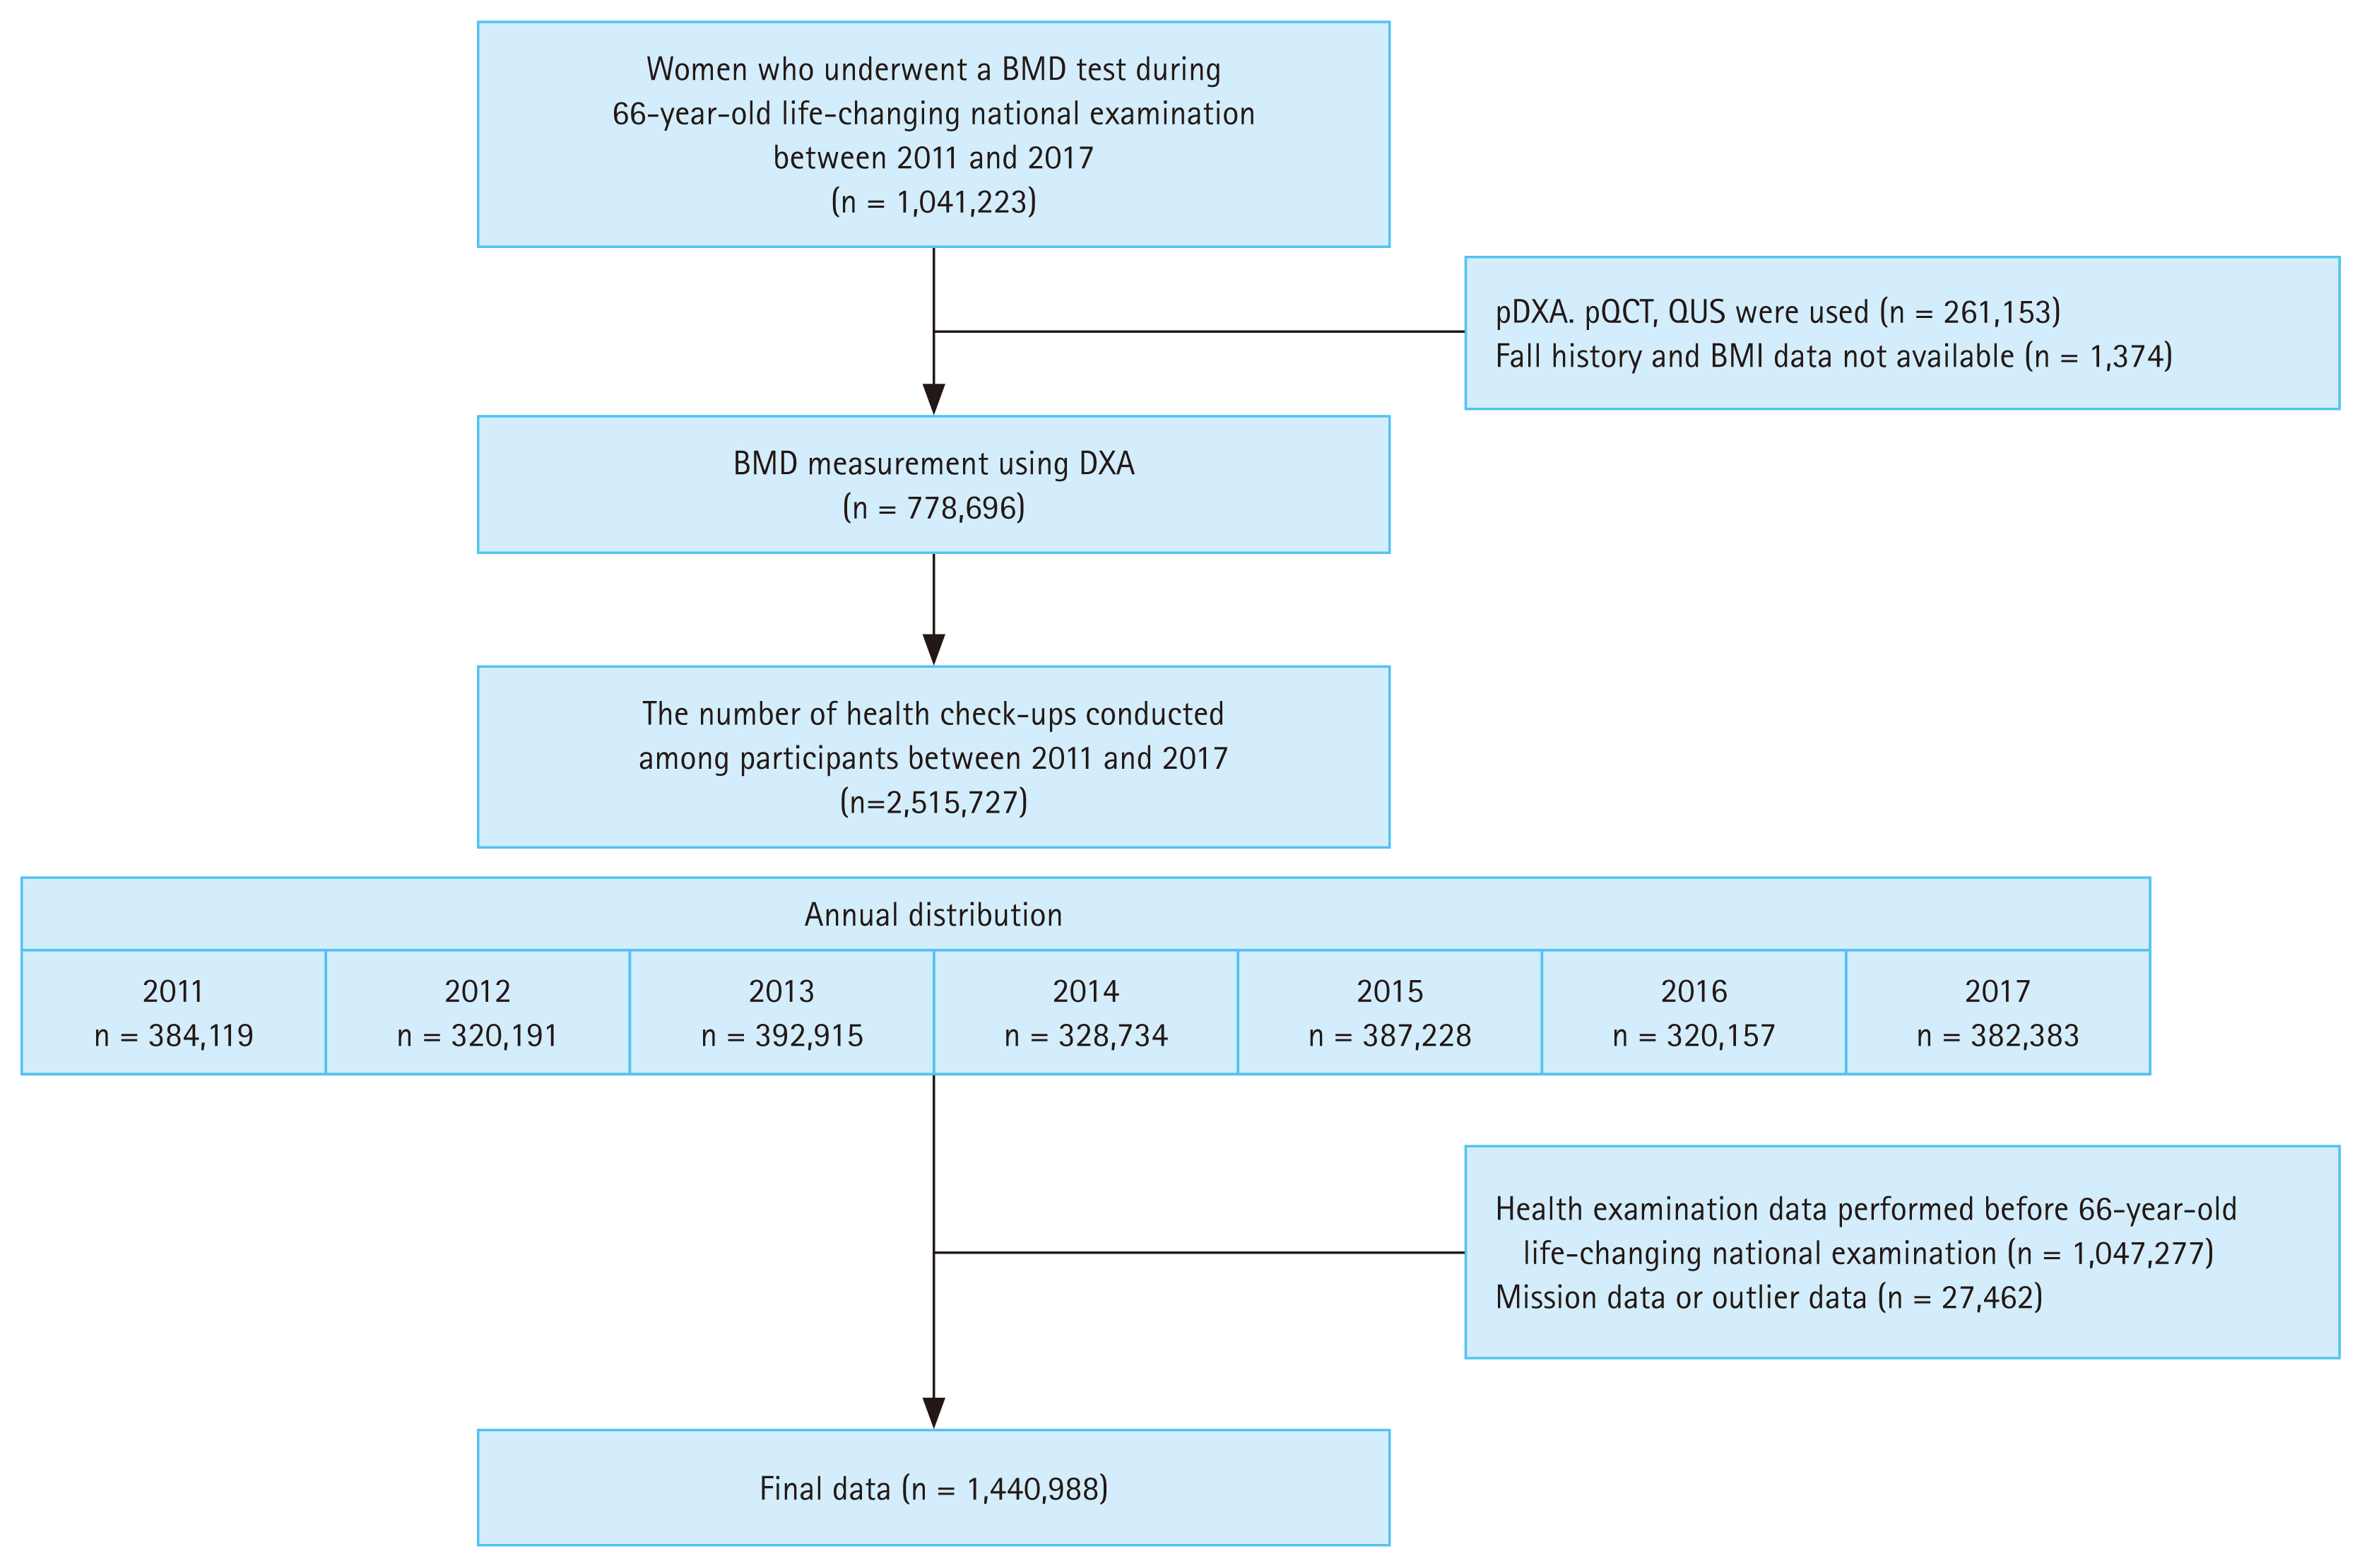
Data from postmenopausal women aged 66 years who underwent a national life-transition examination in Korea between January 2011 and December 2017 were reviewed using the Korean National Health Insurance (KNHI) claims database, covering the period from 2009 to 2019. The KNHI claims database contains information on diagnoses, drug prescriptions, and procedures according to the International Classification of Diseases, 10th revision (ICD-10). Briefly, in the 66-year-old national life-transition examination, a physical examination, BMD tests, vision and hearing tests, depression screening tests, chest radiography, and blood tests are performed, and drinking and smoking histories are recorded. Fall history within the previous 6-months is also recorded. Among eligible participants who underwent a BMD test (n = 1,041,223), participants were excluded if there were no data on fall history or body mass index (BMI). Individuals with BMD measured using peripheral DXA, peripheral quantitative computed tomography, or quantitative ultrasonography were also excluded. Finally, 778,696 women with BMD measured using dual-energy X-ray absorptiometry (DXA) were included in the study cohort. Considering that health examinations are conducted for each person every two years, their repeated health examination data between 2011 and 2017 were collected using the KNHI claims database (n = 2,515,727). The number of health examinations conducted annually is shown in Figure 1. After excluding missing and outlier data, 1,440,988 cases were ultimately included (Fig. 1). The index date was defined as the date of the health examination. An example of the collection process in one individual is shown in Supplementary Figure 1.
Clinical risk factors
Clinical data, including BMD test results, age at the time of health examination, BMI, history of falls in the last 6 months, history of past or recent fractures, and recurrent fractures, were collected. Based on the BMD results, the participants were classified as normal, osteopenia, or osteoporosis. They were additionally divided by age into two groups: Ōēź 65 and < 70 years, Ōēź 70 years. For BMI, the most recent value from a health examination administered every 2 years was used. Missing or outlier BMI data were imputed by calculating the mean BMI values from health examinations performed more than three times. Participants were divided into five BMI groups: < 20, Ōēź 20 and < 23, Ōēź 23 and < 25, Ōēź 25 and < 27.5, and Ōēź 27.5 kg/m2. A past fracture was defined as any fracture that occurred within 3 years prior to the index date. A recent fracture was defined as a fracture that occurred within 1 year prior to the index date. A recurrent fracture was defined as two or more fractures of any type that occurred 6 months apart within 3 years prior to the index date. The sites of past, recent, and recurrent fractures were defined as hip, spine, distal radius, and proximal humeral fractures.
Study outcomes
The primary outcome was the incidence of major osteoporotic fractures (MOFs) within 3 years of the index date. Secondary outcomes included hip fractures within 3 years or MOFs or hip fractures within 1 year of the index date. MOFs involve the hip, spine, distal radius, and proximal humerus, and are defined using the following ICD-10 diagnosis and procedure codes: hip fracture (S72.0, S72.1), vertebral fracture (S22.0, S22.1, S32.0, T080, M48.4, M48.5, M49.5), humeral fracture (S42.2, S42.3), and distal radial fracture (S52.5, S52.6).
Statistical analysis and development of the Simple Assessment tool for predict imminent risk of Fracture in Elderly women (SAFE)
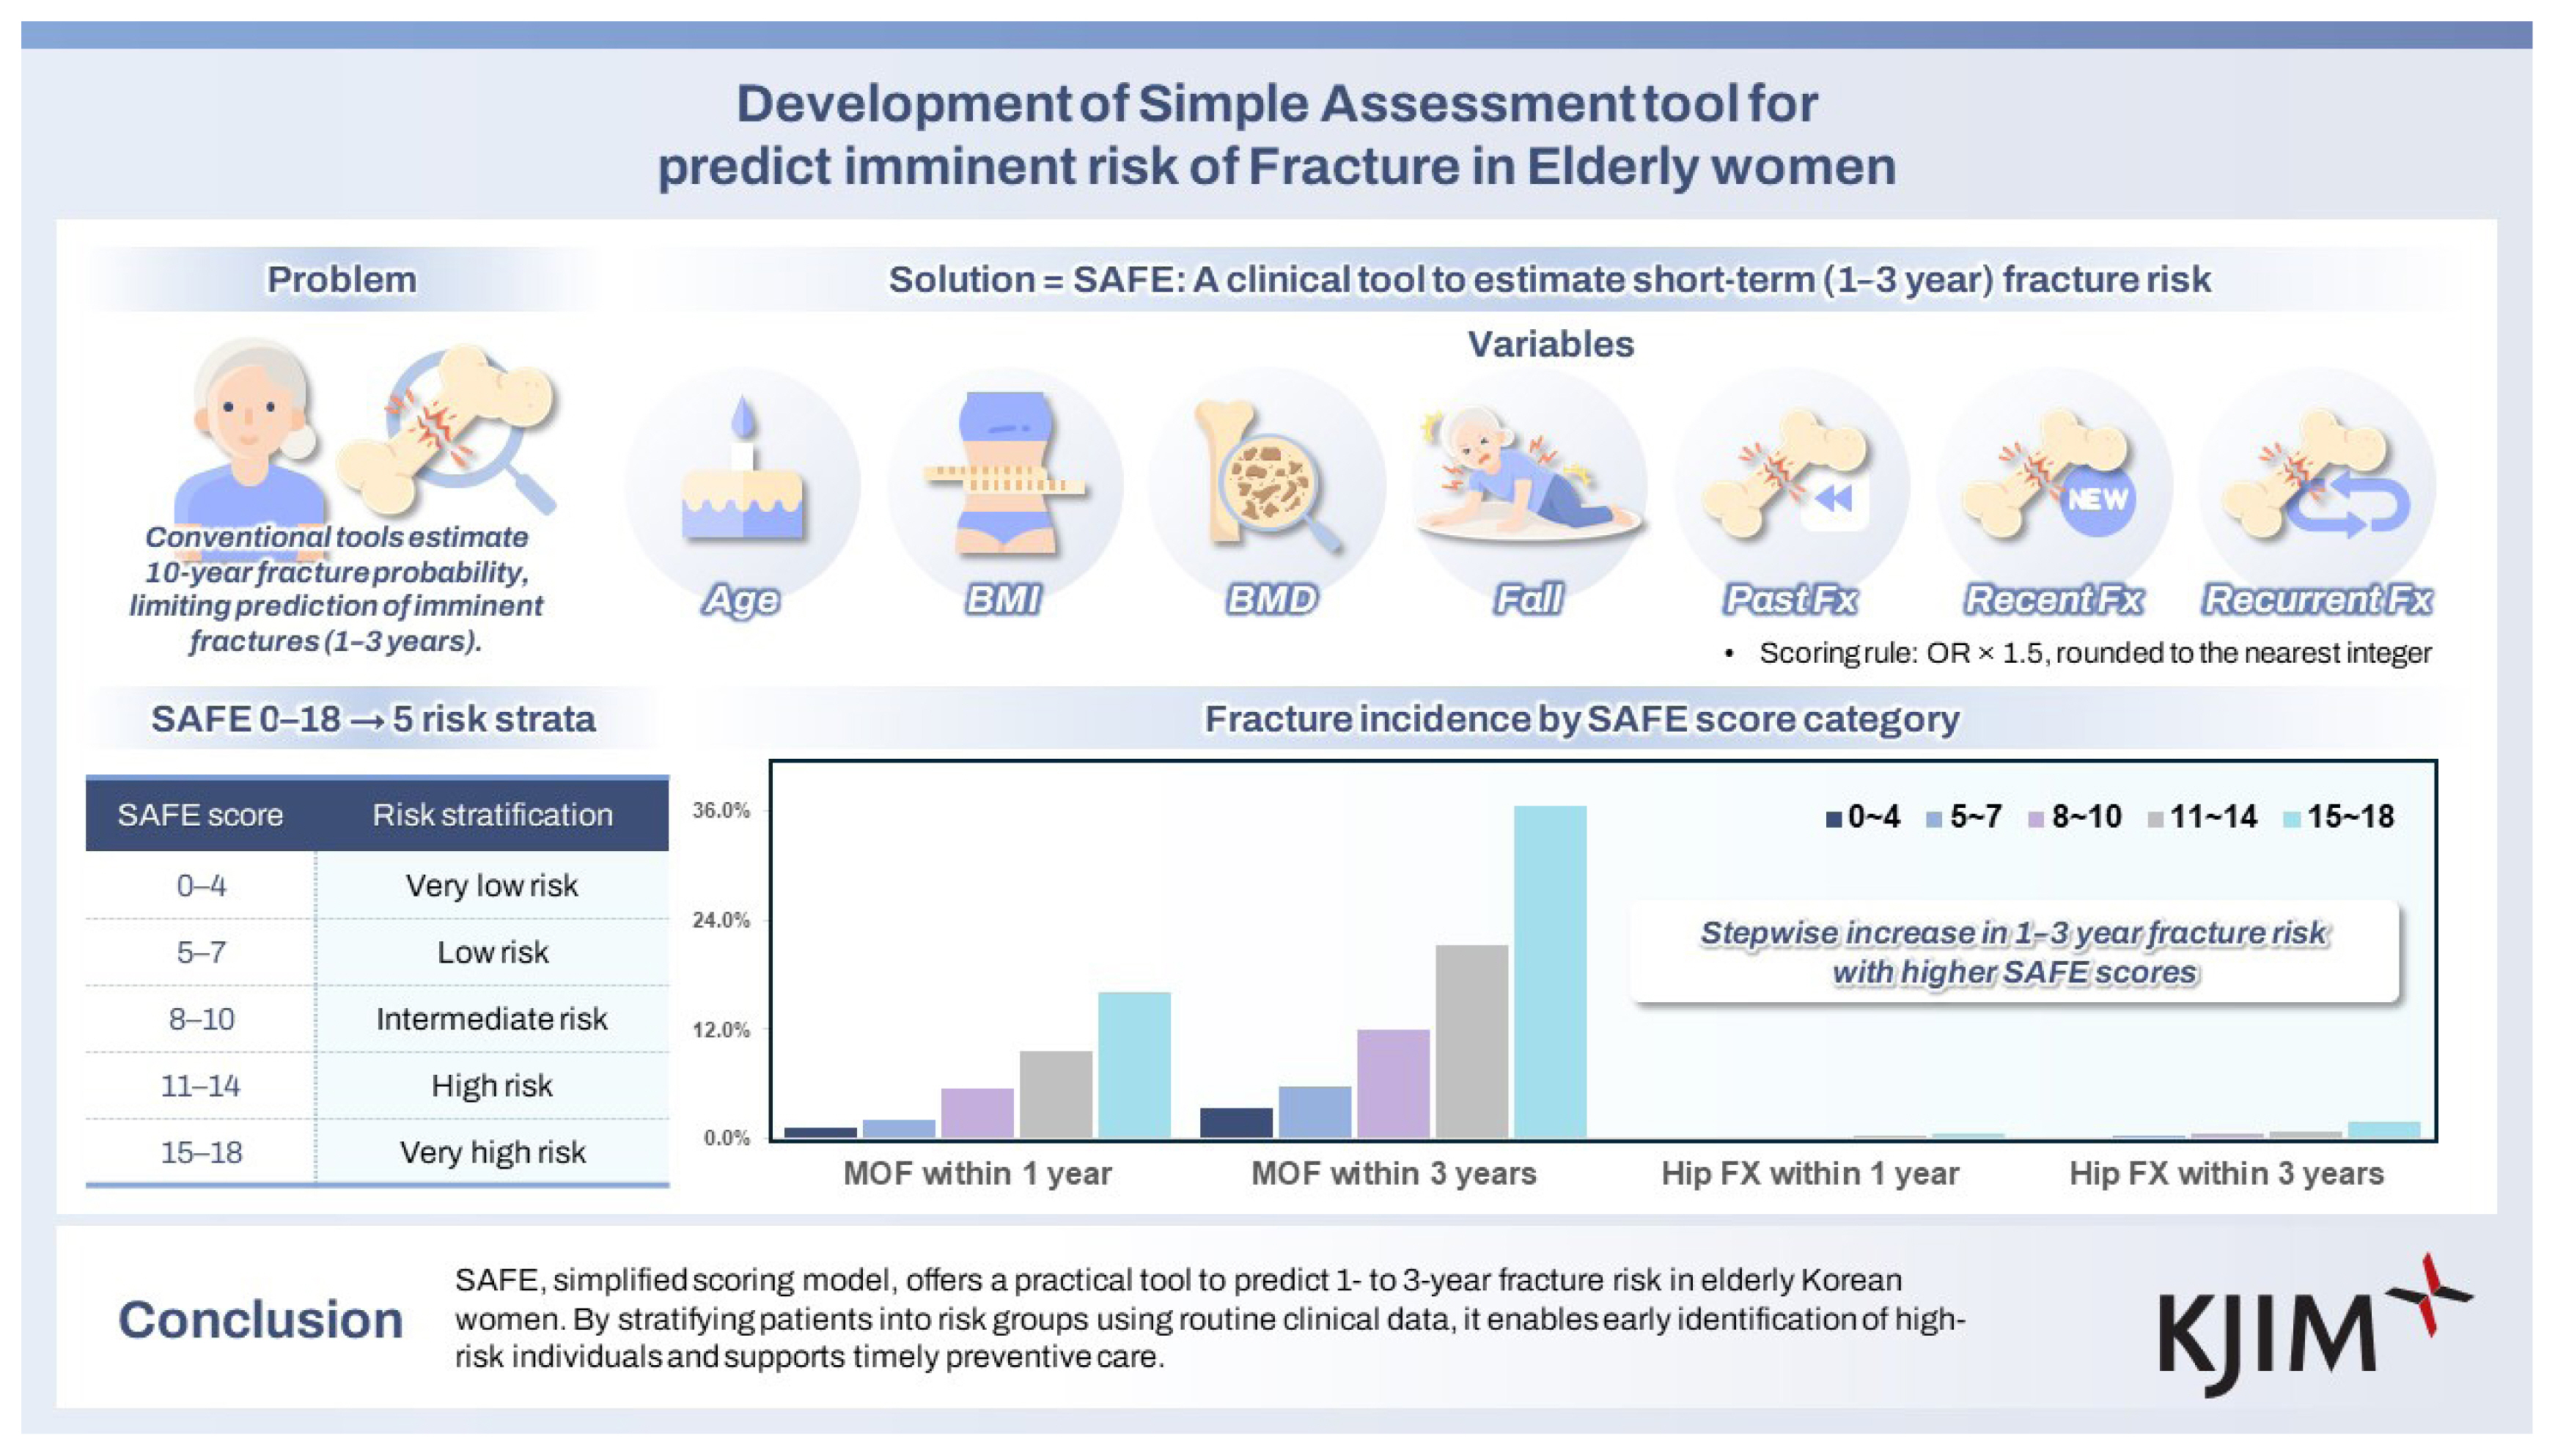
Baseline characteristics are expressed as the mean ┬▒ standard deviation for continuous variables and as number (%) for categorical variables. The rates of primary and secondary outcomes were calculated as percentages. To develop a simple assessment tool, logistic regression analyses were first performed for MOF at 3 years using covariates of age group, BMI group, BMD value at 66 years of age and history of falls, past fractures, recent fractures, and recurrent fractures. To calculate the score for each covariate, the odds ratio (OR) of each risk factor was multiplied by 1.5 and scored by rounding up. The MOF risk was predicted by summing the scores for each risk factor. This fracture risk assessment tool was named Simple Assessment tool for predict imminent risk of Fracture in Elderly women (SAFE). According to the summed SAFE scores, the patients were divided into five groups (0ŌĆō4, 5ŌĆō7, 8ŌĆō10, 11ŌĆō14, and 15ŌĆō18 points), with a higher score indicating a higher risk of fracture. After developing the SAFE score for MOF, we applied the SAFE score to other secondary outcomes to validate whether it would also be suitable for those. The incidence of fractures was analyzed according to the SAFE score. Statistical analyses were performed using SAS version 9.4 (SAS Institute Inc., Cary, NC, USA), and a p value < 0.05 was considered statistically significant.
RESULTS
Baseline characteristics of study participants
The baseline characteristics of the participants are summarized in Table 1. The mean age was 67.4 years, and 82.8% of the participants were between 65 and < 70 years of age. The mean BMI was 24.5 kg/m2. Most patients (77.9%) had a BMI of Ōēź 20 and < 27.5 kg/m2. The normal BMD group included 290,098 (20.1%), the osteopenia group included 632,129 (43.9%), and the osteoporosis group included 546,223 (37.9%) participants. A history of falls within the last 6 months was reported in 8.6% of the analyzed cohort, with a history of past fractures in 4.0%, recent fractures in 1.7%, and recurrent fractures in 0.4%.
The association between clinical risk factors and MOF within 3 years
Table 2 presents the association between clinical risk factors and MOF within 3 years. The risk of MOF increased with old age, underweight and obesity, osteoporosis, history of falls, and history of previous and recurrent fractures: The OR for MOF within 3 years was 1.31 (95% confidence interval [CI] 1.29ŌĆō1.34) in those aged 70 years compared with those aged Ōēź 65 years and < 70 years. The ORs for MOF within 3 years were 1.04 (95% CI 1.01ŌĆō1.08) for BMI < 20 kg/m2, 0.98 (95% CI 0.69ŌĆō1.00) for BMI Ōēź 20 and < 23 kg/m2, 1.05 (95% CI 1.03ŌĆō1.07) for BMI Ōēź 25 and < 27.5 kg/m2, and 1.11 (95% CI 1.09ŌĆō1.14) for BMI Ōēź 27.5 kg/m2 compared with BMI Ōēź 23 and < 25 kg/m2. The ORs for MOF within 3 years were 1.5 (95% CI 1.47ŌĆō1.54) for osteopenia and 2.19 (95% CI 2.14ŌĆō2.25) for osteoporosis compared with normal BMD. A history of falls increased the risk of MOF within 3 years by 1.29-fold (95% CI 1.25ŌĆō1.32). The ORs for the occurrence of MOF for past, recent, and recurrent fractures were 2.28 (95% CI 2.19ŌĆō2.36), 1.64 (95% CI 1.56ŌĆō1.72), and 2.51 (95% CI 2.35ŌĆō2.69), respectively.
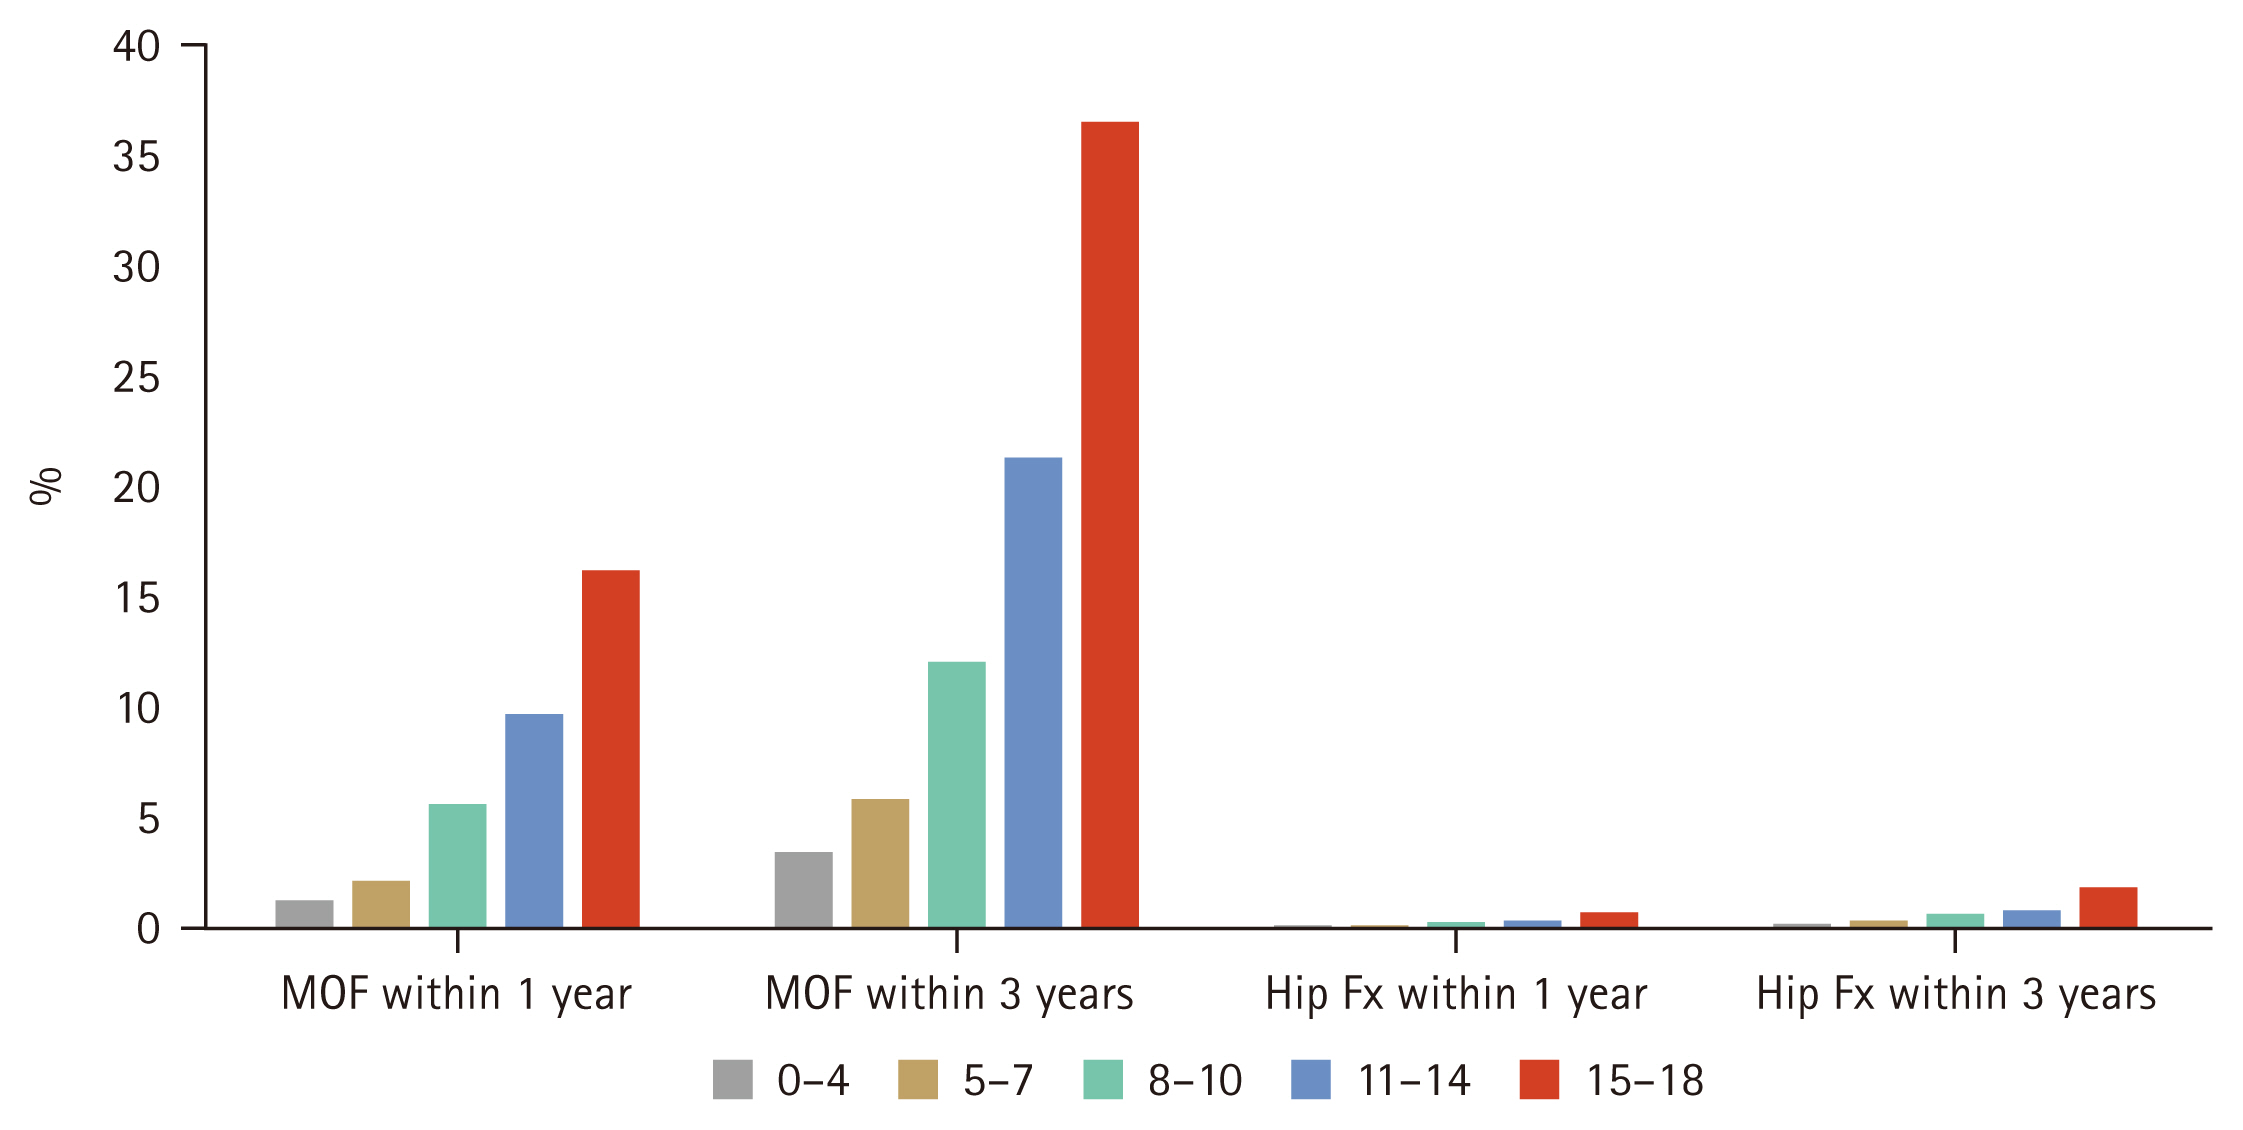
SAFE score and risk of fractures in 1 or 3 years
The SAFE score ranges from 0 to 18 points, according to the risk factors. The presence of all the risk factors results in a score of 18 points (Table 3). The incidence of fractures was analyzed according to the SAFE score (Supplementary Table 1). The higher the score, the higher the fracture incidence for both MOF and hip fractures. Fracture incidence according to the SAFE score is shown in Figure 3. There were clear increasing trends in fracture incidence with higher SAFE scores. The incidences of MOF within 3 years were 3.4%, 5.8%, 12.0%, 21.3%, and 36.6% in participants with scores of 0ŌĆō4, 5ŌĆō7, 8ŌĆō10, 11ŌĆō14, and 15ŌĆō18 points, respectively. The SAFE score was also suitable for hip fractures at 3 years; the incidences of hip fractures within 3 years were 0.13%, 0.26%, 0.59%, 0.73%, and 1.82% in those with scores of 0ŌĆō4, 5ŌĆō7, 8ŌĆō10, 11ŌĆō14, and 15ŌĆō18 points, respectively. The SAFE score predicted the imminent risk of fracture within 1 year, and the incidence of MOF within 1 year was 1.2%, 2.1%, 5.6%, 9.7%, and 16.2% in those with scores of 0ŌĆō4, 5ŌĆō7, 8ŌĆō10, 11ŌĆō14, and 15ŌĆō18 points, respectively. The incidences of hip fractures within 1 year were 0.04%, 0.10%, 0.24%, 0.25%, and 0.68% in participants with scores of 0ŌĆō4, 5ŌĆō7, 8ŌĆō10, 11ŌĆō14, and 15ŌĆō18 points, respectively.
DISCUSSION
We developed a new and simple fracture risk prediction model, SAFE, to predict the imminent risk of fractures in elderly Korean women using a nationwide retrospective cohort of Korean women over the age of 66 years. SAFE was developed using seven clinical risk factors that are well-known simple covariates for osteoporosis and fracture, including age, BMI, BMD, history of falls within 6 months, history of past fractures within 3 years, recent fractures within 1 year, and recurrent fractures. The SAFE score can predict the imminent fracture risk, within 1 or 3 years, for both MOF and hip fractures.
Previous fracture prediction models, including FRAX, QFracture, and Garvan Fracture Risk Calculator, included many risk factors, and specific tools were required to use them. Previous studies using these models evaluated 10-year and 5-year fracture probabilities. Therefore, it was difficult to calculate fracture risk easily and quickly in actual clinical practice and to predict the imminent fracture risk.
In contrast, SAFE can easily, quickly, and intuitively calculate fracture risk by including only the major clinical risk factors related to fractures and osteoporosis. In addition, unlike previous fracture prediction models, SAFE can improve the accuracy of fracture prediction because it includes the history of falls, recurrent fractures, and recent fracture history within 12 months. Moreover, in the elderly, predicting imminent fracture risk may be more important than predicting 10-year fracture risk; thus, SAFEŌĆÖs 1-year and 3-year imminent fracture risk prediction is a significant strength.
When developing SAFE, we attempted to make it as simple as possible, with the fewest clinical risk factors. Among the various clinical risk factors, only the critical factors that strongly influence fracture incidence were selected. Bone loss increases with age and, in combination with intrinsic and extrinsic factors, accelerates the decline in bone quantity and quality, leading to osteoporosis and fracture [12]. Low BMI or body weight is associated with low BMD and is therefore a risk factor for osteoporotic fractures [13,14]. Even the simplest fracture risk assessment tool, the Osteoporosis Self -assessment Tool (OST), includes age and weight [15]. Because low BMD is a well-known and strong predictor of osteoporotic fracture risk [3], fracture risk prediction models that do not include BMD have limited prediction accuracy. A previous study compared the predictive rates of FRAX with and without BMD [16]. The 10-year probability of hip fracture calculated using FRAX scores with and without BMD was concordant in 83.8% of the patients; however, BMD data may be required for younger age, higher BMI, and lower BMD to facilitate accurate risk assessment [16]. Previous studies have suggested that falls are independent risk factors of fractures [17,18]. In our study, falls increased the risk of fractures by 29.0%. This was similar to the OR in the elderly (1.31, 95% CI 1.29ŌĆō1.34). Unlike QFracture and the Garvan Fracture Risk Calculator, FRAX does not include fall history. Considering the strong association between falls and fractures, Kanis et al. [19] proposed adjusting the conventional FRAX to estimate the fracture probability according to the number of falls in the preceding year. In their study, the 10-year fracture probability progressively increased as the number of reported falls increased [19]. Thus, for the probability of MOF, the FRAX value was multiplied by 1.2, 1.3, and 1.7 for a history of one, two, and three or more reported falls, respectively. For the probability of hip fracture, the FRAX value was multiplied by 1.2, 1.5, and 2.0 for a history of one, two, and three or more reported falls, respectively [19]. In SAFE, only fall history within 6 months was included, and the number of falls was not considered. However, because fall-related risk factors depend on a patientŌĆÖs memory, the exact number of falls may not be accurate. Even if only a history of a fall is identified, it is possible to calculate the fracture risk quickly and efficiently in clinical practice. Prior fractures increase the risk of subsequent fractures [20]. In a meta-analysis, a previous history of fracture conferred an increased risk of fracture of substantial importance beyond that explained by BMD [21]. The risk of subsequent fractures is higher during the first year after the initial fracture [22]. Thus, recently published guidelines for postmenopausal osteoporosis management defined the very high fracture risk group as those with recent fractures, multiple fractures, very low BMD, or several other clinical factors [23,24]. More active and rapid osteoporosis treatment is recommended in the very-high-risk group. In our study, the ORs for past fracture history (OR 2.28, 95% CI 2.19ŌĆō2.36) and recurrent fractures (OR 2.51, 95% CI 2.35ŌĆō 2.69) were higher than that for osteoporosis (OR 2.19, 95% CI 2.14ŌĆō2.25). Considering the importance of recent fractures, the scores for recent fractures within 12 months were added to the SAFE score.
Most fracture prediction models have been developed and validated in United States, the United Kingdom, and China; however, models for the Korean population are insufficient. The Korean Fracture Risk Score (KFRS), which was previously developed and validated for the Korean population, did not include BMD; therefore, the SAFE score supplemented the KFRS. Kong et al. [25] developed a novel fracture prediction model using CatBoost, a machine-learning method in a prospective Korean community-based cohort. The Cat-Boost model predicted total and hip fractures better than the FRAX model. However, the CatBoost model may not be easy to apply in a real-world setting because it includes the top 20 predictive factors.
This study has some limitations. First, the SAFE is difficult to generalize because men and women under the age of 66 were excluded. Second, the SAFE score was not validated. Follow-up studies are underway to validate the clinical usefulness of SAFE scores in different populations and ethnicities. Additionally, a comparative study with other fracture risk prediction models is required to evaluate the fracture prediction accuracy of the SAFE score. Third, fractures may have been underestimated because the definition of fractures used ICD-10 codes and the fractures were not confirmed radiologically. Finally, owing to data limitations, our study was restricted to the history of previous fractures and recurrent fractures within 3 years. However, if more large-scale prospective studies are conducted in the future and the definition of past fracture history and repeated fractures could be included more broadly, it may be more convenient for real-world use.
In conclusion, we developed a novel, simple fracture risk prediction model, SAFE, to better predict the imminent fracture risk in elderly Korean women using age, BMI, BMD, history of falls within 6 months, history of past fractures within 3 years, recent fractures within 1 year, and recurrent fractures. The SAFE score can predict the imminent risk of fractures that may occur within 1 or 3 years. The SAFE score may help identify patients at higher risk of imminent fractures with the need for immediate therapeutic intervention.
KEY MESSAGE
1. We developed a simple and practical tool, SAFE to predict 1-to 3-year fracture risk in elderly Korean women.
2. SAFE includes clinical risk factors such as age, BMI, BMD, history of falls within 6 months, past fractures within 3 years, recent fractures within 1 year, and recurrent fractures.
3. SAFE demonstrates a strong dose-response relationship with future fracture incidence and may support early identification and timely intervention for high-risk individuals.

 PDF Links
 PubReader
 ePub Link
 Full text via DOI
 Download Citation
 Supplement figure 1
 Print
Print


