


INTRODUCTION
The number of patients undergoing maintenance dialysis is increasing in Korea [1]. Volume status is an important prognostic factor of these patients. Overhydration (OH) in patients undergoing dialysis is associated with the development of congestive heart failure and a higher frequency of mortality [2-4]. In contrast, dialysis-induced volume depletion and hypotension are common complications in patients undergoing hemodialysis (HD) and are independent risk factors for mortality [5,6]. Accurate assessment of volume status is required to manage volume, but this is a difficult task in patients undergoing dialysis. Clinical indices, such as blood pressure (BP), pulse rate, and edema, do not accurately reflect volume status. Some volume can remain in the body, and clinical edema may not be evident. Dry weight is defined as the weight at which a patient undergoing dialysis has neither edema nor hypertension without taking a BP-lowering medication, or the lowest weight that can be tolerated without developing symptoms of hypovolemia [7,8]. However, determining dry weight is a challenge for nephrologists because of the above-mentioned problems. Methods for determining dry weight have been suggested, including by reference to biochemical parameters, such as atrial or brain natriuretic peptide levels [9], inferior vena cava diameter on ultrasonography [10], and blood volume monitoring [11]. However, dry weight estimates obtained using these methods are not accurate. Dilution methods, regarded as reference methods for measuring body fluid volumes, are as follows: deuterium for total body water (TBW) [12], bromide for extracellular water (ECW) [13], and radioactive potassium isotope (40K) for intracellular water (ICW) [14]. Although these methods can be accurate, they are invasive, as they require blood samples, and are expensive due to the cost of the isotope and performance of mass spectrometry. Furthermore, they cannot be repeated at short intervals due to the retention of residual tracer, and they cannot be used to measure volume variations over a short period. Thus, bioimpedance analysis (BIA) is largely used instead, being a simple, noninvasive, and inexpensive method [15]. TBW, ICW, and ECW can be measured using BIA [16]. This method is precise and provides accurate estimates of TBW and ECW [17].
PRINCIPLES OF BIOELECTRICAL IMPEDANCE
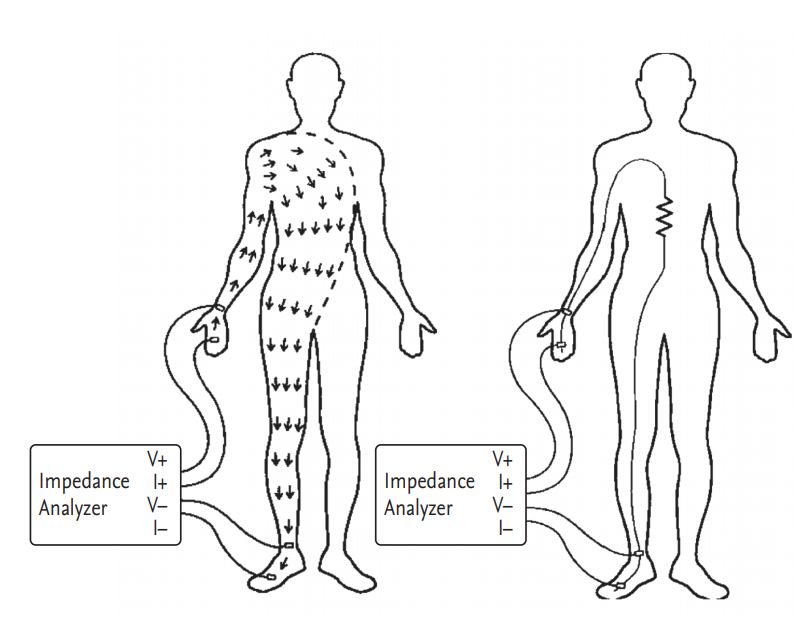
BIA is based on the electrical properties of biological tissues [18]. When sending a weak alternating electric current into the body, electricity flows along highly conductive body tissues [19]. Current flows by two mechanisms: directly through the fluid and indirectly across cell membranes [20]. Low frequency current does not pass through cells; instead, current flows through the extracellular fluid [21]. However, the cell membrane capacitor charges and discharges the current at a high frequency. Thus, current flows through the cell membrane and tissue fluid (Fig. 1). The volume of water determines the width of the passage through which electricity flows, which is represented by impedance. Impedance (Z) is a force that interferes with the flow of electric current and is determined using the vector sum of the electrical resistance (R) and reactance (Xc). The component of impedance corresponding to flow through fluid is the resistance, and the component corresponding to flow across cell membranes is the reactance [22]. However, in the human body, the difference between the impedance and resistance values is only about 2 to 3 Ω so the two words are often used interchangeably. The R of the length of the conductive material is proportional to its length and inversely proportional to its cross-sectional area [15].
Length (L) of the conductor is the length of the body, often replaced by the height. Resistivity (ρ) is the resistance value per unit volume of body water. It is assumed that the resistivity value is constant because a highly constant amount of electrolyte is dissolved per unit volume in body water.
To measure impedance of the body, electrodes are attached to the right wrist, back of the hand, right ankle, and foot, as shown in Fig. 2, and connected to the impedance meter. The impedance meter supplies a current of 50 kHz and 800 μA between the electrodes of the back of the hand and the foot. Current flows through the right arm, torso, and right leg, where the impedance meter measures the voltage between the wrist and the ankle.
With the given current value and the measured voltage, the electric resistance value is obtained using Ohm’s law.
After the height is measured, body water can be obtained by substituting the obtained resistance value of the body into (4).
SINGLE-FREQUENCY BIA
BIA information obtained at an electric current of 50 KHz is known as single-frequency BIA (SF-BIA). SF-BIA is the earliest and most frequently used methods to estimate the volume of body compartments [23]. SF-BIA predicts the volume of the TBW. However, strictly speaking, it does not measure TBW volume but rather the weighted sum of the ECW and ICW resistivities [15]. SF-BIA permits assessment of TBW and fat-free mass (FFM) for normal hydrated persons but is not appropriate under conditions of significantly altered hydration [24].
MULTIPLE-FREQUENCY BIA
Multiple-frequency BIA (MF-BIA) is a technology that precisely measures body water content, by measuring body water separately from ICW and ECW. Human impedance measured using high-frequency electrical signals reflects ICW and ECW, while low-frequency signals reflect only ECW. MF-BIA measures the distribution of water inside and outside the cell, by changing the frequency to in turn change the flow path of electricity. MF-BIA uses different frequencies (5 to 1,000 kHz) to evaluate FFM, TBW, ICW, and ECW. Hannan et al. [25] reported that TBW volume is more accurately estimated using MF-BIA than using the bioimpedance spectroscopy (BIS) method, which estimates ECW volume with equal accuracy. Patel et al. [26] reported that MFBIA was more accurate than SF-BIA for predicting ECW, whereas SF-BIA was more accurate for predicting TBW than MF-BIA in diseased subjects. MF-BIA shows less sensitivity in detecting fluid shifts between the ECW and the ICW in elderly patients [27].
BIOIMPEDANCE SPECTROSCOPY
BIS analyzes bioimpedance data obtained using a broadband of frequencies. The BIS method is based on determining resistance at zero and infinite frequencies, which are then used to predict ECW and TBW, respectively [23].
WHOLE-BODY BIA
Whole-body BIA regards the body as a cylinder having a certain length and cross-sectional area [18]. Its limitation is that it assumes that a body with arms, a trunk, and legs constitutes a single cylinder having uniform conductivity for any given cross-sectional area. The resistance to volume ratio differs between the trunk and the limbs. Limbs contribute > 90% of whole-body resistance despite having only 30% of the total volume, whereas the trunk, with a large cross-sectional area, contributes as little as 10% of whole-body resistance with 70% of the volume [28].
SEGMENTAL BIA
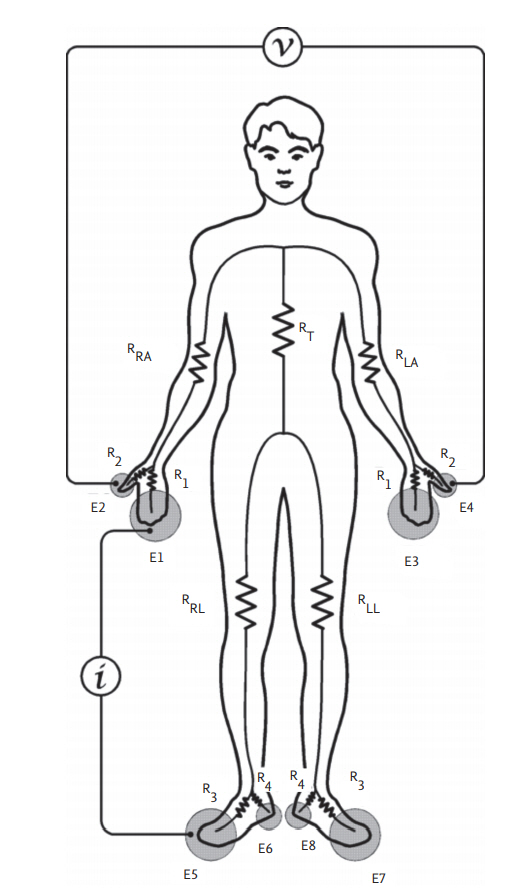
Segmental BIA has been developed to overcome the limitations of whole-body BIA. It regards the body as comprising five cylinders: two for the arms, two for the legs, and one for the trunk [18]. The device used to measure segmental BIA herein has up to eight electrodes (InBody, Seoul, Korea); two electrodes are in contact with the palm (E1, E3) and thumb (E2, E4) of each hand; and two are in contact with the anterior (E5, E7) and posterior aspects (E6, E8) of the sole of each foot (Fig. 3) [29]. The electrical resistance values of the right arm, left arm, trunk, right leg, and left leg are indicated by RRA, RLA, RT, RRL, and RLL, respectively. An alternating current of intensity (I) is applied between E1 and E5. The voltage difference (V) between E2 and E4 is divided by I to obtain the resistance of the right arm. The current flows through R1-RRA-RT-R3, and the voltage is measured in a loop formed by R2-RRA-RLA-R2. The loop in which the current flows and the voltage measured overlap in RRA to measure resistance of the right arm [19]. Segmental BIA has been used to determine fluid shifts and distributions in certain conditions, such as ascites and kidney disease, as well as during surgery [15].
ASSESSMENT OF FLUID OVERLOAD WITH BIA
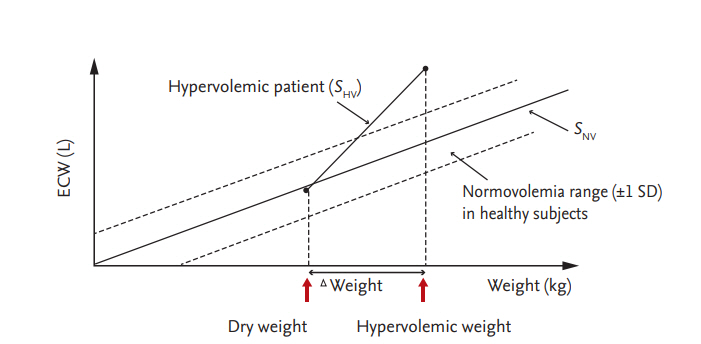
The normovolemic status of a subject can be estimated according to measurements of height, weight, and the body composition, as assessed by BIA. Fluid overload is calculated by subtracting the fluid volume according to the normovolemic status from that measured by BIA [30,31]. Several methods can be used to estimate fluid overload by BIA. Chamney et al. [30] used whole-body BIA to differentiate hypervolemia from normovolemia. A 70-kg healthy person has an ECW volume of 14 to 16 L [32]. They assumed that a linear relationship exists between ECW and body weight. The slope of this relationship has been denoted by the slope of normovolemia (SNV) (Fig. 4). SNV represents the average ECW volume for a given weight. All ingested fluid accumulates in the body and body weight increases in a patient undergoing dialysis. A second slope, the hypervolemic slope (SHV), also develops under this hypervolemic condition.
Deducing the hydration status of a patient from the absolute body fluid volume alone is not appropriate because absolute water volume varies with height, weight, and body composition [33]. As an alternative, fluid compartment ratios, as indicators of hydration status, have been used including the ratio of ECW to TBW [34,35]. This ratio is easy to use, intuitive, and well validated as a predictor of survival [36]. However, the standard deviation of this ratio is so large that its use is impracticable [33]. Ratios that have been used by other researchers include ECW to body weight [37,38], ECW to body height [38,39], and ECW to body surface area [40].
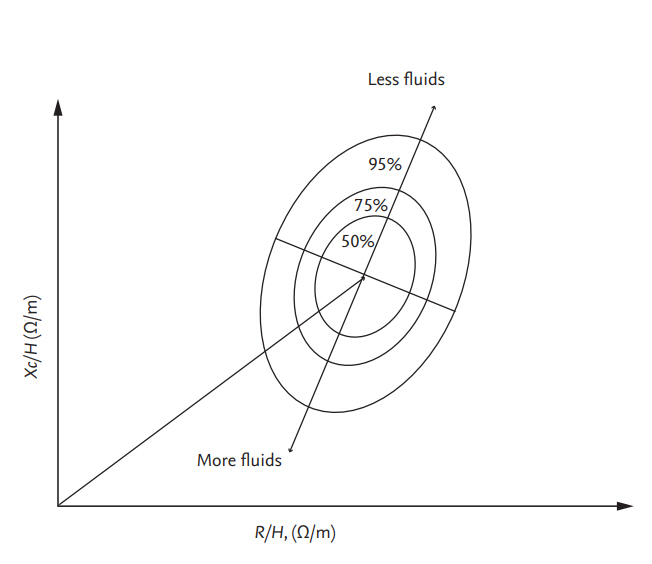
The resistance-reactance (RXc) graph method uses a direct impedance vector measurement (given by R and Xc) at 50 kHz with whole-body SF-BIA [41]. R and Xc are plotted against each other and normalized by height. The R/H and Xc/H (Ω/m) ratios of a given patient are plotted on the RXc plane (Fig. 5). The vector length represents the size of the impedance. Clinical information on hydration is obtained by determining the location of the vector point for a normally hydrated healthy individual of the same sex, age, and race [42]. Vectors within the 75% tolerance ellipse indicate normal hydration status.
A body composition monitor (BCM, Fresenius Medical Care, Bad Homburg, Germany) is used to measure OH. It uses two physiological models: in the volume model, the ECW and ICW are calculated using the resistance values measured with the BCM and Hanai model [31]; while in the body composition model, TBW is divided into three parts, i.e., OH, lean tissue, and adipose tissue (Fig. 6) [43,44]. Absolute fluid overload (AFO; equivalent to OH) is defined as the difference between the expected ECW under normal physiological conditions and the actual ECW, while relative fluid overload (RFO) is the AFO as a proportion of ECW (AFO/ECW) [45]. All calculations are performed automatically using BCM software. Normohydration is defined when the AFO is in the 10th to 90th percentile range; that is, –1.1 to 1.1 L relative to healthy age- and sex-matched individuals from the reference group. Volumes below and above this range are defined as underhydration and OH, respectively.
DRY WEIGHT ASSESSMENT BY BIA
The normovolemia/hypervolemia slope method predicts dry weight from the BIS measurement and body weight (Fig. 4) [18,30]. All fluid is assumed to accumulate in the ECW. If the weight of a hypervolemic patient is reduced and SHV intersects with SNV, the weight at which intersection occurs is the dry weight. In a study by Chamney et al. [30], the dialyzed weight of each patient typically decreased between 0.5 and 2 kg over subsequent dialyses and most patients achieve normovolemia in 2 to 6 weeks. A considerable improvement in BP control was achieved in that study, based on the mean arterial pressure, and there was an 86% reduction in the use of antihypertensive medication.
Chen et al. [46] used ECW% (ECW as a percentage of weight) to determine the dry weight. ECW was measured by whole-body BIA. An ECW% > 25% in female patients and > 28% in male patients was considered excessive according to the 100th percentile of healthy subjects. The ECW% of patients with a high BP was significantly higher than that of patients with a normal BP (24.29% ± 3.56% vs. 21.50% ± 2.38%). All patients with an excessive ECW% had high BPs, but not all patients with high BPs had an excessive ECW%. No patient with a normal BP had an excessive ECW%. Dry weight decreased in patients with a high BP and excessive ECW%. ECW% and BP decreased significantly after reducing dry weight. Dry weight increased in the symptomatic normotensive patients and symptoms improved in most of these patients (75%).
The vector length in the RXc graph is regarded as a proxy for volume status and increases with ultrafiltration. Shorter predialysis bioimpedance vectors, indicating OH, are associated with an increased mortality risk in patients undergoing HD [47]. Vectors situated within the 75% tolerance ellipse after ultrafiltration are assumed to indicate normal hydration in patients undergoing HD. However, vectors at the start and end of HD remain within the 75% tolerance ellipse in a relatively large proportion of patients [48].
Onofriescu et al. [45] used BCM to determine dry weight. They compared a bioimpedance group (volume controlled based on repeated BCM measurement in a 3-month period) with a clinical group over 2.5 years. RFO decreased significantly, from 9.52% to 7.46%, in the bioimpedance group, whereas RFO did not decrease (10.30% to 11.24%) in the clinical group. Systolic BP decreased significantly, from 145.4 to 138.9 mmHg, in the bioimpedance group, whereas systolic BP decreased from 144.6 to 140.5 mmHg in the clinical group; the decrease was not significant. In another study, these authors also reported that the cutoff RFO of 17.4% was associated with an increased risk of all-cause mortality in patients undergoing HD [49].
Machek et al. [50] conducted a study to determine the normohydration status of patients undergoing HD using BCM. The patients were categorized according to baseline hydration status, as follows: hyperhydrated group (RFO > 15%); adverse event group (patients with more than two adverse events in the last 4 weeks); and all other patients. They targeted an RFO value of between –6% and 6% postdialysis. Fluid overload was reduced by 2.0 L in the hyperhydrated group without increasing the number of intradialytic adverse events. Systolic BP was reduced by 25 mmHg, and a 35% reduction in antihypertensive medication use was achieved. Volume status was increased by 1.3 L in the adverse event group, and a 73% reduction in intradialytic adverse events was achieved without a significant increase in BP.
Moissl et al. [51] introduced the concept of weekly time-averaged fluid overload (TAFO), defined as the average of three predialysis fluid overload (FOpre) and postdialysis fluid overload (FOpost) values in a week, as follows: average weekly TAFO = (FOpre1 + FOpre2 + FOpre3 + FOpost1 + FOpost2 + FOpost3) / 6.
They used a target TAFO of 0.5 L, according to the median value of more than 17,000 patients. They measured BCM on 3 days per week on which dialysis was performed. At the end of each week, the postdialysis target weights for the next week were calculated according to the following criteria:
(1) TAFO > 2.8 L: decrease postdialysis weight by 1 kg/week
(2) TAFO between 1.25 and 2.8 L: decrease postdialysis weight by 0.5 kg/week
(3) TAFO between –0.25 and 1.25 L (on target): maintain current dry weight
(4) TAFO < –0.25 L: increase postdialysis weight by 0.5 kg/week
The TAFO of all patients decreased from 0.9 ± 1.6 to 0.6 ± 1.1 L. TAFO decreased by –1.20 ± 1.32 L in the fluid overload group (baseline TAFO > 1.25 L above the target) and was unchanged in the normovolemic group (baseline TAFO between –0.25 and 1.25), but increased by 0.59 ± 0.76 L in the underhydrated group (baseline TAFO < –0.25 L). Every 1-L change in fluid overload was accompanied by a 9.9-mmHg/L change in the predialysis systolic BP. The number of intradialytic adverse events did not change significantly in any of the groups.
The calf-BIS method has been proposed as a method of measuring dry body weight. This is useful because the calf-ECW reflects whole-body ECW [52]. Calf-BIS is continuously measured during HD to identify the section wherein the R0/Rt curve becomes flat (R0 is the calf extracellular resistance at the HD start time, and Rt is the calf extracellular resistance at a specific time point) (Fig. 7). In this section, all excess ECW fluid was removed, and the weight was considered dry weight.
BIA IN PATIENTS UNDERGOING PERITONEAL DIALYSIS
Many patients undergoing peritoneal dialysis (PD) are in a state of OH [37,53]. In patients undergoing PD, who lack the signs of dehydration observed in patients undergoing HD (such as hypotension or cramps during dialysis), it is more difficult to determine dry weight than in patients undergoing HD [33]. BIA is also a noninvasive, inexpensive, and simple way to measure body fluid in patients undergoing PD.
Lindley et al. [35] used BIS to estimate volume status in 31 patients undergoing PD and 199 healthy subjects. The ECW/TBW ratio of the patients undergoing PD was compared with that of healthy control subjects. The hydration score (difference between the measured ECW/TBW ratio and the mean ratio for age- and sexmatched controls divided by the standard deviation of the controls) was calculated. The mean hydration score was significantly higher (1.3 vs. 0.0) in the patients undergoing PD than in the control subjects. In total, 35% of the patients undergoing PD, and only 2.5% of the controls, had a hydration score > 2.0. After a 3-month follow-up, a weight reduction of 3.6 ± 2.3 kg had been achieved in seven patients through modality or prescription changes, with no adverse effects.
van de Kerkhof et al. [38] used MF-BIA to validate the predictive value of various ratios for diagnosing hypervolemia in patients undergoing dialysis. They divided the patients into the following groups: clinically normovolemic (mean 24- or 48-hour systolic BP < 133 mmHg without antihypertensive agents), hypervolemic (mean systolic BP > 133 mmHg with use of two or more antihypertensive agents), or undetermined. The 80th percentile for normalized ECW in the clinically normovolemic patients was used as the reference value. The ECW/body height ratio had a higher sensitivity than the ECW/body weight ratio or ECW/TBW ratio for detecting hypervolemia in patients undergoing dialysis.
O’Lone et al. [54] showed that the OH/ECW ratio was an independent predictor of mortality in 529 patients undergoing PD, but the ECW/TBW ratio was not associated with increased mortality. Yoon et al. [55] reported that OH was associated with lower health-related quality of life in 481 patients undergoing PD.
A recent study suggested that the ratio of bioimpedance (RBI) might be a helpful parameter to adjust dry weight in patients undergoing PD [56]. RBI was calculated as follows: RBI = impedance at 50 kHz / impedance at 500 kHz. RBI was measured from the right wrist to the right ankle by BCM. The patients were divided into hypervolemic and non-hypervolemic groups. The mean RBI of the non-hypervolemic patients was higher than that of the hypervolemic patients. They concluded that RBI could serve as a new index for estimating the volume status of patients undergoing PD.
CONCLUSIONS
Various BIA devices are increasingly being used in clinical practice, such as for estimating dry weight in patients undergoing dialysis. In patients undergoing HD or PD, volume overload commonly occurs, and identifying and reducing volume overload with BIA devices improves the prognosis by decreasing the BP and left ventricular hypertrophy [51,57-60]. In addition, adverse events can be decreased in patients with a depleted volume by detecting their volume status and increasing the dry weight. However, the accuracy of OH measurement is the most important consideration.
The normovolemia/hypervolemia slope method is a useful method for determining dry weight, and reducing the variation in SNV is key to its accuracy. Ratio values, such as ECW%, are intuitive and easy to use, but both values can be abnormal because it is a ratio. The RXc graph has the advantage of yielding a relatively simple dry weight prediction without the need to measure volume status. However, as described earlier, it is sometimes difficult to determine dry weight because the vector can be within the 75% tolerance ellipse at the beginning and end of the dialysis. The calf-BIS method allows continuous monitoring during dialysis and provides relatively accurate data on hydration status, although measuring calf circumference is laborious. BCM methods are currently the most widely used and have been validated in various ways.
In conclusion, BIA is a useful method for controlling volume in patients undergoing dialysis, but more research is needed to establish a standard method.


 PDF Links
 PubReader
 ePub Link
 Full text via DOI
 Download Citation
 Print
Print


