


INTRODUCTION
Fluid and sodium retention is considered as an important pathophysiologic mechanism in heart failure (HF) [1,2]. It leads to cardinal symptoms and signs of HF, such as dyspnea, pulmonary congestion, pitting edema, and elevated jugular venous pressure [3,4]. As volume overload is associated not only with clinical manifestations but also with an increased risk of hospitalization and mortality [5-7], decongestive treatment with diuretics for optimal volume status is essential for HF management [3,4,8,9].
The golden standard method of volume status evaluation is measuring pulmonary capillary wedge pressure and right atrial pressure by cardiac catheterization [10]. Echocardiography and natriuretic peptide level measurement are also used to evaluate the volume status [3,11], and are typically performed early for patients suspected with HF with acute onset [3]. However, their clinical use might be affected by invasiveness, training proficiency of clinician, cost, and accessibility. Bio-impedance analysis (BIA) with a body composition analyzer is a noninvasive method that can be performed at the bedside. The multifrequency analyzer advancement enables accurate analysis of body composition, which includes extracellular water (ECW) and intracellular water (ICW) [12,13]. BIA has recently proven its efficacy in various volume overload conditions, including renal failure, liver cirrhosis, and HF [14-17], and its clinical application possibility has been implicated in patients with dyspnea [15,18]. Only few studies distinguished patients with acute heart failure (AHF) from those without AHF based on BIA [15]. In addition, data that distinguish dyspnea patients based on water distribution upon body segments are scarce.
In this study, the diagnostic implication of body fluid status, assessed by BIA, in AHF among patients who presented with dyspnea in the emergency department was evaluated.
METHODS
Study population
Patients who presented in the emergency department of Seoul National University Hospital with dyspnea as the chief complaint from January 2015 to March 2016 were screened. Transthoracic echocardiography was performed in order to discriminate AHF patients. Patients with coronary artery disease who presented mainly with dyspnea, not chest pain, were included. Those who had HF (ejection fraction [EF] < 50% or EF ≥ 50% with peak velocity of transmitral early diastolic left ventricular filling/early diastolic annular velocity [E/e’] > 15) and who met the Framingham criteria were diagnosed with AHF [19]. After proper evaluation based on a previous study [11], a diagnosis other than AHF was made considering the following: normal chest X-ray; X-ray suspicious for lung cancer, pneumonia, or chronic obstructive lung disease; normal cardiac function confirmed by transthoracic echocardiography; and improved symptoms after nebulization and corticosteroid or antibiotic treatment. BIA and transthoracic echocardiography were performed in the emergency department by different clinicians blinded to the results. The tests were performed with a < 10-minute interval. A written informed consent was obtained from the patients prior to the BIA and transthoracic echocardiography. Fifty patients diagnosed with AHF and 50 patients with other etiologies were enrolled. Additional 50 patients who underwent echocardiography for preoperative cardiac evaluation for elective surgery, baseline cardiac evaluation before chemotherapy, or post-stroke cardiac evaluation were also analyzed as the non-dyspnea group to suggest the control value of BIA. This study was approved by the Institutional Review Board of Seoul National University Hospital (IRB No. 1501-122-647) and conformed to the principles outlined in the Declaration of Helsinki.
Clinical data collection and BIA
The patients’ baseline demographic data, underlying diseases, and laboratory test results were collected from the electronic medical records of Seoul National University Hospital. Medical history included diabetes mellitus, hypertension, chronic kidney disease including end-stage renal disease, liver cirrhosis, and atrial fibrillation. Information on following typical symptoms and signs that could implicate the volume overload status or AHF were also collected: orthopnea, rales, pretibial edema, and pulmonary congestion on chest radiography. Data on leukocyte, hemoglobin, platelet, blood urea nitrogen, creatinine, serum sodium, albumin, and B-type natriuretic peptide (BNP) levels measured at admission were also obtained for this study. Blood sampling and tests were performed as routine practice by laboratories certified by the Korean Association of Quality Assurance for Clinical Laboratory. Echocardiography was performed using commercially available systems. Echocardiographic variables included E (peak velocity of transmitral early diastolic left ventricular [LV] filling), EDT (E-deceleration time), e’ (early diastolic annular velocity), E/e’, LV EF, LV internal diameter in diastole and systole, LV interventricular septum and posterior wall thickness, and LV mass index.
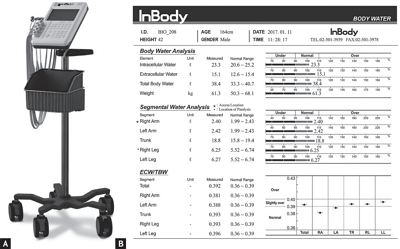
BIA was performed using the portable multifrequency bio-impedance device (InBody S10, InBody Co. Ltd., Seoul, Korea) (Fig. 1A). With the 8-point touch type electrodes prepared according to the manufacturer’s instructions, the analyzer measured the segmental resistance at multiple frequencies (1, 5, 50, 250, 500 kHz, and 1 MHz). Multifrequency BIA have proven their efficacy in predicting the ICW and ECW compartments of total body water (TBW), and the accuracy was comparable to dual-energy X-ray absorptiometry [20-22]. The body served as a cylindrical conductor with a constant cross-sectional area. At low-level frequencies, the cell membrane acted as an insulator and the current flowed predominantly through the ECW; consequently, ECW resistance was recorded. At high-level frequencies, the current could penetrate the cell membrane; thus, ICW and ECW resistance were determined [23]. The device can estimate the body fluid status using the data obtained and previously determined constants [12,24]. Based on the segmental data of the four limbs, the parameters of lower and upper extremities were calculated and used in this study. Measured data were automatically stored in the BIA and could be printed as Fig. 1B.
Statistical analysis
Data were presented as numbers and frequencies for categorical variables, and as mean with standard deviation or median with interquartile ranges for continuous variables. For comparison between groups, the chisquare test (or Fisher exact test when expected cell count was < 5 for a 2 × 2 table) and unpaired Student t test were used for continuous variables and categorical variables, respectively. The ECW/TBW difference from the different segments of the same patient was compared by a paired t test. A receiver operating characteristic (ROC) curve analysis was used to determine the optimal ECW/TBW cut-off value by maximizing the sum of sensitivity and specificity. Category-free net reclassification index and integrated discrimination improvement analyses were performed. ECW/TBW was incorporated to log BNP level to demonstrate the additional predictive value of ECW/TBW in comparison with that of evaluation with log BNP level alone for AHF. A multivariable logistic regression model was used to identify the independent factors associated with AHF diagnosis, and variables associated with AHF that had p values of < 0.05 in the univariate analysis were included as confounding factors in the multivariate analysis. A two-sided p < 0.05 was considered statistically significant. As this analysis was an explorative study, no α adjustment was conducted. Statistical tests were performed using IBM SPSS version 22.0 (IBM Corp., Armonk, NY, USA).
RESULTS
Baseline characteristics of the subjects
Baseline characteristics according to the diagnosis are presented in Table 1. Dyspneic patients diagnosed with AHF had a higher prevalence of diabetes mellitus and atrial fibrillation, higher BNP levels, and larger left atrium diameter, LV internal diameter in diastole, and LV mass index, whereas the EF level was significantly lower than that of patients without AHF. Among the patients without atrial fibrillation, the patients with AHF had a higher E/e’ level (20.6 ± 8.8 vs. 9.7 ± 2.8, p < 0.001) than their counterparts, but this association was not significant among the 14 patients with atrial fibrillation (15.4 ± 5.5 vs. 8.9 ± 0.9, p = 0.140). Patients without AHF had the following diagnoses: unstable angina, pulmonary thromboembolism, pneumonia, anemia with or without hematologic malignancy, liver cirrhosis, malignancy with hypoalbuminemia, etc. A comparison of baseline characteristics with the non-dyspnea group is presented in Supplementary Table 1. Among AHF group, 23 AHF patients had a reduced EF and 27 demonstrated a preserved EF. Patients with reduced EF demonstrated longer LV internal diameter in diastole (59.3 ± 9.5 mm vs. 48.6 ± 7.2 mm, p < 0.001) and higher LV mass index (137.9 ± 46.9 g/m2 vs. 98.6 ± 45.1 g/m2, p = 0.012). Of the patients, 38 did not have atrial fibrillation, and their E (1.0 ± 0.2 m/s vs. 1.0 ± 0.4 m/s, p = 0.923), EDT (154.5 ± 22.1 msec vs. 175.5 ± 63.3 msec, p = 0.228), e’ (5.1 ± 1.8 cm/sec vs. 5.7 ± 2.1 cm/sec, p = 0.337), and E/e’ values (22.2 ± 8.1 vs. 18.8 ± 9.4, p = 0.240) were comparable between the patients with reduced and preserved EF. Among the patients with reduced EF, only the two patients had atrial fibrillation.
Comparison of body fluid status between AHF patients and non-AHF patients
Segmental water distribution analyzed by BIA is presented in Table 2. Weight, TBW, and ICW were similar among groups, but AHF patients had increased ECW compared with non-AHF patients (Fig. 2A). The ECW/TBW ratio was comparable between the non-dyspnea and non-AHF groups, while the ratio was significantly different between the non-dyspnea and AHF groups across the body segments (Supplementary Table 2). The ECW to TBW ratio between AHF patients and non-AHF patients was also significantly different, and this difference was persistently observed when the upper extremities (ECW/TBWU), trunk (ECW/TBWT), and lower extremities (ECW/TBWL) were analyzed separately. ECW/TBWL was higher than ECW/TBWU in both AHF and non-AHF patients (p < 0.001) (Fig. 2B). No significant difference was noted between AHF patients with a reduced EF and those with a preserved EF in ECW/TBW (0.409 ± 0.018 vs. 0.415 ± 0.016, p = 0.166), ECW/TBWU (0.388 ± 0.007 vs. 0.388 ± 0.017, p = 0.959), ECW/TBWT (0.409 ± 0.018 vs. 0.416 ± 0.016, p = 0.124), and ECW/TBWL (0.415 ± 0.021 vs. 0.423 ± 0.018, p = 0.134) (Supplementary Fig. 1). The predictive values of orthopnea, pretibial edema, rale, and pulmonary congestion on chest radiography are presented in Table 3. Among these parameters, pretibial edema showed a sensitivity and specificity of 0.720 and 0.920, respectively. In all the patient groups, significant differences were found for ECW/TBWU (0.391 ± 0.007 vs. 0.380 ± 0.011, p < 0.001), ECW/TBWT (0.417 ± 0.013 vs. 0.390 ± 0.020, p < 0.001), and ECW/TBWL (0.423 ± 0.016 vs. 0.392 ± 0.026, p < 0.001) based on the presence of pretibial edema.
The relationship of ECW/TBWL with AHF in dyspnea patients
ECW/TBWL and log BNP level (r = 0.603, p < 0.001) was significantly correlated. On the contrary, ECW/TBWL was not significantly associated with body mass index (r = –0.145, p = 0.149), systolic and diastolic blood pressure (r = 0.034, p = 0.735 and r = 0.043, p = 0.671, respectively), leukocyte count (r = 0.065, p = 0.518), serum sodium concentration (r = –0.135, p = 0.186), and albumin level (r = –0.107, p = 0.293). ECW/TBWL was significantly associated with E/e’ (r = 0.321, p = 0.003) in the patients without atrial fibrillation, whereas the significance was attenuated in 14 patients with atrial fibrillation (r = 0.035, p = 0.910).
When incorporating ECW/TBWL as continuous variables with log BNP level, it significantly improved the measures of reclassification. For predicting AHF, incorporating ECW/TBWL with log BNP level did not show significant improvement in area under the curve (AUC from 0.918 to 0.958, p = 0.210). However, with ECW/TBWL, net reclassification improvement (total value, 1.139; p < 0.001) showed a more significant increment than when AHF diagnosis was classified with log BNP level. The integrated discriminated improvement of adding ECW/TBWL to the log BNP level also demonstrated a more significant increase (value, 0.131; p = 0.016) than that with evaluation based on log BNP level.
Univariate logistic regression analysis showed that patients with ECW/TBWL > 0.412 demonstrated a significant association with AHF diagnosis (p < 0.001). As presented in Table 4, the relationship between AHF and increased ECW/TBWL was also significant in the multivariate analysis (odds ratio, 56.627; 95% confidence interval, 2.519 to 1,272.838).
Fig. 3 shows that ECW/TBWL had the highest AUC in the ROC curve analysis across the body segments, whereas the difference was not statistically significant between ECW/TBWL and ECW/TBWT (AUC, 0.876 vs. 0.870; p = 0.263) and between ECW/TBWL and ECW/TBWU (AUC, 0.876 vs. 0.826; p = 0.234). The best cut-off value of ECW/TBWL was 0.412 with an AUC, sensitivity, and specificity of 0.876, 0.780, and 0.960, respectively. Using this cutoff value, 41 patients were diagnosed with AHF (Table 3). Two false-positive cases were identified: a buccal cancer patient suffering from atypical pneumonia and hypoalbuminemia and a non-small cell lung cancer patient with deep vein thrombosis. The latter patient had a relatively low ECW/TBWU (0.378), whereas the former had elevated ECW/TBWU level (0.391).
DISCUSSION
In this study, we found that patients presenting with dyspnea and diagnosed with AHF had higher ECW/TBW than non-AHF patients. We also showed the body water distribution difference between AHF and non-AHF patients. In addition, ECW/TBWL was most significantly associated with AHF diagnosis. Lastly, increased ECW/TBWL was independently related to AHF in the multivariate analysis.
Water is the main composite of the human body. Homeostasis of TBW, of which 55% to 65% is distributed in the ICW and 35% to 45% in the ECW [25] is maintained by water and sodium metabolism, but it could be altered in various pathologic conditions, such as congestive HF, characterized by increased ECW volume [26,27]. This pathologic change results in the typical characteristics of HF: increased cardiac filling pressure causes jugular venous distension, pulmonary congestion, dyspnea [28], and ventricular overloads, which trigger the synthesis of BNP [29,30]. In previous studies, cardiac catheterization, echocardiography, and BNP level have proven their clinical value in diagnosing and managing HF by identifying the volume status of the patients [10,11,31-33]. However, invasiveness and cost became the significant barriers in their clinical application. With the recent advancement of multifrequency BIA [34,35] and because of its cost-effectiveness, accuracy, and turnaround time, it has become comparable to dual-energy X-ray absorptiometry [20-22] and could be useful in evaluating the volume status of HF patients at the bedside [15].
ECW/TBW is significantly increased in AHF patients, and in this study, ECW/TBW obtained from the lower extremities has superior predictive value compared with that obtained from other parts. Interestingly, both AHF and non-AHF patients showed increased ECW/TBWL. ECW is subdivided into the interstitial water and plasma water, and the disposition is regulated by Starling forces and other determinants [36,37]. In the dependent position, gravity enhances the hydrostatic pressure in the blood vessels, which leads to the increase of transcapillary filtration [38,39]. All patients in this study were ambulatory; therefore, plasma water filtration and accumulation in the interstitium might have been augmented in the lower extremities. In AHF patients, increased level of neurohormonal activity contributes to sodium and water retention, which further leads to additional increase of ECW. Considering these findings, it can be speculated that ECW/TBWL is higher compared with ECW/TBWU regardless of AHF diagnosis, and ECW/TBWL is much more increased in AHF patients (Fig. 4); therefore, the discrepancy between the groups was most prominent in the lower extremities of AHF patients.
Pulmonary and systemic congestions, most often the result of high LV diastolic pressures, could present as various findings, including pulmonary and pretibial edema. These findings are typically observed in both patients with AHF and those with advanced HF [40]. Increased LV diastolic pressure could cause pulmonary edema just before pretibial edema, which are both markers of interstitial fluid. However, intravascular fluid status might change nearly simultaneously. In this study, AUC for predicting AHF was comparable and even higher at the lower extremities compared to the trunk. We suggest that BIA rather than physical examination predicted the overloaded status of ECW in advance, which comprises the interstitial and intravascular fluids, owing to the overlapping hydrostatic pressure. Using ECW/TBWU in addition to ECW/TBWL might help reduce the possibility of false-positive results such as deep-vein thrombosis.
Our study has several limitations. This single center, prospective, exploratory study included a relatively small number of patients; therefore, an unmeasured bias could have influenced this study. In addition, we only included patients who could undergo echocardiography in the emergency department; thus, critically ill patients were not included.
In conclusion, ECW/TBWL in AHF patients is significantly increased compared with that in non-AHF patients and is significantly correlated with log BNP level. It has an independent clinical value for AHF diagnosis among patients with dyspnea suspected of having AHF. Considering the rapid evaluation and diagnostic accuracy, body fluid status assessment by BIA may be a promising tool in diagnosing AHF.
KEY MESSAGE
1. In acute heart failure (AHF) patients, the ratio of extracellular water divided by total body water (ECW/TBW) is significantly increased in all segments, especially in lower extremities.
2. Among the body compartments, ECW/TBW of lower extremities has the most accurate predictive power for AHF. With the reference value of 0.412, the sensitivity and specificity are 0.780 and 0.960, respectively.
3. In multivariate analysis, increased level of ECW/TBW > 0.412 from lower extremities is an independent diagnostic marker for AHF diagnosis.
 PDF Links
 PubReader
 ePub Link
 Full text via DOI
 Download Citation
 Supplement 1
 Print
Print


