


INTRODUCTION
The clinical significance of 18F-fluorodeoxyglucose (FDG) positron emission tomography/computed tomography (PET/CT) imaging in predicting multiple myeloma (MM) in patients has been revealed in previous studies [1]. The number of focal lesions (FLs) on PET/CT scans at the time of diagnosis is a reliable prognostic indicator [2,3]. Efforts to elucidate the underlying mechanisms responsible for the aggregation of plasma cells visually identified as FL or diffuse bone lesions have been performed, particularly in the context of their genetic background. Rasche et al. [4] reported a significant association between the presence of multiple large FLs and high-risk features, such as gain(1q), del(17p), and a high GEP70 score. Another study conducted by Zhou et al. [5] observed higher maximum standardized uptake values (SUVmax) in PET/CT scans in patients harboring the del(17p) compared to those without del(17p) in the setting of relapsed and refractory disease. These studies collectively imply that a close association may exist between PET/CT findings and the tumor’s genetic composition. To explore this association, we performed DNA sequencing analysis on patients with MM and compared the differences in mutational characteristics with PET/CT findings. Furthermore, we performed serial DNA sequencing and PET/CT to track disease progression and mutational evolution following the initial first-line treatment.
METHODS
Patients and treatments
Fourteen newly diagnosed patients with MM at Kyungpook National University Hospital were included in this study. Their medical records were retrospectively reviewed. Bone marrow (BM) aspiration and PET/CT imaging were performed before the initiating first-line treatment. All patients were treated with bortezomib-based first-line chemotherapy. Patients who were eligible for stem cell transplantation proceeded to autologous stem cell transplantation with high-dose melphalan-based chemotherapy. Treatment responses were evaluated using the International Myeloma Working Group consensus criteria after four cycles of first-line chemotherapy [6]. Relapses that occurred within 18 months of the initiation of first-line treatment were defined as early relapses. This study was reviewed and approved by the Institutional Review Board of Kyungpook National University Hospital (IRB No. 2023-06-023), and all study procedures were conducted in accordance with the Declaration of Helsinki. This study was conducted on already available data, and institutional review boards of every participating center approved the study under the national ethical guidelines.
Next-generation sequencing (NGS)
DNA extraction and library preparation
BM samples preserved at the Biobank of Korea-Kyungpook National University Hospital, a member of the Korea Biobank Network were used for sequencing. CD138-positive MM cells were isolated from the BM samples using CD138 MicroBeads (Miltenyi Biotec, Bergisch Gladbach, Germany) according to the manufacturer’s instructions. The isolated MM cells were subjected to targeted DNA sequencing using a customized panel developed by Macrogen (Seoul, Korea), based on NGS technology, which covered 80 genes that were potentially relevant to MM biology (Supplementary Table 1) [7].
For optimal examination, a minimum of 10 mL of BM sample was required. DNA extraction from the enriched plasma cells was performed using the QIAamp Circulating Nucleic Acid Kit (Qiagen, Valencia, CA, USA), following the manufacturer’s instructions. Initial quality control checks of the eluted DNA were performed using the Qubit dsDNA HS Assay Kit with the Qubit 2.0 fluorometer (Life Technologies, Carlsbad, CA, USA) and the 2100 Bioanalyzer with High-Sensitivity DNA Chips (Agilent Technologies, Santa Clara, CA, USA), according to the manufacturers’ instructions. For sequencing, libraries were prepared using the SureSelect XT low-input protocol (Agilent Technologies). Each library was individually indexed and barcoded for sequencing. The quality of the libraries was assessed using a 2100 Bioanalyzer (Agilent Technologies), and the product size ranged from 200 to 400 bp. The libraries were quantified using a Qubit dsDNA HS Assay Kit with a Qubit 2.0 fluorometer (Life Technologies). Sequencing was performed in a paired-end (2 × 150 bp) format on a NovaSeq6000 instrument (Illumina, San Diego, CA, USA) that uses sequencing-by-synthesis chemistry.
Data preprocessing and alignment
Sequencing was performed using the Illumina NovaSeq6000 platform, which generated 150-bp paired-end raw Fastq files. Fastq files with low quality (Phred score < 30) were filtered using the FastQC tool (version v.0.12.1) [8]. The quality-controlled Fastq files were aligned to the human reference genome GRCh37 using BWA-MEM (version 0.7.17) in the paired-end mode [9]. Following alignment, the SAM files were converted to BAM format using Samtools (version 1.11) and Picard (version 2.26.11). SortSam and MarkDuplicates functions were performed [10].
Variant calling and germline variant filtration
The postalignment process used the Genome Analysis Toolkit (GATK) (version 4.0.5.1) for the analysis pipeline of somatic variant calling [11]. Before the somatic variant calling procedure, base quality score recalibration was performed. Variants were identified using Mutect2 and filtered based on a variant allele frequency of < 0.01. Because of the absence of matched nontumor samples in the study, a comparison with external databases, such as the Genome Aggregation Database (https://gnomad.broadinstitute.org/) and the 1000 Genome Project (https://www.internationalgenome.org/), was performed to exclude the identified variants. In addition, the Catalog of Germline Variants in Cancer was used to further filter out germline variants that were potentially linked to the East Asian population [12]. Variant annotation was performed using dbSNP in conjunction with GATK VariantAnnotator, and for the prediction of the functional effect, SnpEff (version 5.2) was used [13,14].
18F-FDG PET/CT
Whole-body PET/CT scans using an 18F-FDG tracer were performed on all patients. PET/CT findings were characterized by two features: the number of FL, identified by focal uptake of FDG greater than that of the liver, and the presence of diffuse lesions, characterized by the diffuse uptake (DU) of FDG in the BM. DU was quantified numerically using the Deauville score, which demonstrated its feasible use to interpret PET/CT findings in patients with MM by quantifying the FDG uptake [15]. The scans were performed using the Discovery ST FDG PET/CT system (GE HealthCare, Chicago, IL, USA). Patients fasted for at least 6 hours before the intravenous administration of 18F-FDG (4.1–7.4 megabecquerel [MBq] per kg of body weight) to ensure that their serum glucose levels were < 7.2 mmol/L. At 60 ± 10 minutes after FDG administration, a low-dose CT scan was performed without contrast enhancement for attenuation correction, which covered the whole body. Following CT scan, PET scans were obtained using the same anatomical reference. The images were reconstructed using the conventional ordered subset expectation maximization iterative algorithm. Image display and analysis were performed using workstations (AW Volume Share; GE HealthCare), which provided the multiplanarly reformatted images.
Statistical analysis
The comparison of the nonparametric variables was performed using the Mann–Whitney U test, whereas the Fisher exact test was used to compare the categorical data. Progression-free survival (PFS) was measured as the duration from the time of diagnosis to the onset of disease progression or all-cause death. Overall survival (OS) was calculated as the duration from the time of diagnosis to the last follow-up or all-cause death. The Kaplan–Meier method was used to plot PFS and OS, and group comparisons were performed using the log-rank test. Statistical analyses were performed using R statistical software 4.3.1 (the R Foundation for Statistical Computing, Vienna, Austria).
RESULTS
Patient characteristics
Fourteen newly diagnosed patients with MM were included in this study. The median age of the patients was 66 years (49–76 yr), with five males. Ten patients (71.4%) were in R-ISS stage II, whereas R-ISS stages I and III were present in two patients each. High-risk cytogenetic abnormalities (CA), such as t(4;14), t(14;16), del(17p), and gain/amp (1q), were identified in eight patients (57.1%). Two patients had two or more of these CA concurrently. Notably, five patients harbored the del(17p). Seven patients presented with more than three FL (FL > 3), and five patients demonstrated DU with a Deauville score of 3. Additionally, DU was observed in two and three patients with Deauville scores of 4 and 5, respectively. All patients were administered a bortezomib-based initial treatment, which achieved an overall response rate of 92.9% and a complete response rate of 14.3%. None of the patients received lenalidomide-based maintenance therapy. Over the median follow-up period of 26.4 months, eight patients experienced disease relapse, with six of these cases being early relapses. The detailed patient characteristics of the enrolled patients are described in Table 1.
NGS at the initial diagnosis
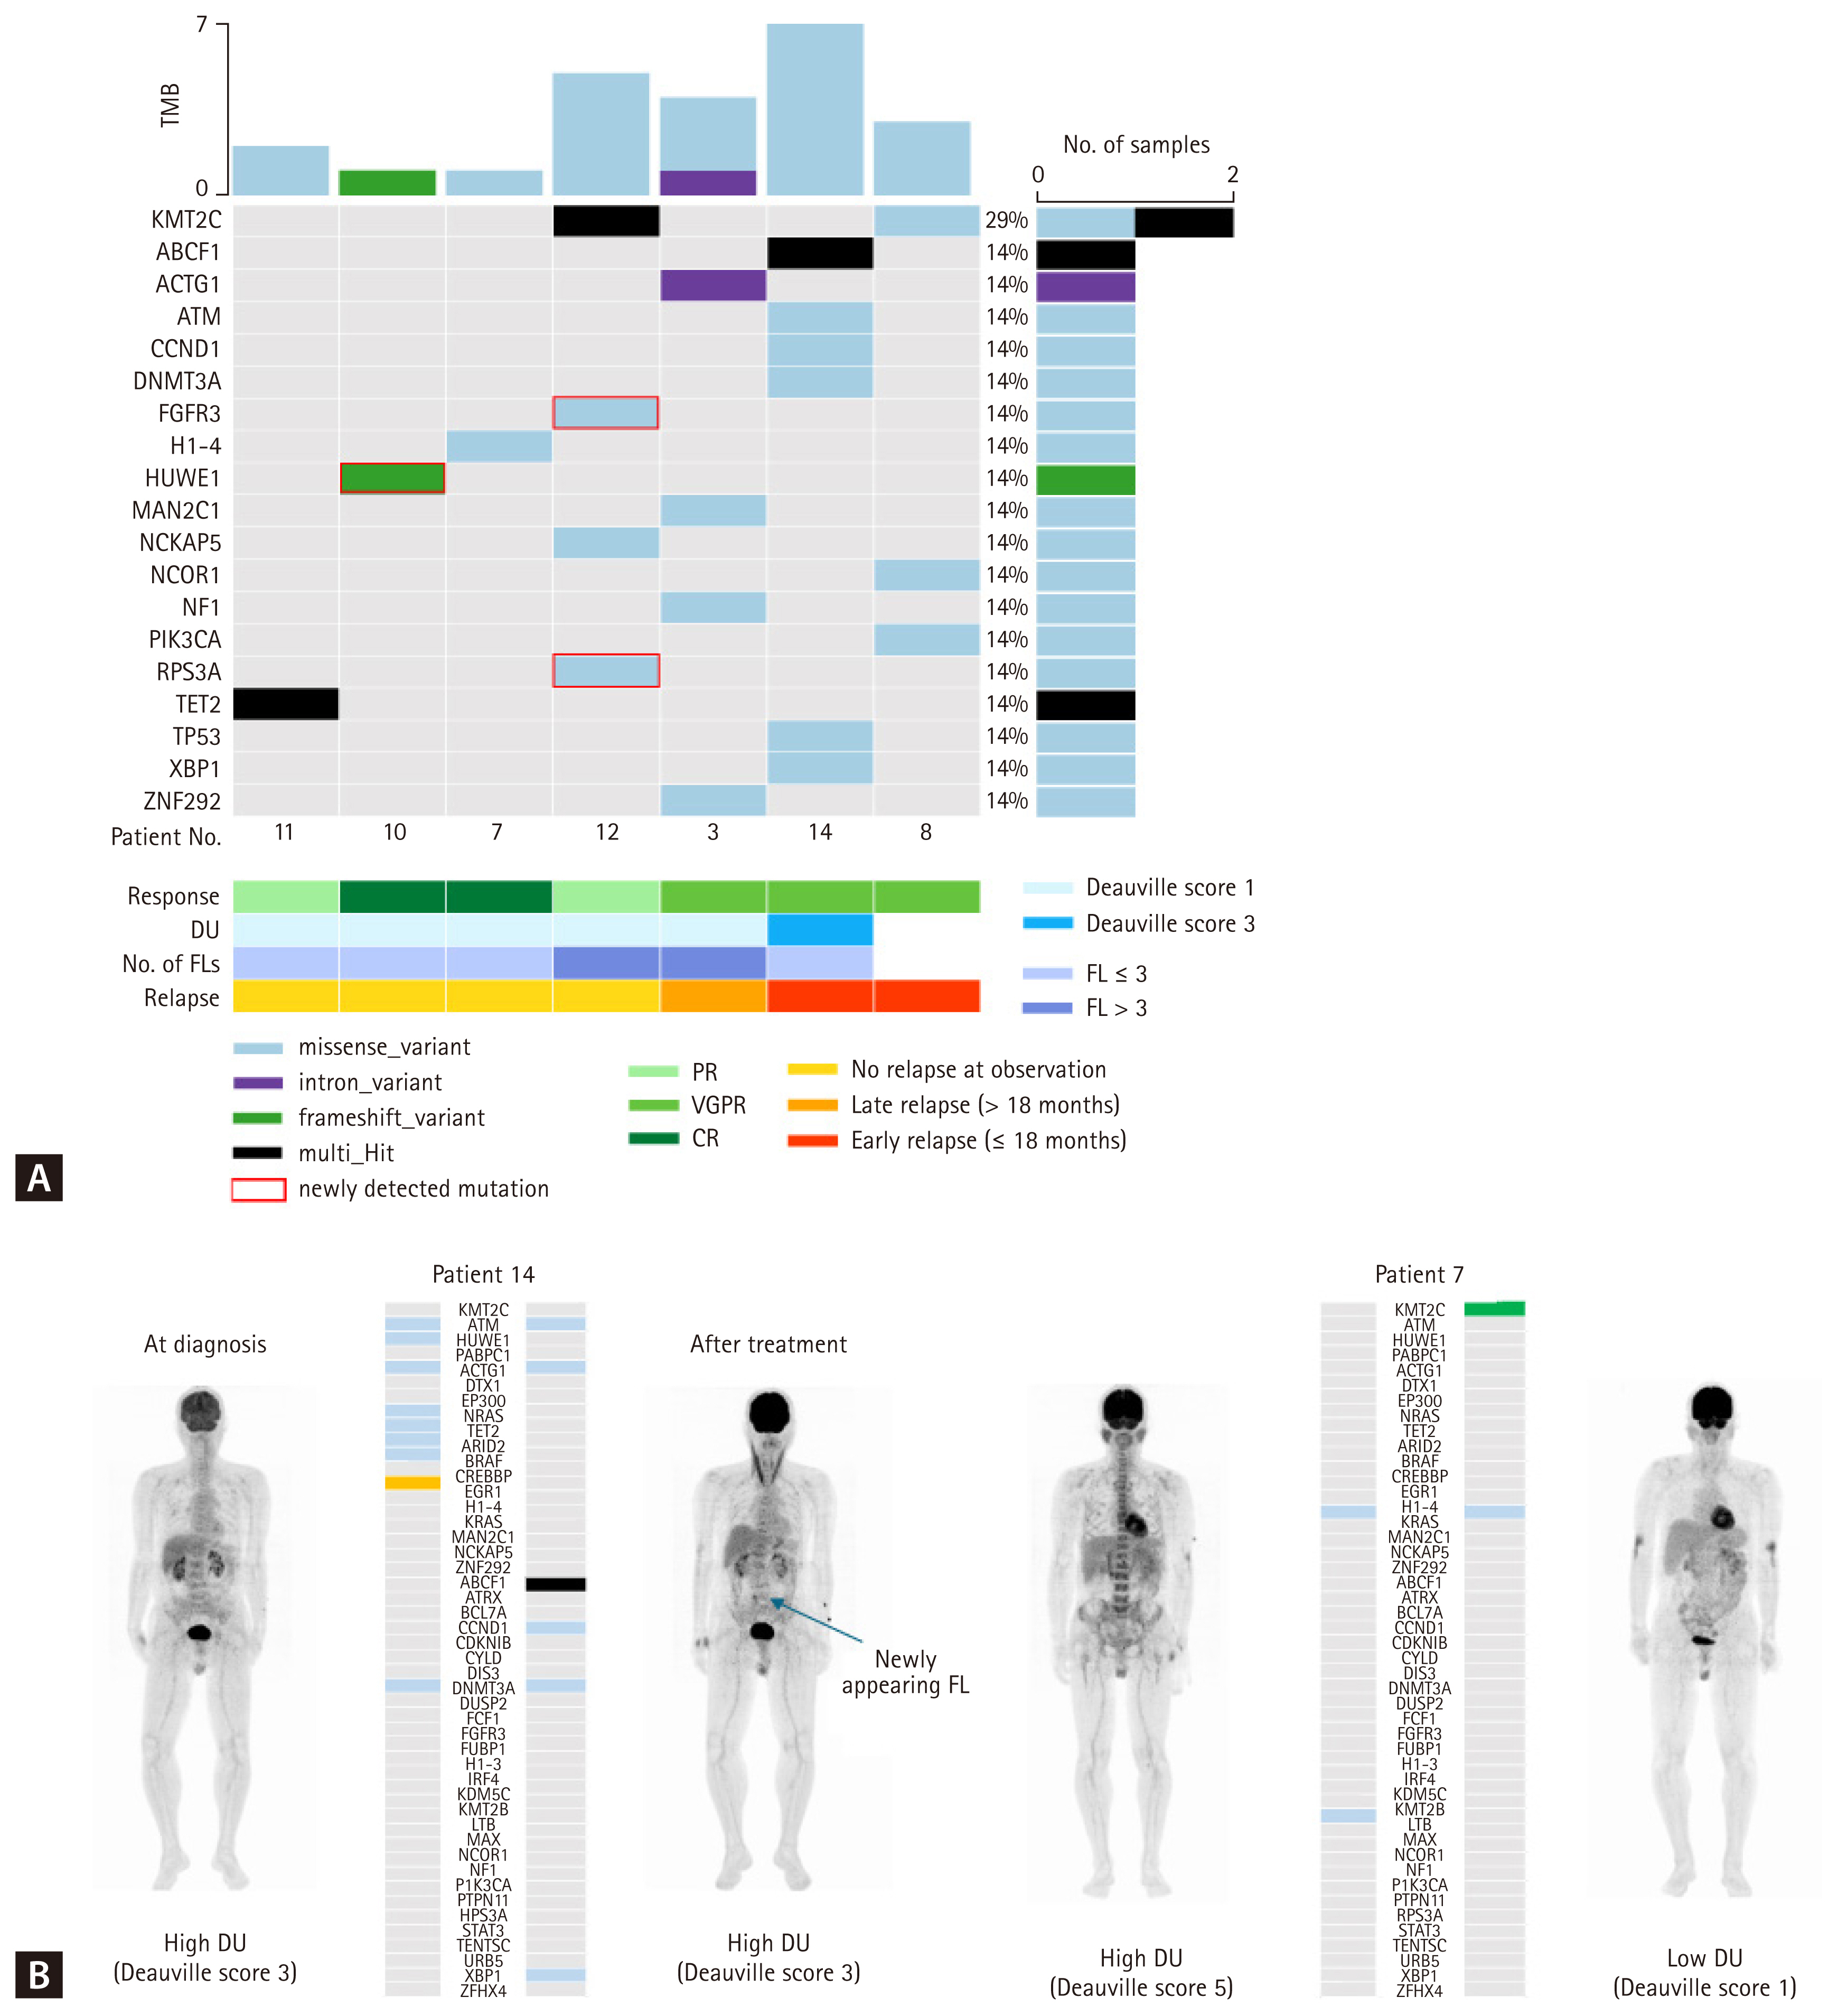
A total of 86 mutations with an allelic frequency of > 1%, excluding synonymous variants, were identified. The median number of mutations was 5 (2–16), and the top 30 genes are presented in Figure 1. The most frequently detected gene was ATM (found in 35.7% of cases; 5/14), followed by HUWE1, PABPC1, and TP53, which were each present in 28.6% of cases (4/14) (Fig. 1A). Patients with high DU of FDG in the BM equivalent to Deauville scores 3, 4, and 5 (high DU) tended to exhibit more varied mutational characteristics than those with low DU equivalent to Deauville scores 1 and 2 (low DU) (Fig. 1A). Patients with high DU were likely to have a higher median number of mutations per patient, as demonstrated in Supplementary Figure 1, with a median of 5 mutations, whereas those with low DU showed a lower mutational burden, with a median of 3 mutations (p = 0.076) (Fig. 1B). The frequency of each mutation varied according to the degree of FDG uptake in the BM. Mutations such as HUWE1, DTX1, EP300, NRAS, EGR1, H1–4, KMT2C, and KRAS were exclusively identified in patients with high DU, whereas the BRAF mutation was exclusively identified in patients with low DU (Fig. 1C). Meanwhile, no differences were observed in not only the mutational burden but also in the distribution of each mutation relative to the number of FLs (Supplementary Fig. 2). In an analysis of the high-risk features, such as a high R-ISS stage and high-risk CA, neither the number of FLs nor the high DU showed a significant association with them. To assess the clinical significance of PET/CT findings and mutational burden, survival analysis was performed. In terms of PFS, no significant differences were observed based on the degree of DU and mutational burden (Supplementary Fig. 3). However, patients with high DU showed an inferior OS, although statistical significance was not achieved (p = 0.27) (Fig. 1D). Similarly, when patients were categorized according to the mutation cutoff value of 5, those with a lower mutational burden tended to exhibit better OS outcomes than those with a higher mutational burden (p = 0.19) (Fig. 1D).
Serial NGS and PET/CT after first-line treatment
Serial BM biopsies and PET/CT scans were performed after four cycles of first-line treatment in seven and six patients, respectively. Most patients showed improvement in their PET/CT findings. A decrease in the number of FLs was observed in four patients. Regarding the DU, seven patients exhibited a considerable improvement, achieving a Deauville score of 1, except for patient 14. Dynamic changes in mutations were observed in the serial BM samples. The commonly detected mutations are illustrated in Figure 2A. The most identified mutation was KMT2C (28.6%; 2/7). Although most mutations that were present at diagnosis disappeared after initial treatment, several new mutations emerged in some patients (patients 8, 10, 12, and 14). Patient 12 exhibited the emergence of mutations such as FGFR3 and PRS3A. It was not evaluated whether the disease proceed ed to progression or not because this patient died with infection within 18 months from the initial diagnosis. Patient 8 developed new mutations such as KMT2C, NCOR1, and PIK3CA. This patient experienced an early relapse within 18 months after the initiation of treatment. Interestingly, patient 14, who exhibited no improvement in DU on PET/CT but rather developed new FL in the L-spine, showed somewhat progressed results in the serial NGS analysis with the emergence of mutations such as ABCF1, CCND1, and XBP1 (Fig. 2B). Patient 14 also relapsed early. Conversely, some patients exhibited improved mutational profiles in parallel with complete resolution of PET/CT abnormalities. For example, patient 7 did not develop any new mutations and showed complete response of PET/CT abnormalities (Fig. 2B). The patient maintained a consistent treatment response at the time of observation.
DISCUSSION
Herein, we report an association between FDG PET/CT findings and the mutation characteristics of MM. Patients with high DU were more likely to have diverse and exclusive mutation profiles than those with low DU. Intensified diffuse signal patterns on MRI indicate a high tumor burden and advanced disease, which are known to result in inferior survival outcomes [16,17]. Similarly, diffuse BM uptake of FDG, which was observed in all patients with varying degrees of tracer uptake, was also associated with survival outcome [18]. In this study, over 70% of patients exhibited high DU. To determine the clinical significance of DU, we analyzed its association with known high-risk features, including a high R-ISS stage and CA; however, no significant links were identified. The number of mutations was significantly higher in patients with high DU than in those with low DU. Patients with a high mutational burden tended to exhibit an inferior OS, which is consistent with previous literature that reported negative outcomes associated with more mutations [19]. MM is preceded by a premalignancy called monoclonal gammopathy of undetermined significance (MGUS), which primarily involves genetic events such as hyperdiploidy or IgH gene translocation. In the pathogenesis underlying the transition to MM from MGUS, genetic events that affect diverse signaling pathways, including the MYC, NF-κB, and MAPK pathways, plasma cell differentiation, cell cycle regulation, and DNA damage repair, are followed [20]. When considering this biological background involving MM, each mutated gene detected in patients with high DU can play a key role in the genetic signaling pathways, thereby contributing to the progression of MM. Mutations such as KRAS and NRAS are well-known driver genes that are detected in up to 40% of patients with MM, and affect the MAPK pathways [20]. Other mutations, such as ATM and TP53, affect the DNA damage repair pathway [20]. Notably, several epigenetic mutations, including EP300, TET2, ARID2, H1–4, CREBBP, and KMT2C, were frequently detected in patients with high DU. Moreover, the biological processes associated with epigenetic pathways, such as chromatin remodeling and histone remodeling, were predominantly enriched in the gene ontology analysis of the mutations detected in high DU, as shown in Supplementary Figure 4. These epigenetic regulations promote tumorigenesis in various hematologic malignancies and have been proposed as a mechanism explaining disease progression and relapse in MM [21]. Limited investigations into the role of epigenetics in terms of their clinical impact have been conducted in patients with MM. Mutations such as EP300 may be linked to gain/amp (1q), and the ARID gene family has been associated with inferior survival outcomes [22]. HUWE1, which was exclusively detected in patients with DU, was recently identified as a novel driver mutation in MM [19]. The protein encoded by HUWE1 modulates c-Myc, which is an oncogene that is potentially linked to the early pathogenesis and disease progression of MM [23]. However, we could not identify an association between the number of FLs, a known predictive parameter, and mutational profiles. The discordance of genomic information between FL and BM, often referred to as spatial heterogeneity, may be involved [24]. To investigate this association, alternative approaches, such as tissue biopsy of FL or liquid biopsy, are necessary.
In the serial follow-up results, most mutations present at diagnosis disappeared concurrently with the improvement in PET/CT findings, and new mutations emerged. It is challenging to conclude whether mutational evolution was primarily driven by selective or acquired processes and to understand the biological implications of this evolution because of the limited number of follow-up cases. However, we reasonably hypothesized that the residual disease on imaging may be associated with mutational evolution, as supported by the two patient cases: patient 14, who showed no improvement in DU alongside the emergence of new mutations, and patient 7, who exhibited a complete imaging response with the disappearance of mutations. In particular, patient 14 relapsed earlier than patient 7. Considering that early relapse predicted inferior survival [25], mutational evolution may be potential mechanism that explains the biological implications of PET/CT findings and early relapse. This hypothesis is supported in a study investigating tumor evolutionary patterns using longitudinal imaging -guided biopsies, which found that patients exhibiting unique subclones at distinct locations after relapse demonstrated poor outcomes [26].
However, this study has some limitations. The number of included cases was too small, particularly for serial follow-ups, to reach statistical significance. In addition, all patients received a triplet regimen without maintenance therapy, which may have limited the analysis of survival outcomes in the current era of quadruplet regimen and maintenance therapy. Lastly, the biological implications of PET/CT could not be fully explored because we adopted targeted sequencing rather than whole exome or whole genome sequencing. A recent study using whole genome-wide transcriptomic analysis demonstrated the association between PET/CT and transcriptomic signatures, with specific gene expression profiles corresponding to PET/CT findings and high-risk features [27].
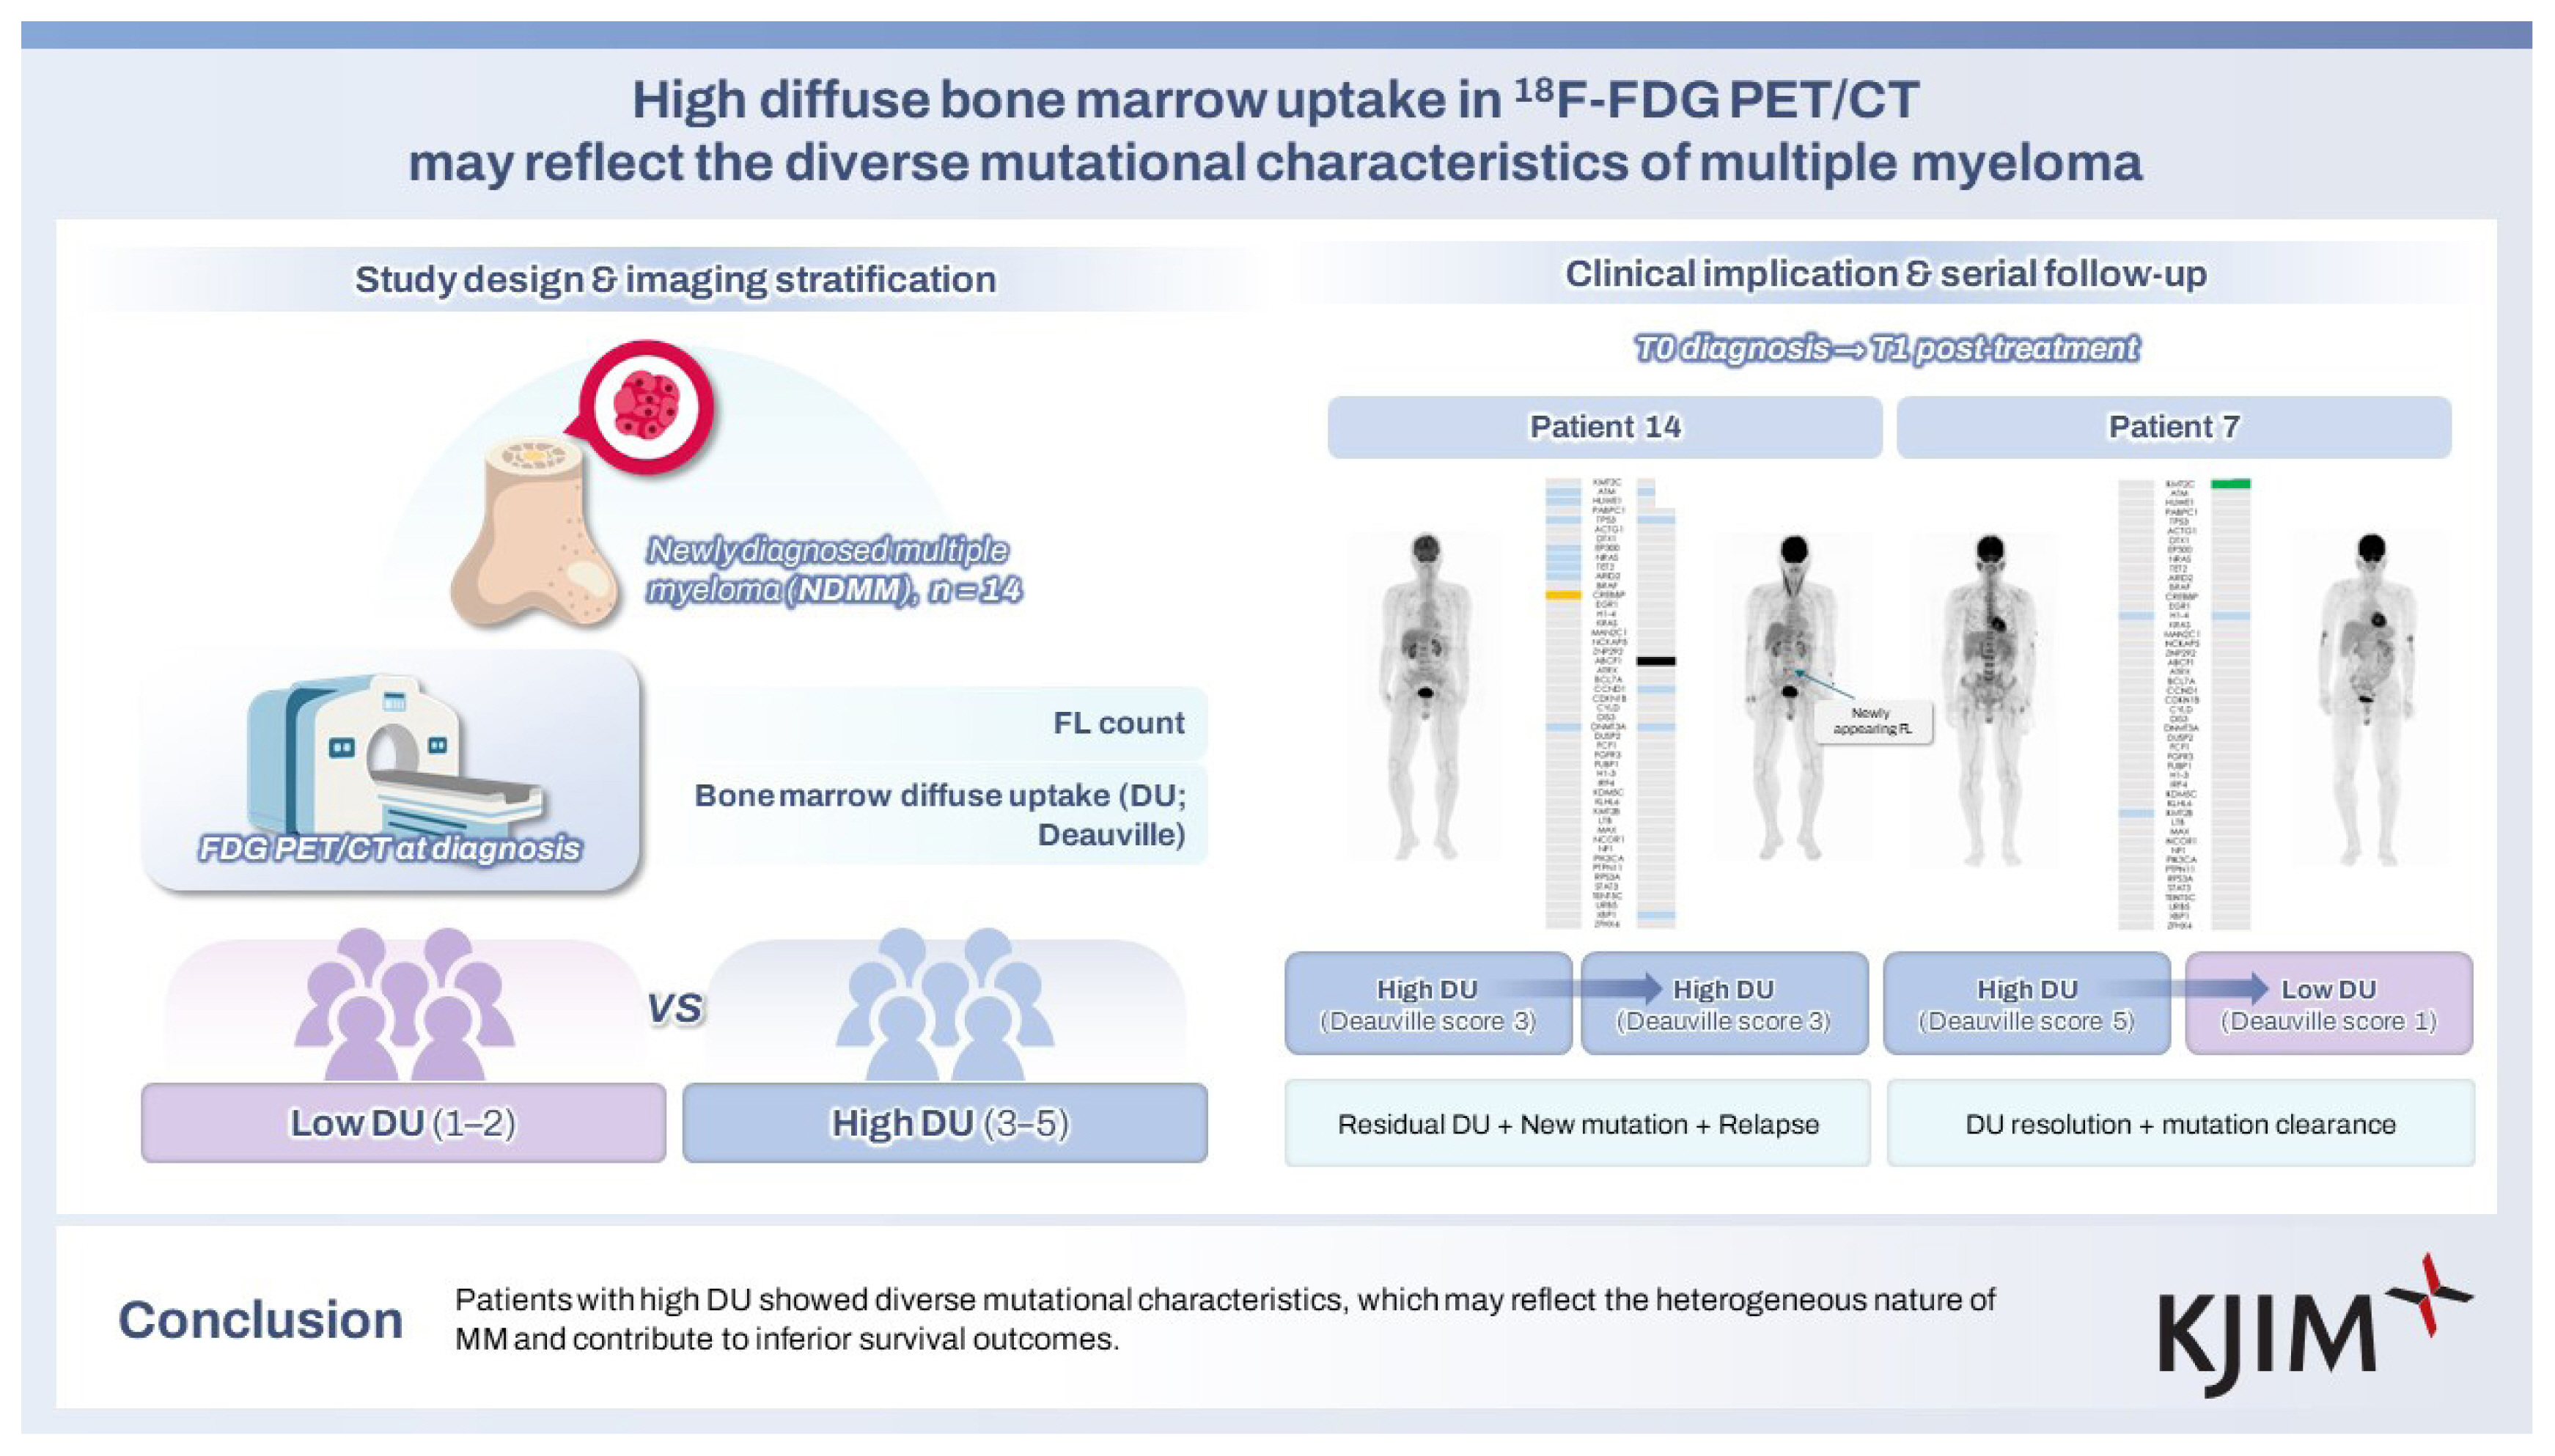
In conclusion, our study identified a high mutational burden in patients with a high diffuse BM uptake in FDG PET/CT imaging, which was likely to result in inferior survival outcomes. Moreover, multioncogenic pathways, including epigenetic regulators relevant to disease initiation, were primarily observed in patients with high DU. Diffuse BM lesions may reflect the heterogeneous characteristics of MM and could explain the disease course that is characterized by relapse despite the use of novel agents. To reinforce these findings, further investigation incorporating comprehensive molecular analyses with a larger cohort of patients is required.
KEY MESSAGE
1. High DU in FDG PET/CT is associated with a higher mutational burden and reflects the heterogeneous genomic characteristics of MM.
2. Patients with high DU harbored mutations linked to oncogenic and epigenetic pathways, potentially contributing to inferior OS.
3. Serial PET/CT and sequencing revealed that persistent DU was associated with mutational evolution and early relapse, underscoring its potential as a marker of residual disease and disease aggressiveness.

 PDF Links
 PubReader
 ePub Link
 Full text via DOI
 Download Citation
 Supplement figure 1
 Print
Print


