


INTRODUCTION
Hepatitis C virus (HCV) is a significant global health burden, affecting approximately 3% of the world’s population [1] . Egypt, with over 100 million people, has historically reported one of the highest HCV prevalence rates worldwide, with a 2015 adult prevalence of 7% contributing to 7.6% of national mortality [1,2] .
Iron overload is known to exacerbate liver injury in chronic hepatitis C (CHC) through oxidative stress, cellular damage, and fibrogenesis. Elevated serum iron and hepatic iron deposits have been detected in up to 40% of CHC patients, and even more frequently in those with hepatocellular carcinoma [3] . However, the relationship between iron status and sustained virological response (SVR) to antiviral therapy remains unclear, with studies reporting inconsistent associations between hepatic iron concentration and treatment outcomes [4–6] .
Genetic factors, such as mutations in the HFE gene (notably C282Y and H63D), influence iron metabolism and may partly explain variability in treatment response. In particular, iron deposition in hepatic endothelial and Kupffer cells has been linked to reduced SVR. Ethnic and regional variation in HFE mutation distribution may further contribute to conflicting findings across populations [7] .
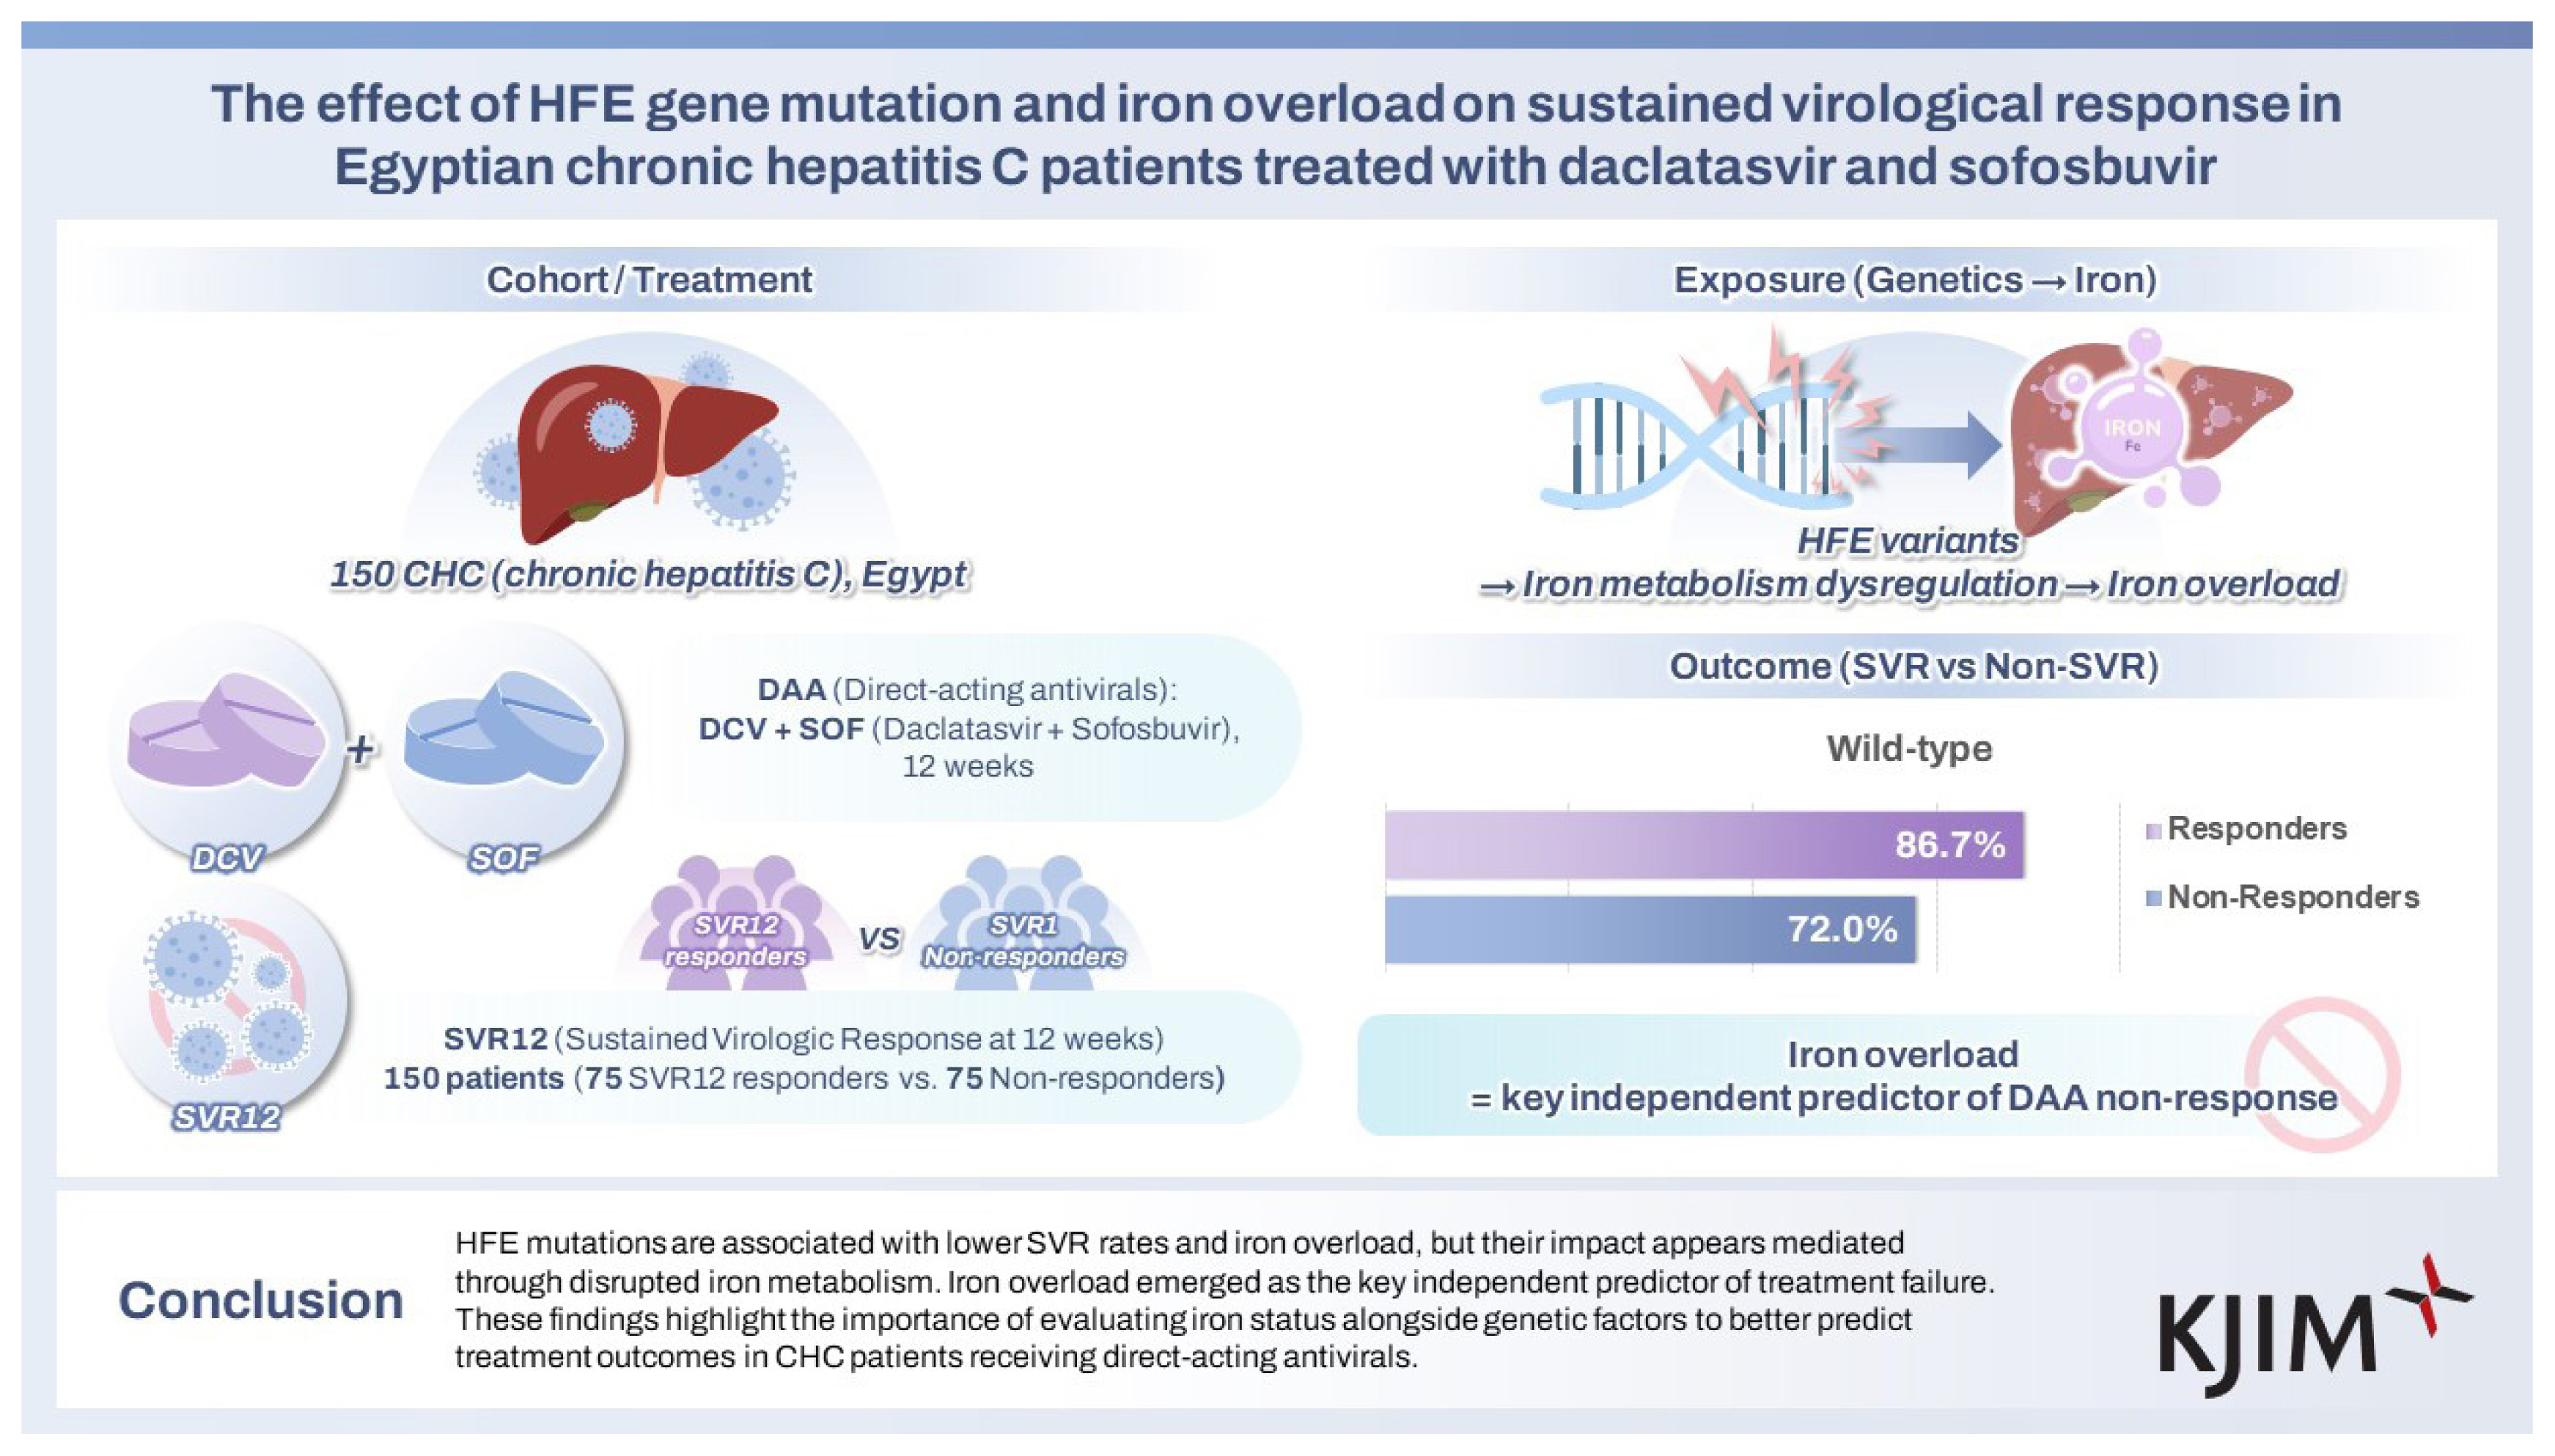
The public health system in Egypt provides HCV antiviral therapy free of charge to selected patients. Current government guidelines recommend a 12-weeks of a combination of daclatasvir (DCV; an NS5A inhibitor) and sofosbuvir (SOF; a nucleotide NS5B inhibitor) for patients with HCV. This study assesses the prevalence of HFE C282Y and H63D gene polymorphisms and their association with iron overload and SVR rates in Egyptian CHC patients treated with DCV and SOF.
METHODS
The current matched case-control study was conducted on patients confirmed to have CHC who were treated with DCV 60 mg once daily and SOF 400 mg once daily for 12 weeks. Cases and controls were recruited using consecutive sampling from patients in the outpatient clinic of the National Liver Institute, Menoufia University, from June 2022 to September 2023.
As confirmed by polymerase chain reaction (PCR) testing, the cases (non-responders) group consisted of 75 patients who did not achieve viral clearance 12 weeks after antiviral treatment SVR12. The control (responders) group consisted of 75 patients who achieved SVR12 after completing antiviral treatment, as confirmed by PCR testing. Both groups were matched for age and sex. Frequency matching was applied based on age and sex to ensure comparability between responders and non-responders.
Selection and matching procedure
In this matched case-control study, for each non-responder, a responder was selected from the same outpatient cohort, applying frequency matching on age (within 5-year intervals) and sex. When multiple responders were available for a specific age-sex combination, random selection was performed using a computer-generated randomization sequence.
The study was approved by the Institutional Review Board of the National Liver Institute Research Ethics Committee and the University of Sadat City (EC#: 00285 / 2022, March 2022). Before enrollment, informed consent was obtained from all patients.
Patients having CHC as confirmed by persistently elevated hepatic enzymes for 6 months or more and by PCR detection of HCV RNA, aged above 18 years old, who are confirmed to have received DCV 60 mg once daily plus SOF 400 mg once daily for 12 weeks were included in the current study. Patients with decompensated hepatic cirrhosis, malignancy, other causes of viral hepatitis co-infection, other causes of liver diseases, or patients who refused to participate were excluded from this study.
Study procedures
Laboratory personnel were blinded to patient response status to minimize bias in data entry and genetic analysis. All assays were conducted in duplicate, and quality control procedures included standardized calibration protocols and validation of test reproducibility.
All enrolled patients underwent complete history taking, clinical examination, and laboratory investigations, including a liver biochemical profile: alanine aminotransferase (ALT), aspartate aminotransferase (AST), bilirubin total and direct, serum albumin, and alpha-fetoprotein (AFP), platelet count, and complete iron profile: serum iron, ferritin, transferrin saturation, and total iron binding capacity (TIBC).
The CBC analysis for all subjects was performed using the automated hematology analyzer XN (Sysmex, Kobe, Japan). Other laboratory investigations were carried out using the clinical chemistry module of Cobas 6000 (C 6000; Hitachi, Roche, NY, USA) (Fig. 1A).
Quantitative HCV RNA was performed using the automated real-time PCR system (Rotor-Gene Q MDx; Qiagen, Hilden, Germany) (Fig. 1B).
Molecular study of HFE Gene (C282Y, H63D, and S65C)
Human genomic DNA was first extracted from peripheral blood samples of the affected patients using QIAGEN DNA Extraction and Purification Kits. DNA sequencing for HFE Mutations is recognized by the restriction fragment length polymorphism analysis. That was conducted using the HFE gene detection kit (Thermo-Fisher Scientific Inc., Waltham, MA, USA) on the PCR thermal cycler. PCR was performed using a PCR thermal cycler (MultiGene OptiMax; Labnet Intl., Inc., Edison, NJ, USA) (Fig. 1C). A total volume of 25 μL PCR reaction containing 12.5 μL of ready-to-use PCR Master Mix supplied by ThermoScientific, DreamTaq Green PCR Master Mix kit, 5.5 μL of Nuclease-free water, one μL (20 pmol) of primer F, one μL (20 pmol) of primer R, and five μL (100 ng) of extracted DNA, was used.PCR cycles were 35 cycles of 96°C for 2 minutes, 96°C for 30 seconds, 56°C for 1 minute, 72°C for 1 minute and final extension step of 72°C for 5 minutes. Ten microliters of the PCR products were subsequently digested with the restriction enzymes, as shown in Table 1. The products of digestion were electrophoresed on a 3% gel (1:1 agarose/Nusieve) to visualize the fragments.
Sample size calculation
Based on the study by I Mehrez et al. (2017) [8], non-responders had a higher prevalence of the C282Y mutation (65.3%) compared to responders (7.14%). We also assume that non-responders had a more mutation rate (60%) than responders (40%). With a 95% confidence level and a power of 90%, a sample size of 127 subjects rounded to 150, is calculated [8].
Statistical analysis
A 95% confidence level was used for all statistical tests. A p value < 0.05 was regarded as statistically significant. Data were analyzed using R software, version 4.5.0 (R Foundation for Statistical Computing, Vienna, Austria) and the SPSS software (Statistical Package for the Social Sciences, version 25.0; IBM Corp., Armonk, NY, USA). Numerical data were evaluated for normality by the Shapiro–Wilk test. Data was exhibited as (mean ± standard deviation) for continuous variables (median [interquartile range, IQR]) for ordinal and non-parametric data. Frequency and percentage were presented for categorical variables. Comparisons between categorical variables were made using Pearson’s chi-square test or the Phi–Cramer’s V test, as appropriate. Comparisons between numerical variables were performed using the independent samples t-test for normally distributed data or the Mann–Whitney U test for non-normally distributed data. Logistic regression, adjusted for age and sex was carried out to examine how HFE mutation status affects SVR. Because many biochemical variables are highly correlated, principal component analysis (PCA) was applied to condense them into independent factors. These PCA-derived factors, together with HFE status, age, and sex, were then included in a multivariate model to clarify direct and indirect effects. Model performance was assessed with standard goodness-of-fit measures.
RESULTS
Demographic characteristics
Table 2 shows no significant sex differences (p = 0.744) between responders and non-responders, with men accounting for 46.67% of respondents and 49.33% of non-responders. Responders and non-responders had comparable median (IQR) ages of 42.00 (24.00) years and 43.00 (23.00) years, respectively (p = 0.756).
Laboratory data
Significant differences were found in liver enzymes and bilirubin levels. Non-responders exhibited significantly higher levels of ALT median (IQR) 54.00 (55.00) U/L than responders 34.00 (43.00) U/L (p = 0.001) and AST 58.00 (60.00) U/L vs. 38.00 (30.00) U/L (p < 0.001). Total bilirubin levels were significantly elevated in non-responders, 0.80 (0.80) mg/dL, compared to responders, 0.70 (0.40) mg/dL (p = 0.006), along with direct bilirubin levels, 0.30 (0.30) mg/dL vs. 0.20 (0.30) mg/dL (p = 0.002). Nevertheless, albumin levels were comparable between groups (p = 0.642), as shown in Table 2.
Anslysis of iron metabolism parameters showed that non- responders had significantly higher transferrin saturation 46.00% (9.00%) vs. responders 38.00% (12.00%) (p < 0.001), serum iron 109.00 (26.00) mcg/dL vs. 76.00 (19.00) mcg/dL in responders (p < 0.001), and ferritin levels 192.00 (104.00) ng/mL vs. 103.00 (52.00) ng/mL in responders (p < 0.001). TIBC levels were significantly lower in non-responders, 208.00 (109.00) mcg/dL, compared to responders, 268.00 (147.00) mcg/dL (p < 0.001), as shown in Table 2.
Platelet count was significantly lower in non-responders, 102.00 (52.00)/microliter, than in responders, 191.00 (136.00)/microliter (p < 0.001). Additionally, AFP levels were significantly higher in non-responders, at 3.80 (6.70) ng/mL, compared to responders, at 2.00 (3.50) ng/mL (p < 0.001), as shown in Table 2.
HFE gene mutation status
Table 3 illustrates the distribution of HFE alleles and mutation type between responders and non-responders. The wild-type alleles were much more common in responders (86.67%) than in non-responders (72.00%), with a p value of 0.027 indicating a statistically significant relationship. In contrast, mutant heterozygous alleles were more abundant in non-responders (28.00%) than in responders (13.33%), implying a link between mutant alleles and non-responsiveness. None of the cases had homozygous alleles. The odds ratio (OR) analysis indicated that individuals carrying the wild (normal) gene had 2.59 times higher odds of being responders compared to those with mutant alleles (OR, 2.59; 95% confidence interval [CI], 1.10–5.83). This finding suggests that having a wild-type gene may have a protective role in the treatment response.
Regarding mutation types, the wild (normal) genotype was observed in 86.67% of responders and 72.00% of non-responders, though the difference did not reach statistical significance (p = 0.083). The C282Y mutation was detected in 2.67% of responders and 6.67% of non-responders, while the H63D mutation was present in 10.67% of responders and 21.33% of non-responders. Notably, no instances of the S65C mutation were found in either group.
Subgroup analyses
Iron profile in mutant versus wild cases
Table 4 shows that the mutant group had considerably higher median (IQR) iron levels, 103 (48) mcg/dL, than the wild (normal) group, 90 (34) mcg/dL, with a p value of 0.031, indicating a statistically significant difference. Also, the median (IQR) ferritin level was significantly higher in the mutant group, 165 (113) ng/mL, than the wild (normal) group, 133 (76) ng/mL, with a p value of 0.044, indicating a statistically significant difference. The TIBC or transferrin saturation percent was comparable between groups (p > 0.05).
Iron profile in C282Y versus H63D gene mutations
In Table 5, the iron level was significantly higher in the C282Y group median (IQR) 109 (35) mcg/dL compared to the H63D group 77 (32) mcg/dL, with a p value of 0.007. No significant differences were found between the two groups in TIBC, ferritin, or transferrin saturation.
Multivariate analysis
To investigate the predictors of SVR to antiviral therapy, we conducted a stepwise multivariate logistic regression analysis. In the first model, we examined whether the HFE gene mutation was independently associated with SVR after adjusting for age and sex. The results showed that the HFE mutation was significantly associated with increased odds of non-response to therapy (OR, 2.54; 95% CI, 1.12–6.09; p = 0.029). In contrast, age (OR, 0.99; 95% CI, 0.97–1.02; p = 0.613) and sex (OR, 1.13; 95% CI, 0.58–2.19; p = 0.728) were not statistically significant. This model had modest explanatory power, as indicated by a Nagelkerke R2 of 0.047 and an overall classification accuracy of 56.7%. The Hosmer–Lemeshow test suggested a good model fit (p = 0.950).
In the second model, we extended the analysis to include all available variables: HFE mutation, age, sex, serum iron, transferrin, TIBC, ferritin, ALT/GPT, AST/GOT, total bilirubin, and platelet count. However, this comprehensive model revealed a multicollinearity problem, particularly among iron-related indices and liver function markers, as reflected by elevated variance inflation factors. The presence of multicollinearity compromised the model’s stability and interpretability, necessitating dimensionality reduction to draw valid conclusions.
To address this issue, we applied PCA to the eight continuous biochemical variables, deriving three orthogonal principal components that collectively accounted for 69% of the total variance. The first component (PC1) predominantly reflected iron overload features, namely serum iron, ferritin, and transferrin. The second component (PC2) captured variations in liver enzyme levels (ALT and AST), while platelet count, and total bilirubin drove the third component (PC3). These three components were then incorporated into a final logistic regression model along with HFE mutation, age, and sex.
In this third and final model, the iron overload component (PC1) emerged as a strong and statistically significant independent predictor of non-response to therapy (OR ≈ 8885; p < 0.001). Interestingly, the HFE mutation lost its significance (p = 0.647), suggesting that disturbances in iron metabolism may mediate its initial association with treatment outcome. Age and sex remained non-significant. This model demonstrated excellent performance, with a Nagelkerke R2 of 0.924 and a classification accuracy of 93.3%. These findings are summarized in Table 6.
DISCUSSION
To the best of our knowledge, this is the first matched case-control study conducted on patients with confirmed CHC who received a combination of DCV 60 mg once daily and SOF 400 mg once daily for 12 weeks. The study aimed to evaluate the influence of different HFE gene mutations (H63D, C282Y, S65C) and iron profile parameters on SVR.
By matching participants for age and sex, we controlled for these potential confounders. That was reflected in the absence of significant differences between responder and non-responder groups in these variables. In contrast, Elhammadi et al. (2022) [9], in their retrospective cohort of 300 HCV patients (150 receiving SOF-DCV and 150 receiving SOF-DCV-RBV), found a significant association between non-response and both older age and male sex (p < 0.001). However, their retrospective design and lack of adjustment for covariates limit the strength of their findings compared to the present matched case-control study. Moreover, Elhammadi et al. [9] did not assess HFE gene mutations.
In our study, significant differences in liver enzymes were observed between responders and non-responders. ALT levels were significantly lower in responders, median (IQR): 34.00 (43.00) U/L compared to non-responders 54.00 (55.00) U/L (p = 0.001). Similarly, AST levels were lower in responders 38.00 (30.00) U/L than in non-responders 58.00 (60.00) U/L (p < 0.001), reflecting better liver function in the responder group. Albumin levels were comparable between the groups (p = 0.642). However, total and direct bilirubin levels were significantly higher in non-responders, with p values of 0.006 and 0.002, respectively. Platelet counts were significantly higher in responders 191.00 (136.00)/microliter than in non-responders 102.00 (52.00)/microliter (p < 0.001), and AFP levels were significantly elevated in non-responders 3.80 (6.70) ng/mL compared to responders 2.00 (3.50) ng/mL (p < 0.001).
These findings align partially with Elhammadi et al. [9], who reported lower ALT and AST levels and higher platelet counts in responders. Albumin levels were comparable in both studies. However, unlike our findings, Elhammadi et al. observed no significant difference in bilirubin or AFP levels between groups [9] .
Interestingly, I Mehrez et al. (2017) [8], in a study of Egyptian CHC patients treated with interferon and ribavirin, found no statistically significant differences in liver profile parameters between responders and non-responders. However, no p-values were reported to support this claim [8] .
Our results revealed a distinct profile regarding iron metabolism in responders vs. non-responders. Responders had significantly lower median transferrin saturation (38.00% vs. 46.00%; p < 0.001), serum iron (76.00 vs. 109.00 mcg/dL; p < 0.001), and ferritin levels (103.00 vs. 192.00 ng/mL; p < 0.001), while exhibiting higher median TIBC values (268.00 vs. 208.00 mcg/dL; p < 0.001). These findings suggest that responders had lower iron stores and a greater capacity for iron binding. As ferritin is also an acute-phase reactant, the observed differences may reflect inflammation.
I Mehrez et al. [8] reported similar trends, noting that non-responders had significantly higher serum iron and transferrin saturation, and lower TIBC, although they found no significant difference in ferritin levels. These findings point to a potential role for altered iron homeostasis in influencing therapy response [8] .
Previous literature has documented a link between elevated hepatic and serum iron levels and poor response to interferon therapy in CHC [10] . Iron accumulation in the liver, potentially due to hepatocellular injury and genetic predisposition, may promote HCV replication and pathogenesis, thereby contributing to treatment resistance [8] .
Concerning HFE genotypes, our study found that wild-type alleles were significantly more common in responders (86.67%) than in non-responders (72.00%; p = 0.027). None of the cases had homozygous mutations. Heterozygous mutations were more frequent in non-responders (28.00% vs. 13.33%). OR analysis indicated that individuals with wild-type alleles were significantly more likely to achieve SVR (OR, 2.59; 95% CI, 1.10–5.83), suggesting a protective effect.
Amongst mutation types in our current work, H63D was more common than C282Y. H63D was present in 10.67% of responders and 21.33% of non-responders, while C282Y was found in 2.67% of responders and 6.67% of non-responders. Though not statistically significant, these patterns indicate a possible link between specific HFE mutations, particularly H63D, and therapy non-response.
These results are consistent with those of I Mehrez et al. [8], who reported a significantly higher frequency of the GA genotype (C282Y heterozygous) in non-responders and found the GG (wild-type) genotype to be predominant among responders, with an OR of 0.033 (95% CI: 0.012–0.094). However, their findings were limited to the C282Y mutation [8] .
Our findings did not reveal a significant direct association between heterozygosity and treatment response, although iron and ferritin levels were significant predictors. This suggests that heterozygosity alone may not confer risk unless accompanied by functional iron overload. The clinical significance of HFE gene heterozygosity, particularly the H63D and C282Y mutations, in CHC continues to be explored. Recent studies indicate that while heterozygosity may lead to mild hepatic iron accumulation, it does not independently cause significant liver injury [11] . However, even modest increases in hepatic iron have been implicated in promoting fibrosis progression and reducing antiviral treatment efficacy in CHC patients [8] . The interplay between genetic variation in iron metabolism and CHC disease severity suggests that screening for HFE mutations might provide valuable prognostic information and inform personalized management strategies.
Similarly, Sini et al. (2012) [12] reported a lower treatment response among CHC patients with HFE mutations and significantly higher transferrin saturation in carriers of the mutant gene. Li et al.’s (2012) meta-analysis found that HFE mutations significantly improved the odds of reaching SVR during interferon-based therapy (OR, 1.56; 95% CI, 1.23–1.97; p < 0.001) [13] .
Further analysis of our study revealed that individuals with mutant HFE alleles had significantly higher mean serum iron levels (105.03 ± 34.87 vs. 91.05 ± 22.31 mcg/dL; p = 0.031) and ferritin levels (median 165 vs. 133 ng/mL; p = 0.044) compared to those with wild-type alleles. TIBC and transferrin saturation were slightly but not significantly different. These findings suggest that HFE mutations may be associated with increased iron stores and altered iron metabolism, potentially contributing to poorer treatment outcomes.
Lastly, a comparison between individuals carrying the C282Y and H63D mutations revealed that those with C282Y had significantly higher median iron levels (109 vs. 77 mcg/dL; p = 0.007), suggesting a more substantial impact of the C282Y mutation on iron overload. Though ferritin levels were higher in C282Y carriers, the difference did not reach statistical significance.
I Mehrez et al. [8] found that transferrin saturation was a sensitive and specific marker for iron overload in their cohort, with significant differences between responders and non-responders (p < 0.001). Whereas ferritin levels did not differ significantly, non-responders had higher levels of serum iron, transferrin, and soluble transferrin receptor, indicating that iron metabolism plays an important role in treatment outcomes [8] .
In contrast to the results of the current study, Abdelazeem et al. (2025) [14] in their study investigated the relationship between HFE gene mutations (C282Y) and treatment outcomes in Egyptian patients with CHC undergoing therapy with pegylated interferon and ribavirin. The results revealed that 38.5% of the patients had C282Y mutations, significantly associated with elevated serum ferritin and transferrin saturation levels, particularly in patients carrying the AA and GA genotypes compared to the GG (wild type) genotype. Importantly, non-response to treatment was strongly linked to the presence of AA and GA genotypes, with an OR of 30.33 (95% CI, 10.68–86.11). These findings highlight that iron overload, associated with C282Y HFE mutations, is a common feature in CHC patients and contributes to reduced treatment efficacy with interferon and ribavirin. This suggests that genetic screening for HFE mutations and monitoring of iron levels may be valuable in predicting and improving treatment outcomes for CHC patients [14] .
Hepatic iron loading in CHC patients has been linked to heterozygous C282Y mutations, according to several investigations. Iron overload appears to reduce the production of T cells and disrupt the function of natural killer and T helper cells, affecting antigen-specific immune responses. Theoretically, iron excess may encourage viral replication and contribute to HCV infection persistence in hemochromatosis patients. One of these variables that has been found to negatively impact the chance of responding to interferon-alfa is the level of hepatic iron; individuals with greater levels of hepatic iron are less likely to benefit from interferon therapy [8,10, 16,17] .
Our analysis initially found that carrying an HFE mutation increased the risk of not responding to antiviral therapy, which is in line with earlier reports connecting genetic variation to hepatitis C treatment outcomes. However, once we factored in iron metabolism and liver function—by using PCA to summarize these complexes, overlapping biochemical markers—the direct link between HFE mutation and treatment outcome disappeared.
Applying PCA was a key step because many of the biochemical variables are closely related and including them all individually in the same analysis could have distorted the results. By condensing them into independent components, PCA allowed us to assess their joint effect on treatment response accurately and to identify possible pathways through which the HFE mutation might influence outcomes. Our findings suggest that the negative effect of the HFE mutation on treatment response is mainly due to its role in promoting iron overload, rather than a direct consequence of the genetic variant itself. These results highlight how both genetics and metabolic changes work together to shape hepatitis C treatment success. They also suggest that monitoring iron levels and liver function could help predict which patients are more likely to benefit from therapy. Future research should investigate whether interventions aimed at reducing iron overload could improve response rates in people with HFE mutations. The model demonstrated excellent discriminative power, with a Nagelkerke R2 of 0.924 and an overall classification accuracy of 93.3%. This suggests that incorporating iron profile parameters could meaningfully enhance the prediction of therapeutic response.
The strengths of the current matched case-control study include its innovative design, as it is the first to investigate the impact of HFE gene mutations (H63D, C282Y, S65C) and iron profiles on SVR in CHC patients treated with DCV and SOF. The study successfully controlled for age and sex through matching, ensuring a well-matched comparison between responders and non-responders.
However, the study has several limitations, including its relatively small sample size, particularly in the C282Y mutation group, which affects the generalizability of some findings. Although we observed significantly higher serum iron levels in the C282Y group, the small number of cases limits the strength and reliability of this observation. Therefore, these results should be interpreted with caution, and validation in larger cohorts is necessary to establish a definitive link between specific HFE mutations and iron overload.
Additionally, while the study identifies trends in HFE mutation associations with treatment response, further research with larger sample sizes is needed to establish more definitive conclusions regarding the role of HFE mutations in treatment efficacy.
However, several limitations must be acknowledged. First, the study’s retrospective design may introduce bias in variable selection and limit causal inference. Second, the relatively small sample size (n = 150) might reduce the stability of multivariate estimates, especially in the presence of multiple predictors. Third, the analysis was based on a single-center dataset, which may limit the generalizability of the findings to broader populations with different demographic or clinical characteristics. Fourth, potential residual confounding from unmeasured variables, such as nutritional status or concomitant treatments, cannot be excluded. Future studies should adopt a prospective design with larger, multi-center cohorts to confirm these associations and explore underlying mechanisms. Additionally, external validation of the model is warranted to assess its robustness and clinical applicability.
An important limitation of our study is the lack of detailed fibrosis or cirrhosis staging data, which could confound the relationship between HFE mutations, iron biomarkers, and treatment response. Advanced fibrosis and cirrhosis are independently associated with both altered iron metabolism and poorer treatment outcomes in CHC [17] . Without accounting for fibrosis stage, the observed associations might partly reflect underlying hepatic architecture rather than a direct genetic or metabolic effect. Future studies should incorporate non-invasive fibrosis assessments (e.g., FibroScan or serum biomarkers) or histological staging to better control for this potential confounder.
In summary, our multivariate analysis suggests that iron overload—captured by a principal component summarizing serum iron, ferritin, and transferrin levels—is a strong independent predictor of non-response to direct-acting antiviral therapy in patients with CHC. Although HFE gene mutation initially appeared significantly associated with treatment non-response in an age- and sex-adjusted model, this association became non-significant after accounting for iron-related metabolic factors. This implies that the effect of HFE mutation on SVR may be mediated through its contribution to iron dysregulation. These findings underscore the potential clinical utility of assessing iron parameters in predicting outcomes of antiviral treatment, providing a practical tool for healthcare professionals. Future large-scale, prospective studies are warranted to validate these findings and clarify the mechanistic pathways involved.
KEY MESSAGE
1. Non-responders exhibited significantly elevated liver enzymes (ALT, AST) and bilirubin levels, alongside lower platelet counts and higher AFP, indicating more severe liver dysfunction compared to responders.
2. HFE gene mutations, especially heterozygous mutant alleles, were more common in non-responders and linked to elevated iron and ferritin levels, indicating a potential role in decreased treatment response.
3. Principal component analysis revealed that iron overload (serum iron, ferritin, and transferrin saturation) is a strong independent predictor of non-response to direct-acting antiviral therapy, highlighting the potential value of assessing iron parameters in therapeutic decision-making.

 PDF Links
 PubReader
 ePub Link
 Full text via DOI
 Download Citation
 Print
Print


