Korean J Intern Med > Epub ahead of print
Kang, Jung, and Kim: A link between systemic low-grade inflammation and frailty in older adults: clinical evidence from a nationwide population-based study

Abstract

Background/Aims

Despite the possible role of systemic low-grade inflammation on frailty, the majority of previous studies have focused solely on the phenotypic frailty with limited participant numbers, thereby weakening the evidence supporting the notion that circulating C-reactive protein (CRP) could be a potential frailty biomarker.

Methods

This study is a nationally representative, population-based, cross-sectional analysis from the Korea National Health and Nutrition Examination Survey, involving 5,359 participants aged 65 and older. We generated a deficit accumulation frailty index (FI) based on 38 items, encompassing physical, cognitive, psychological, and social status. Frailty was classified as non-frail (FI ≤ 0.15), pre-frail (0.15 < FI ≤ 0.25), or frail (FI > 0.25). Serum high-sensitivity CRP (hsCRP) levels were measured by immunoturbidometric method.

Results

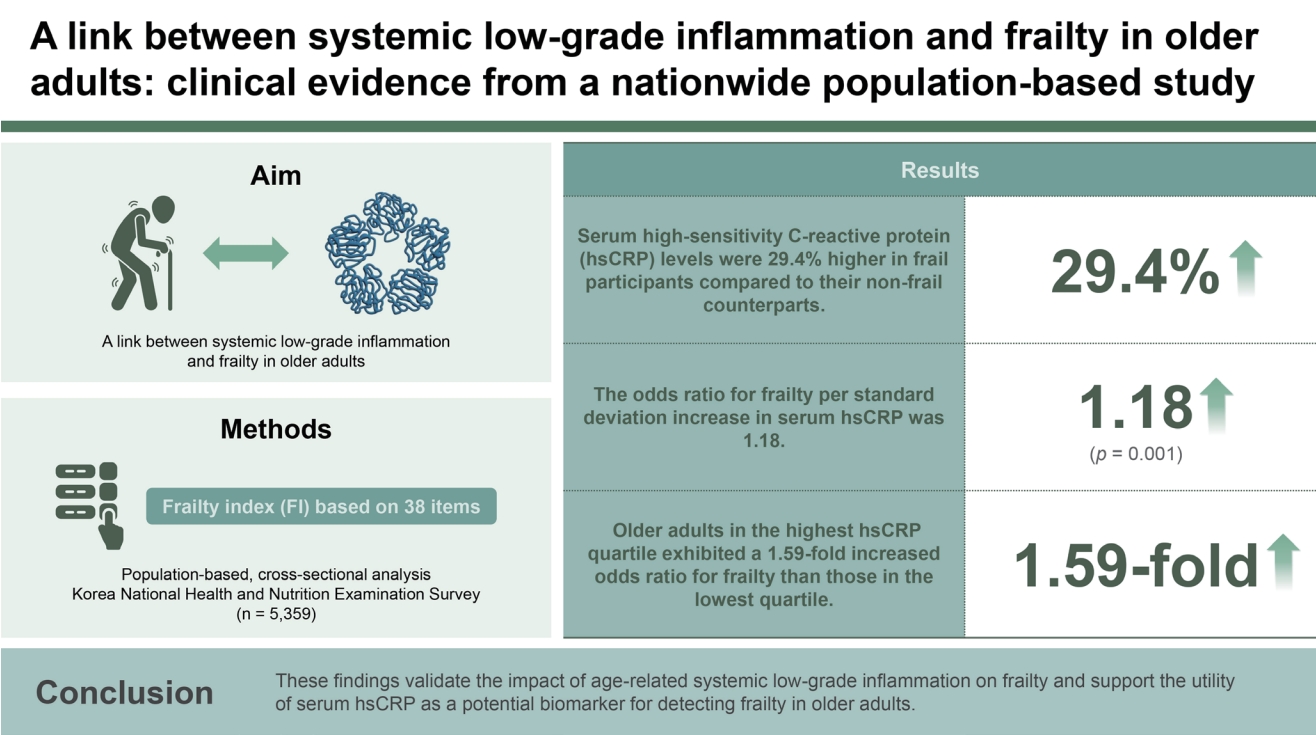
After adjusting for confounders including age, sex, income, education, smoking, hypertension, diabetes, dyslipidemia, stroke, cardiovascular diseases, and body mass index, serum hsCRP levels were 29.4% higher in frail participants compared to their non-frail counterparts (p = 0.001). Additionally, circulating hsCRP concentrations positively correlated with the FI (p = 0.003), and the odds ratio for frailty per standard deviation increase in serum hsCRP was 1.18 (p = 0.001). Moreover, older adults in the highest hsCRP quartile exhibited a significant higher FI with a 1.59-fold increased odds ratio for frailty than those in the lowest quartile (p = 0.002 and 0.001, respectively).

Conclusions

These findings validate the impact of age-related systemic low-grade inflammation on frailty and support the utility of serum hsCRP as a potential biomarker for detecting frailty in older adults.

Graphical abstract

INTRODUCTION

Frailty is characterized by diminished physiological capacity leading to heightened vulnerability to exogenous and endogenous stressors [1]. This geriatric syndrome is not simply a measure of chronological age, but rather serves as an indicator of an individual’s holistic well-being and functional prowess [2]. Given that frailty is a multifaceted condition, its causes are generally complicated and based on the interaction of genetic, biochemical, social, physical, psychological, and environmental factors [3]. Importantly, frailty is a status of declined functional reserve, which consequently elevates the likelihood of adverse health outcomes, including falls, disability, and death [2,4]. Therefore, continuous efforts to identify older adults at high risk of frailty with reliable biomarkers and implement interventions for preventing the development of this condition are essential to enhance quality of life and extend the period of healthy living.
Although there is no definitive gold standard for measurement, the “phenotypic frailty” and the “frailty index” are the most validated and commonly acknowledged tools for assessing frailty [1]. The first concept, also known as the Fried criteria, is centered predominantly on the physical aspects of frailty [5]. It is extensively utilized in most clinical frailty studies due to its efficiency, requiring minimal time and effort for assessment with just five components. However, the frailty index proposed by Rockwood et al. [6,7] is often considered superior to the phenotypic approach due to its comprehensive nature. This index assesses frailty based on a broader range of deficits, including cognitive impairments, psychological issues, and social factors, in addition to physical health problems. Evidence has shown that the frailty index is a better predictor of negative events, such as hospitalization and mortality, compared to the phenotypic frailty model [8,9]. In fact, a recent longitudinal study has revealed that, among nine distinct methodologies evaluated across two decades, the frailty index emerged as the most reliable indicator of biological age. Therefore, it is essential to conduct clinical research related to aging with the frailty index as a primary endpoint, not just relying on the phenotypic frailty.
The concept of “inflammaging” is pivotal in the study of the aging process due to its role in chronic, low-grade inflammation that increases with age. This persistent inflammatory state contributes significantly to the development and progression of various age-related diseases [10,11]. Given this context, several epidemiological studies have been performed to evaluate the role of blood high-sensitivity C-reactive protein (hsCRP), a marker of systemic inflammation, in identifying frailty risk, a fundamental aspect of aging. However, the majority of these studies have focused solely on the phenotypic frailty with limited participant numbers [12,13], thereby weakening the evidence supporting the notion that circulating hsCRP level could be a potential frailty biomarker. Furthermore, no research to date has employed the frailty index in relation to blood hsCRP in nationally representative cohorts. With the aim to resolve these issues, the present study evaluated the relationship between serum hsCRP concentration and the Rockwood frailty index in a general population of community-dwelling older Koreans.

METHODS

Study population

This cross-sectional study was based on data collected between 2015 and 2018 from the Korea National Health and Nutrition Examination Survey (KNHANES). This survey had been regularly carried out since 1998 to assess the health and nutritional status of the nationwide Korean population, to monitor trends in health risk factors and the prevalence of significant chronic diseases, and to provide data for the development and evaluation of health policies and programs in Korea [14]. KNHANES is a nationally representative survey that employs a complex, multi-stage probability sample design to represent the entire non-institutionalized population of Korea. Annually, the survey utilizes a three-stage sample design. In the first stage, primary sample units (PSUs) are selected from census blocks or resident registration addresses, each comprising approximately 50 to 60 households. In the second stage, 20 to 25 households are selected for the survey from each PSU through field surveys. In the final stage, all individuals aged 1 year and above residing in the selected households are included in the survey [15].
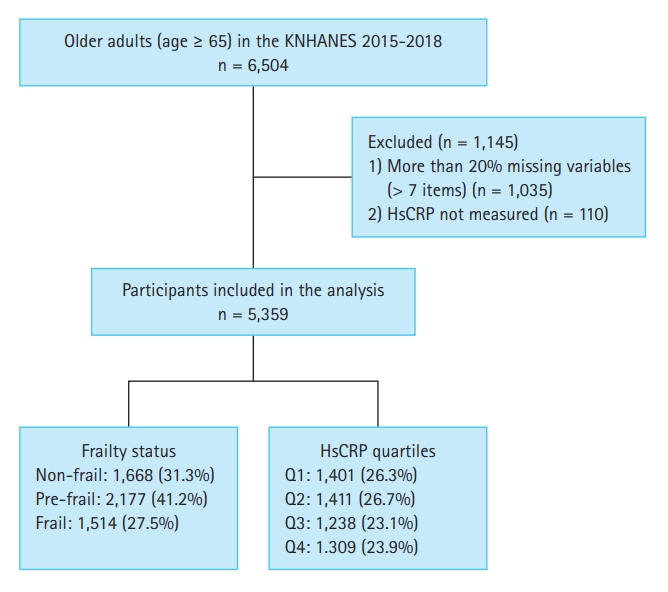
A total of 6,504 older individuals (aged ≥ 65 yr) participated in KNHANES during the study period. We included 5,359 participants in the study after excluding 1,145 participants who lacked more than 20% (over seven items) of the variables used to measure frailty [16] and 110 participants with missing hsCRP data (Fig. 1). All participants provided written informed consent prior to participating in KNHANES. Personal data from the survey were de-identified before being made publicly available. This study was approved by the Institutional Review Board (IRB) of Chonnam National University Bitgoeul Hospital, and the requirement for informed consent was waived (IRB No. CNUBH-2023-018). The study adhered to the principles outlined in the Declaration of Helsinki.

Serum hsCRP concentration measurement

Blood samples, including serum hsCRP levels, were obtained from participants aged ≥ 10 years, with their consent. In the morning, following a minimum of an 8-hour overnight fasting period, blood samples were collected from the antecubital vein of each participant. The collected samples were immediately refrigerated and then transported to the Central Testing Institute (Neodin Medical, Inc., Seoul, Korea). Within 24 hours of transportation, the serum hsCRP concentration was measured using immunoturbidimetry with a Cobas bio-centrifugal analyzer (Roche, Mannheim, Germany). The analysis kit employed had a lower detection limit for serum hsCRP of < 0.100 mg/L, and the coefficient of variation was less than 5%.

Frailty-related factors evaluation

Blood pressure measurements were taken on the right arm by trained nurses using a mercury sphygmomanometer (Baumanometer® Wall Unit 33[0850]; W.A.Baum, Copiague, NY, USA) with an appropriately sized cuff. Participants were required to remain still in a seated position for at least 5 minutes before the measurement. Blood pressure was measured three times. The final systolic and diastolic blood pressure values were determined by averaging the second and third measurements. Blood samples were collected from the participants during the survey. Body mass index (BMI) was calculated by dividing body weight in kilograms (kg) by the square of height in meters (m2). Household income, education level, and lifestyle factors were obtained through a self-reported questionnaire. Household income was categorized into four quartiles based on monthly income. The low-income quartile included households with a monthly income of less than 680 US dollars. The mid-low-income quartile comprised households earning 680 US dollars or more, but less than 1,360 US dollars per month. The mid-high-income quartile was for households earning 1,360 US dollars or more, but less than 2,230 US dollars per month. Finally, the high-income quartile consisted of households with a monthly income of 2,230 US dollars or more. Regarding the level of education, it was classified into four categories. The first category included individuals with an elementary school education or lower. The second category was for those who had completed middle school. The third category encompassed individuals who had completed high school, and the fourth category was for those with a college education or higher. Smokers were identified as individuals who had smoked five or more packs of cigarettes in their lifetime and who were currently smoking. Regarding medical conditions, participants were categorized as having a specific disease if they had a doctor’s diagnosis.

Frailty index

The frailty index in our study was developed based on a standard procedure for creating such an index [17] and by referencing previous frailty indices that utilized data from KNHANES [18-20]. This index yields a continuous score that ranges from 0 (indicating the best condition) to 1 (representing the worst condition) [9].
Our frailty index comprised 38 items commonly surveyed between 2015 and 2018 in KNHANES. These items encompassed various aspects such as comorbidities, functional abilities, signs and symptoms, and laboratory test values. Included comorbidities in the index were anemia, arthritis, bronchial asthma, cancer, cardiovascular disease, cataract, chronic obstructive pulmonary disease, depression, diabetes, dyslipidemia, hypertension, and stroke. Functional abilities were assessed through items such as inactivity, low exercise capacity, activities of daily living limitations, social activity limitations, self-care inability, hearing impairment, and chewing difficulty. Signs and symptoms included items like pain or discomfort, weight loss, depression or anxiety, suicidal ideation, and stress. Laboratory values such as systolic blood pressure, diastolic blood pressure, heart rate regularity, pulmonary function test, hemoglobin, blood urea nitrogen, creatinine, total cholesterol, triglyceride, high-density lipoprotein cholesterol, fasting glucose, and urine protein were also used to calculate the index. Additional items included current smoking status and BMI (Supplementary Table 1). Based on criteria from previous studies [21-23], participants were classified into three categories: non-frail (frailty index ≤ 0.15), pre-frail (0.15 < frailty index ≤ 0.25), and frail (frailty index > 0.25).

Statistical analysis

In this study, a complex sample analysis method with assigned weights was used to obtain national-level statistical estimates. We conducted a pooled analysis of the annual surveys, with each year’s survey sample being independent of the others. Data were presented as means with standard errors (SEs) or counts with percentages, unless otherwise specified. For the baseline characteristics of study participants, continuous variables were compared using general linear model analysis, and categorical variables using cross-tabulation analysis. Potential confounders, selected for their clinical relevance and/or statistical significance in univariate analyses, included age, sex, income, education level, current smoking status, hypertension, diabetes, dyslipidemia, stroke, cardiovascular diseases, and BMI. To test the hypothesis that higher serum hsCRP levels are associated with a higher Rockwood frailty index, we conducted linear regression analysis using the frailty index as the dependent variable and serum hsCRP level as the independent variable. The risk of pre-frailty and frailty in relation to serum hsCRP levels or serum hsCRP quartiles was explored through multiple logistic regression analyses. Finally, differences in the frailty index according to serum hsCRP quartiles were also assessed using a general linear model. All statistical analyses were two-tailed, with statistical significance set at p < 0.05, and were conducted using SPSS version 21.0 (IBM Corp., Armonk, NY, USA).

RESULTS

Table 1 displays the baseline characteristics of 5,359 study participants aged 65 and older. Among these participants, 1,668 (31.3%) were non-frail, 2,177 (41.2%) were pre-frail, and 1,514 (27.5%) were frail older adults. Of these groups, 895 (52.8%) non-frail, 937 (42.4%) pre-frail, and 536 (33.9%) frail participants were men (p < 0.001). The mean ages of the non-frail, pre-frail, and frail groups were 70.9, 72.9, and 74.3 years, respectively, indicating a statistically significant difference (p < 0.001). With the progression from non-frail to pre-frail, and then to frail, there was an observed trend of lower income, less education, more smokers, and a higher prevalence of hypertension, diabetes, dyslipidemia, stroke, and cardiovascular diseases, as well as a higher BMI (all p <0.001).
Differences in serum hsCRP concentrations according to frailty status were assessed using a general linear model in a complex sample analysis method (Fig. 2). Before adjusting for confounders, there was a linear increase in hsCRP levels as severity progressed from non-frail to pre-frail to frail (p for trend < 0.001), with frail older adults exhibiting 30.0% higher serum hsCRP levels than non-frail participants (p <0.001). Moreover, these differences remained significant after adjusting for age and sex (p = 0.001), as well as for additional factors including income, education level, smoking, hypertension, diabetes, dyslipidemia, stroke, cardiovascular diseases, and BMI (p = 0.001).
Linear regression analyses were conducted to determine whether serum hsCRP levels were independently associated with the Rockwood frailty index (Table 2). Before and after considering for potential confounders, higher serum hsCRP levels were consistently correlated with a higher frailty index (p < 0.001 to 0.003).
The risk of pre-frailty and frailty in relation to serum hsCRP levels was explored through multiple logistic regression analyses, as detailed in Table 3. The odds ratios (ORs) for pre-frailty according to serum hsCRP levels were not statistically significant in any of the adjustment models. However, before adjusting for confounding variables, the OR for frailty per standard deviation increase in serum hsCRP level was found to be 1.17 (p = 0.001). Moreover, this elevated risk of frailty associated with increased serum hsCRP levels persisted as significant in both age- and sex-adjusted models, as well as in multivariable adjusted models (p = 0.003 and 0.001, respectively).
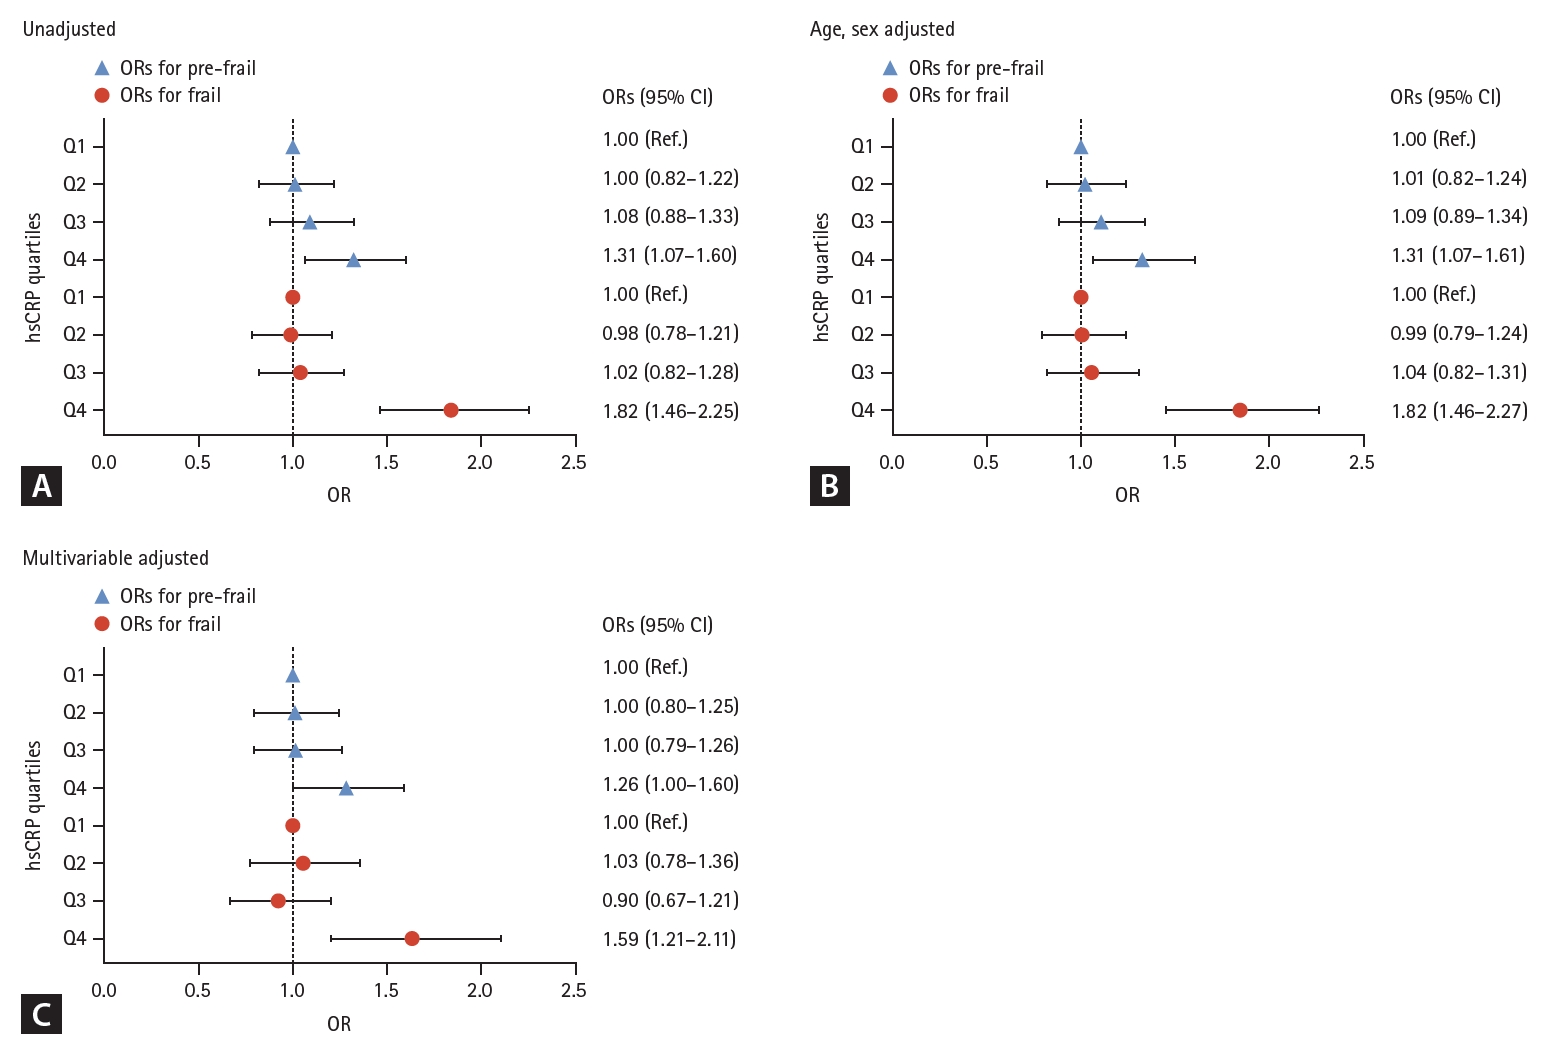
To identify whether the association between serum hsCRP level and the Rockwood frailty index involved a threshold effect, we divided the study participants into four groups according to their serum hsCRP concentrations (Fig. 3). Participants in the highest hsCRP quartile (Q4, > 1.4 mg/L) exhibited a significant higher frailty index than those in the lowest quartile (Q1, ≤ 0.4 mg/L), irrespective of the adjustment model used (p < 0.001 to 0.002). Additionally, logistic regression analyses of the unadjusted model indicated that older adults in Q4 had 1.31-fold and 1.82-fold higher ORs for pre-frailty and frailty, respectively, compared to those in Q1 (p = 0.010 and p < 0.001, respectively). The elevated ORs for pre-frailty and frailty in the Q4 group remained statistically significant even after adjusting for potential confounders, such as age, sex, income, education level, smoking status, hypertension, diabetes, dyslipidemia, stroke, cardiovascular diseases, and BMI (p = 0.001 to 0.048) (Fig. 4).

DISCUSSION

CRP, mainly synthesized in the liver, belongs to the pentraxin family, a group of proteins essential for innate immune recognition, and is acknowledged as a dependable indicator of systemic inflammation [24]. The advent of sensitive immunoassays for hsCRP has enabled the detection and quantification of exceptionally low concentrations of CRP in the bloodstream. In this study, conducted in a general population of community-dwelling older adults, serum hsCRP levels were observed to be markedly higher in frail participants compared to their non-frail counterparts, before and after adjusting for potential confounders. Furthermore, elevated hsCRP concentrations in the blood were correlated with an increased Rockwood frailty index, as well as a significantly heightened risk of developing frailty. The significance of this paper lies in its provision of clinical evidence linking systemic low-grade inflammation to frailty, underscored by its use of nationally representative data. Additionally, it contributes further evidence supporting the utility of serum hsCRP as a potential biomarker for detecting frailty in older adults.
While both the phenotype model and the cumulative deficit model are acknowledged as reliable in predicting the natural history and response to therapeutic interventions [2], the Rockwood frailty index presents several advantages over phenotypic frailty. In detail, it principally provides a more comprehensive assessment of frailty by incorporating a broader range of health deficits, thus offering a holistic view of an individual’s health status [6,7]. Unlike the categorical, phenotypic model which assesses frailty based on only five physical criteria [5], the frailty index is a continuous variable capable of capturing the gradual and multidimensional nature of frailty. This gradation is particularly valuable as it enables the sensitive detection of early and minor changes in health status, thereby enhancing its effectiveness in predicting various adverse health outcomes, such as hospitalization and mortality [6,8,9]. Importantly, the KNHANES, which gathers representative and objective data from the public to inform national health policies, offers an extensive range of health information [14]. This includes comorbidities, cognitive impairments, and psychosocial factors, essential for constructing the Rockwood frailty index. Consequently, KNHANES can be considered an optimal large-scale, nationwide cohort for conducting clinical research on frailty, a field gaining significance in a rapidly aging society [20].
Among the mechanisms contributing to frailty are age-related changes in the immune system, commonly referred to as “inflammaging”. Inflammaging is characterized by a chronic, low-grade inflammatory state, persisting even in the absence of overt infection [25]. The connection between inflammaging and frailty can be elucidated through several pathways. Firstly, chronic inflammation can directly impair muscle metabolism, leading to sarcopenia, a cardinal manifestation of frailty. Increased pro-inflammatory cytokines disrupt protein synthesis and degradation, enhance the expression of muscle wasting regulators, and interfere with hormones essential for muscle growth and differentiation, leading to muscle catabolism [26-28]. Furthermore, these cytokines may cause contractile dysfunction in muscles, contributing to weakened strength independent of protein loss [29]. Secondly, this inflammatory state exacerbates the decline in immune function, known as “immunosenescence”, rendering the elderly more susceptible to infections and other health complications that further contribute to frailty [30]. In addition, inflammaging is associated with other age-related conditions, including cardiovascular diseases and type 2 diabetes, further compounding the factors that lead to frailty [31]. This interaction creates a vicious cycle where inflammaging promotes diseases, and these diseases, in turn, exacerbate inflammation.
One of the key aspects of inflammaging involves elevated levels of certain inflammatory markers in the blood, notably interleukin-6 (IL-6), tumor necrosis factor-alpha (TNF-α), and CRP. Among these, CRP is particularly noteworthy for its ease of measurement, high precision, and established clinical value, making it a widely recognized marker of systemic inflammation. As such, numerous studies have investigated the role of CRP as a biomarker for early detection of high-risk groups for frailty, and several studies have shown a significant link between elevated CRP levels and frailty in older adults [32-35]. However, recent meta-analyses have pointed out the lack of consistency in frailty identification criteria, with most relying on the Fried model, which predominantly considers physical aspects [12,36]. This approach has limited the establishment of a robust correlation between frailty, a comprehensive measure of an individual’s well-being and functional capacity, and CRP. Therefore, there is an ongoing need for research employing a more comprehensive definition of frailty to substantiate this relationship. Our study enhances existing phenotype model results by utilizing reliable national data to measure a frailty index accounting for the cumulative effect of medical, functional, and psychosocial age-related deficits, providing strong clinical evidence of an association between systemic low-grade inflammation and frailty.
Our study’s primary advantage lies in employing complex sample analysis methods with assigned weights, enabling the estimation of national-level statistics and thereby improving the generalizability of our findings. Additionally, the substantial sample size facilitated adjustments for a range of confounding factors, thereby enhancing the statistical robustness of our results. However, it’s important to acknowledge certain limitations that should be taken into account when interpreting our data. A key limitation of our study is its cross-sectional design, which precludes establishing a causal relationship between serum hsCRP levels and frailty. Additionally, the KNHANES dataset lacks data on other inflammatory markers like TNF-α or IL-6, hindering our ability to compare the strength of the correlation between circulating CRP concentration and frailty against these markers. Another concern is that our study relies on self-reported data, potentially introducing recall and social desirability biases. Next, since our study exclusively involved a Korean population, the applicability of our findings to other demographic groups, particularly Caucasians, remains uncertain. Lastly, although we have endeavored to control for as many confounding factors as possible in our analysis, we acknowledge that the association observed may still be influenced by factors not accounted for, which could affect circulating hsCRP levels.
In conclusion, data from a nationally representative cohort reveal that higher circulating hsCRP levels are significantly associated with an increased frailty index, encompassing physical, cognitive, psychological, and social dimensions, and a heightened risk of frailty in older adults. These findings clinically validate the impact of age-related systemic low-grade inflammation on frailty. To establish the role of baseline serum CRP concentration as a predictive biomarker for the development or exacerbation of frailty, further investigation through large-scale longitudinal studies is necessary.

KEY MESSAGE

1. Higher circulating hsCRP levels were significantly associated with an increased frailty index in Korean older adults.
2. The OR for frailty increased significantly as serum hsCRP increased in Korean older adults.
3. These findings validate the impact of age-related systemic low-grade inflammation on frailty and support the utility of serum hsCRP as a potential biomarker for detecting frailty in older adults.

Supplementary Information

Notes

CRedit authorship contributions
Min-gu Kang: conceptualization, methodology, investigation, data curation, writing - original draft, writing - review & editing, project administration; Hee-Won Jung: conceptualization, methodology, investigation, writing - review & editing, supervision; Beom-Jun Kim: conceptualization, methodology, investigation, writing - original draft, writing - review & editing, supervision, project administration
Conflicts of interest
Hee-Won Jung cofounded Dyphi Inc, a startup company developing sensor technologies for human movement and robotics, but he made no influence on this work in relation with the company or its products. Other authors have no potential conflicts of interest to disclose.
Funding
This study was supported by grants from the Korean Association of Internal Medicine for Research Award 2023 and the Asan Institute for Life Science, Asan Medical Center, Seoul, South Korea (grant number: 2023IP0024).

Figure 1.
Flow diagram of the study participants. KNHANES, Korea National Health and Nutrition Examination Survey; hsCRP, high-sensitivity C-reactive protein; Q, quartile. hsCRP quartiles: Q1, serum hsCRP ≤ 0.4 (mg/L); Q2, 0.4 < serum hsCRP ≤ 0.7; Q3, 0.7 < serum hsCRP ≤ 1.4; Q4, serum hsCRP > 1.4.
kjim-2024-050f1.jpg
Figure 2.
Differences in serum hsCRP levels according to the frailty status. (A) unadjusted, (B) age and sex adjusted, and (C) multivariable (age, sex, income, level of education, smoking, hypertension, diabetes, dyslipidemia, stroke, cardiovascular diseases, and body mass index) adjusted. The estimated means with 95% confidence intervals were generated and compared using general linear model analysis in a complex sample analysis method. Asterisk indicates statistically significant difference from the non-frail group. hsCRP, high-sensitivity C-reactive protein.
kjim-2024-050f2.jpg
Figure 3.
Differences in frailty index according to serum hsCRP quartiles. (A) unadjusted, (B) age and sex adjusted, and (C) multivariable (age, sex, income, level of education, smoking, hypertension, diabetes, dyslipidemia, stroke, cardiovascular diseases, and body mass index) adjusted. The estimated means with 95% confidence intervals were generated and compared using general linear model analysis in a complex sample analysis method. Asterisk indicates statistically significant difference from the Q1 (lowest quartile). hsCRP, high-sensitivity C-reactive protein; Q, quartile. hsCRP quartiles: Q1, serum hsCRP ≤ 0.4 (mg/L); Q2, 0.4 < serum hsCRP ≤ 0.7; Q3, 0.7 < serum hsCRP ≤ 1.4; Q4, serum hsCRP > 1.4.
kjim-2024-050f3.jpg
Figure 4.
Logistic regression analyses to determine the ORs for pre-frail and frail status according to serum hsCRP quartiles. (A) unadjusted, (B) age and sex adjusted, and (C) multivariable (age, sex, income quartile, level of education, smoking, hypertension, diabetes, dyslipidemia, stroke, cardiovascular diseases, and body mass index) adjusted. OR, odds ratio; CI, confidence interval; Q, quartile; hsCRP, high-sensitivity C-reactive protein. hsCRP quartiles: Q1, serum hsCRP ≤ 0.4 (mg/L); Q2, 0.4 < serum hsCRP ≤ 0.7; Q3, 0.7 < serum hsCRP ≤ 1.4; Q4, serum hsCRP > 1.4.
kjim-2024-050f4.jpg
kjim-2024-050f5.jpg
Table 1.
Baseline characteristics of the study participants according to frailty status
Variable Non-frail (n = 1,668) Pre-frail (n = 2,177) Frail (n = 1,514) p value
Age (yr) 70.9 ± 0.2 72.9 ± 0.2 74.3 ± 0.2 < 0.001
Sex (male) 895 (52.8) 937 (42.4) 536 (33.9) < 0.001
Income quartile (low/mid-low/mid-high/high) (%) 36.2/30.4/18.5/14.9 45.0/26.7/17.3/11.0 59.8/22.7/11.5/6.0 < 0.001
Level of education (1st/2nd/3rd/4th) (%) 44.8/17.3/21.9/15.9 59.0/14.2/17.3/9.5 71.9/11.9/11.7/4.5 < 0.001
Smoking 87 (5.2) 223 (10.7) 192 (12.0) < 0.001
Hypertension 771 (46.3) 1,445 (65.7) 1,191 (80.2) < 0.001
Diabetes 181 (10.7) 564 (26.4) 573 (39.8) < 0.001
Dyslipidemia 345 (21.3) 729 (34.9) 651 (44.0) < 0.001
Stroke 30 (2.2) 100 (5.1) 189 (12.4) < 0.001
Cardiovascular diseases (MI, angina) 50 (2.6) 155 (7.1) 231 (14.1) < 0.001
BMI (kg/m2) 23.6 ± 0.1 24.3 ± 0.1 24.9 ± 0.1 < 0.001

Values are presented as mean ± standard error or number (%).

MI, myocardial infarction; BMI, body mass index.

Continuous and categorial variables were compared using general linear model and crosstabs analyses in a complex sample analysis method, respectively.

Statistical significance set at p < 0.05.

Table 2.
Multiple linear regression analysis to determine whether serum hsCRP level is independently associated with Frailty index
Adjustment Dependent variable: frailty index
β SE p value
Unadjusted 0.003 0.001 < 0.001
Age and sex 0.002 0.001 0.001
Multivariable 0.002 0.001 0.003

hsCRP, high-sensitivity C-reactive protein; β, regression coefficient; SE, standard error.

General linear model analysis was performed with frailty index as a dependent variable, and with serum hsCRP level (mg/L) as an independent variable.

Multivariable adjustment model includes age, sex, income, level of education, smoking, hypertension, diabetes, dyslipidemia, stroke, cardiovascular diseases, and body mass index as confounding factors.

Statistical significance set at p < 0.05.

Table 3.
Logistic regression analyses to determine the odds ratios for pre-frail and frail status according to serum hsCRP level
Adjustment Pre-frail
Frail
Odds ratioa) (95% CI) p value Odds ratioa) (95% CI) p value
Unadjusted 1.06 (0.96–1.16) 0.246 1.17 (1.07–1.29) 0.001
Age and sex 1.05 (0.96–1.15) 0.310 1.16 (1.05–1.28) 0.003
Multivariable 1.08 (0.98–1.18) 0.109 1.18 (1.07–1.31) 0.001

hsCRP, high-sensitivity C-reactive protein; CI, confidence interval.

a) Per standard deviation increment in serum hsCRP level (2.48 mg/L).

Multivariable adjustment model includes age, sex, income, level of education, smoking, hypertension, diabetes, dyslipidemia, stroke, cardiovascular diseases, body mass index as confounding factors.

Statistical significance set at p < 0.05.

REFERENCES

1. Lee H, Lee E, Jang IY. Frailty and comprehensive geriatric assessment. J Korean Med Sci 2020;35:e16.
crossref pdf
2. Clegg A, Young J, Iliffe S, Rikkert MO, Rockwood K. Frailty in elderly people. Lancet 2013;381:752–762.
crossref pmid
3. Won CW. Frailty: Its scope and implications for geriatricians. Ann Geriatr Med Res 2019;23:95–97.
crossref pmid pmc pdf
4. Vermeiren S, Vella-Azzopardi R, Beckwée D, et al. Frailty and the prediction of negative health outcomes: a meta-analysis. J Am Med Dir Assoc 2016;17:1163.e1–1163.e17.
crossref
5. Fried LP, Tangen CM, Walston J, et al. Frailty in older adults: evidence for a phenotype. J Gerontol A Biol Sci Med Sci 2001;56:M146–M156.
crossref pmid
6. Rockwood K, Mitnitski A. Frailty in relation to the accumulation of deficits. J Gerontol A Biol Sci Med Sci 2007;62:722–727.
crossref pmid
7. Rockwood K, Song X, MacKnight C, et al. A global clinical measure of fitness and frailty in elderly people. CMAJ 2005;173:489–495.
crossref pmid
8. Theou O, Brothers TD, Mitnitski A, Rockwood K. Operationalization of frailty using eight commonly used scales and comparison of their ability to predict all-cause mortality. J Am Geriatr Soc 2013;61:1537–1551.
crossref pmid pdf
9. Blodgett J, Theou O, Kirkland S, Andreou P, Rockwood K. Frailty in NHANES: comparing the frailty index and phenotype. Arch Gerontol Geriatr 2015;60:464–470.
crossref pmid
10. Franceschi C, Garagnani P, Parini P, Giuliani C, Santoro A. Inflammaging: a new immune-metabolic viewpoint for age-related diseases. Nat Rev Endocrinol 2018;14:576–590.
crossref pmid pdf
11. Santoro A, Bientinesi E, Monti D. Immunosenescence and inflammaging in the aging process: age-related diseases or longevity? Ageing Res Rev 2021;71:101422.
crossref
12. Marcos-Pérez D, Sánchez-Flores M, Proietti S, et al. Association of inflammatory mediators with frailty status in older adults: results from a systematic review and meta-analysis. Geroscience 2020;42:1451–1473.
crossref pmid pmc pdf
13. Tran Van Hoi E, De Glas NA, Portielje JEA, et al. Biomarkers of the ageing immune system and their association with frailty - a systematic review. Exp Gerontol 2023;176:112163.
crossref pmid
14. Kweon S, Kim Y, Jang MJ, et al. Data resource profile: the Korea National Health and Nutrition Examination Survey (KNHANES). Int J Epidemiol 2014;43:69–77.
crossref pmid
15. Kim Y. The Korea National Health and Nutrition Examination Survey (KNHANES): current status and challenges. Epidemiol Health 2014;36:e2014002.
crossref pmid pmc
16. Hoogendijk EO, Stolz E, Oude Voshaar RC, Deeg DJH, Huisman M, Jeuring HW. Trends in frailty and its association with mortality: results from the longitudinal aging study Amsterdam, 1995-2016. Am J Epidemiol 2021;190:1316–1323.
crossref pmid pmc pdf
17. Searle SD, Mitnitski A, Gahbauer EA, Gill TM, Rockwood K. A standard procedure for creating a frailty index. BMC Geriatr 2008;8:24.
crossref pmid pmc pdf
18. Kang MG, Kim SW, Yoon SJ, Choi JY, Kim KI, Kim CH. Association between frailty and hypertension prevalence, treatment, and control in the elderly Korean population. Sci Rep 2017;7:7542.
crossref pmid pmc pdf
19. Kang MG, Jung HW. Association between oral health and frailty in older Korean population: a cross-sectional study. Clin Interv Aging 2022;17:1863–1872.
crossref pmid pmc pdf
20. Kang MG, Kim OS, Hoogendijk EO, Jung HW. Trends in frailty prevalence among older adults in Korea: a nationwide study from 2008 to 2020. J Korean Med Sci 2023;38:e157.
crossref pmid pmc pdf
21. Won CW, Lee Y, Lee S, Kim M. Development of Korean Frailty Index for Primary Care (KFI-PC) and its criterion validity. Ann Geriatr Med Res 2020;24:125–138.
crossref pmid pmc pdf
22. Kim DH, Glynn RJ, Avorn J, et al. Validation of a claims-based frailty index against physical performance and adverse health outcomes in the health and retirement study. J Gerontol A Biol Sci Med Sci 2019;74:1271–1276.
crossref pmid
23. Hubbard RE, Goodwin VA, Llewellyn DJ, Warmoth K, Lang IA. Frailty, financial resources and subjective well-being in later life. Arch Gerontol Geriatr 2014;58:364–369.
crossref pmid
24. Pepys MB, Baltz ML. Acute phase proteins with special reference to C-reactive protein and related proteins (pentaxins) and serum amyloid A protein. Adv Immunol 1983;34:141–212.
crossref pmid
25. Franceschi C, Capri M, Monti D, et al. Inflammaging and anti-inflammaging: a systemic perspective on aging and longevity emerged from studies in humans. Mech Ageing Dev 2007;128:92–105.
crossref pmid
26. Budui SL, Rossi AP, Zamboni M. The pathogenetic bases of sarcopenia. Clin Cases Miner Bone Metab 2015;12:22–26.
crossref pmid pmc
27. Frost RA, Lang CH. Protein kinase B/Akt: a nexus of growth factor and cytokine signaling in determining muscle mass. J Appl Physiol (1985) 2007;103:378–387.
crossref pmid
28. Lang CH, Frost RA, Vary TC. Regulation of muscle protein synthesis during sepsis and inflammation. Am J Physiol Endocrinol Metab 2007;293:E453–E459.
crossref pmid
29. Li X, Moody MR, Engel D, et al. Cardiac-specific overexpression of tumor necrosis factor-alpha causes oxidative stress and contractile dysfunction in mouse diaphragm. Circulation 2000;102:1690–1696.
crossref pmid
30. Jia H, Huang W, Liu C, et al. Immunosenescence is a therapeutic target for frailty in older adults: a narrative review. Ann Transl Med 2022;10:1142.
crossref pmid pmc
31. Ferrucci L, Fabbri E. Inflammageing: chronic inflammation in ageing, cardiovascular disease, and frailty. Nat Rev Cardiol 2018;15:505–522.
crossref pmid pmc pdf
32. Barzilay JI, Blaum C, Moore T, et al. Insulin resistance and inflammation as precursors of frailty: the cardiovascular health study. Arch Intern Med 2007;167:635–641.
crossref pmid
33. Blaum CS, Xue QL, Michelon E, Semba RD, Fried LP. The association between obesity and the frailty syndrome in older women: the women’s health and aging studies. J Am Geriatr Soc 2005;53:927–934.
crossref pmid
34. Collerton J, Martin-Ruiz C, Davies K, et al. Frailty and the role of inflammation, immunosenescence and cellular ageing in the very old: cross-sectional findings from the Newcastle 85+ study. Mech Ageing Dev 2012;133:456–466.
crossref pmid
35. Hwang AC, Liu LK, Lee WJ, et al. Association of frailty and cardiometabolic risk among community-dwelling middle-aged and older people: results from the I-Lan longitudinal aging study. Rejuvenation Res 2015;18:564–572.
crossref pmid
36. Soysal P, Stubbs B, Lucato P, et al. Inflammation and frailty in the elderly: a systematic review and meta-analysis. Ageing Res Rev 2016;31:1–8.
crossref pmid

Editorial Office
101-2501, Lotte Castle President, 109 Mapo-daero, Mapo-gu, Seoul 04146, Korea
Tel: +82-2-2271-6792    Fax: +82-2-790-0993    E-mail: kaim@kams.or.kr                

Copyright © 2024 by Korean Association of Internal Medicine.

Close layer
prev next