


INTRODUCTION
Statins, also known as hydroxymethylglutaryl reductase inhibitors, are commonly prescribed lipid-lowering agents to treat dyslipidemia in Korea [1,2]. Besides statinsŌĆÖ lipid-lowering effects, they are therapeutic agents that help prevent the side effects of arteriosclerotic diseases, including stroke and myocardial infarction [3]. Statins also have anti-inflammatory [4,5], antithrombotic [6,7], and immunomodulatory activities [8,9] and can improve endothelial function [10,11]. Despite these benefits, statins increase serum creatinine phosphokinase (CPK) levels, leading to myopathy and in severe cases, rhabdomyolysis [12,13]. High-dose statins may increase the risk of myopathy, especially in patients with comorbidities or in the presence of interacting medications, such as diltiazem [14]. Statins should be discontinued if an elevated CPK level is found or myopathy is suspected [15].
Most studies on thyroid function and CPK changes after statin administration have investigated patients with prevalent thyroid dysfunction. Hypothyroidism is related to CPK elevation after statin administration [16], and CPK elevation in statin-administered patients is correlated with hypothyroidism [17,18]. Although most statin users are euthyroid, to the best of our knowledge, no study has examined the effect of statins on CPK elevation in patients with normal thyroid-stimulating hormone (TSH) levels.
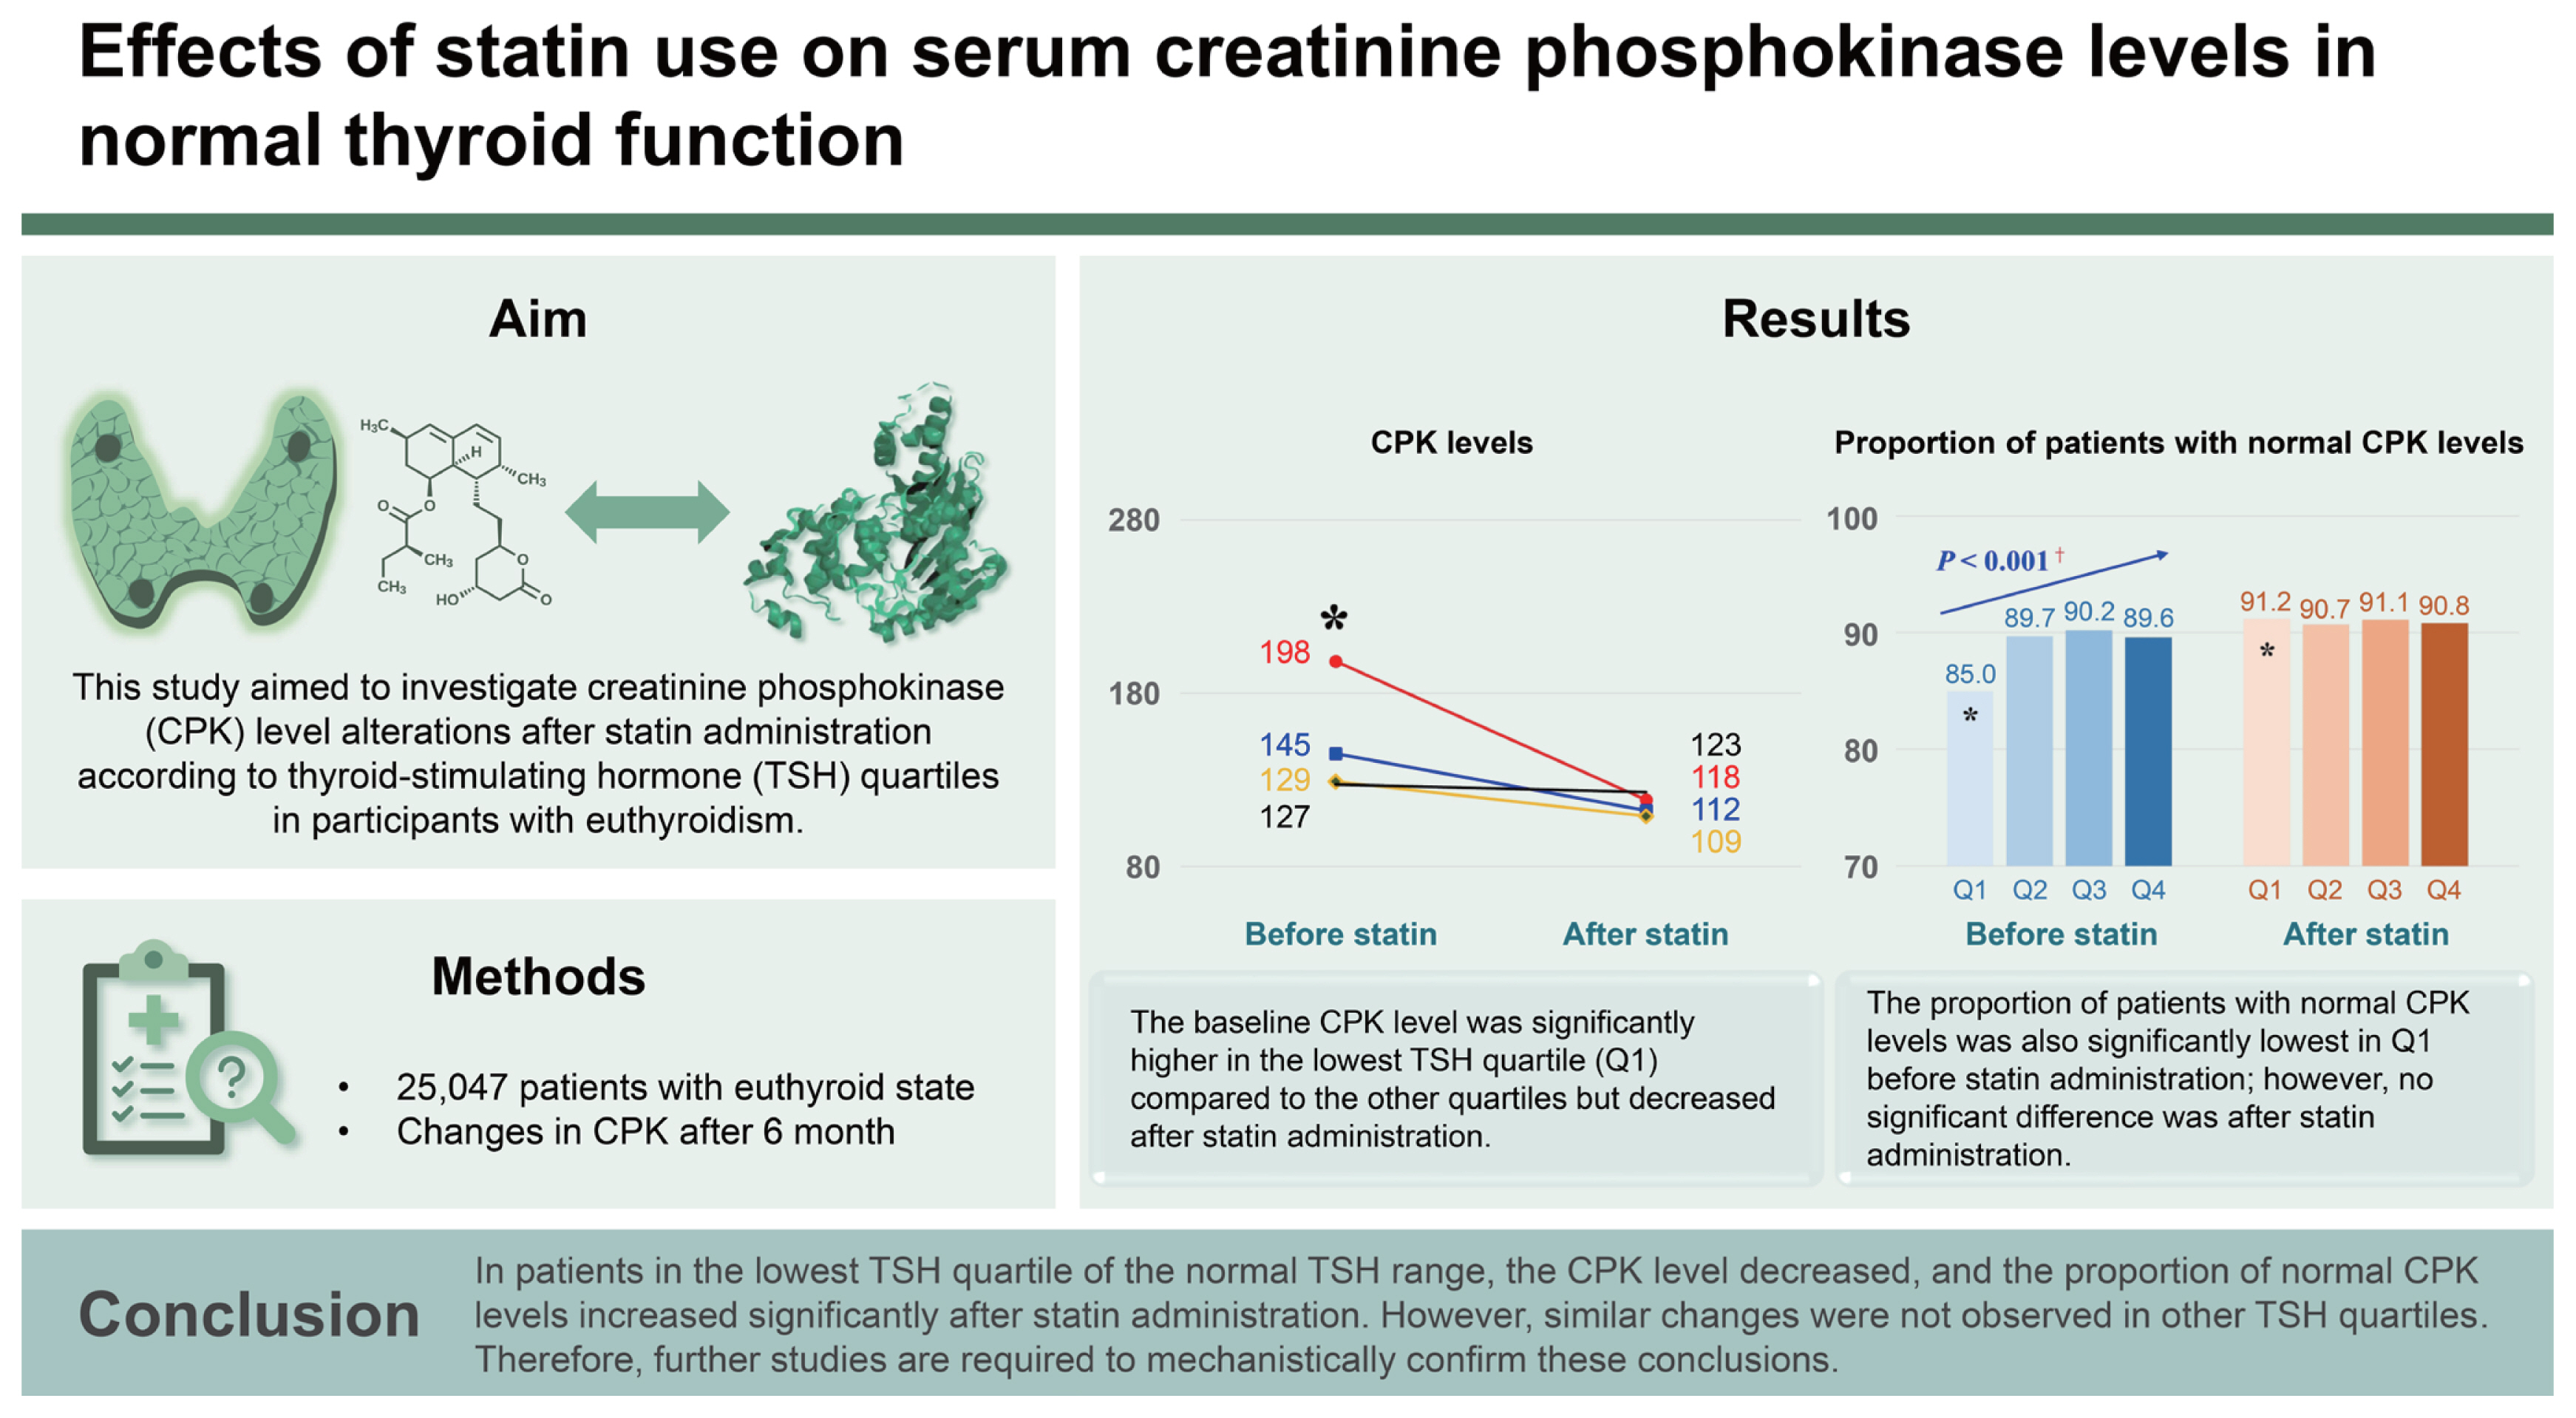
Therefore, this study primarily aimed to investigate the changes in CPK levels after statin administration according to TSH quartiles in participants with euthyroidism and to explore these changes according to statin intensity. Clinically, the changes in CPK level according to TSH level are crucial; therefore, we determined the clinical significance of this parameter. This study secondarily aimed to identify the ŌĆ£proportion of normal CPKŌĆØ or ŌĆ£proportion of abnormal CPK.ŌĆØ Although these two analyses do not appear to be related, we believe that they should be performed concurrently in clinical settings.
METHODS
Study population
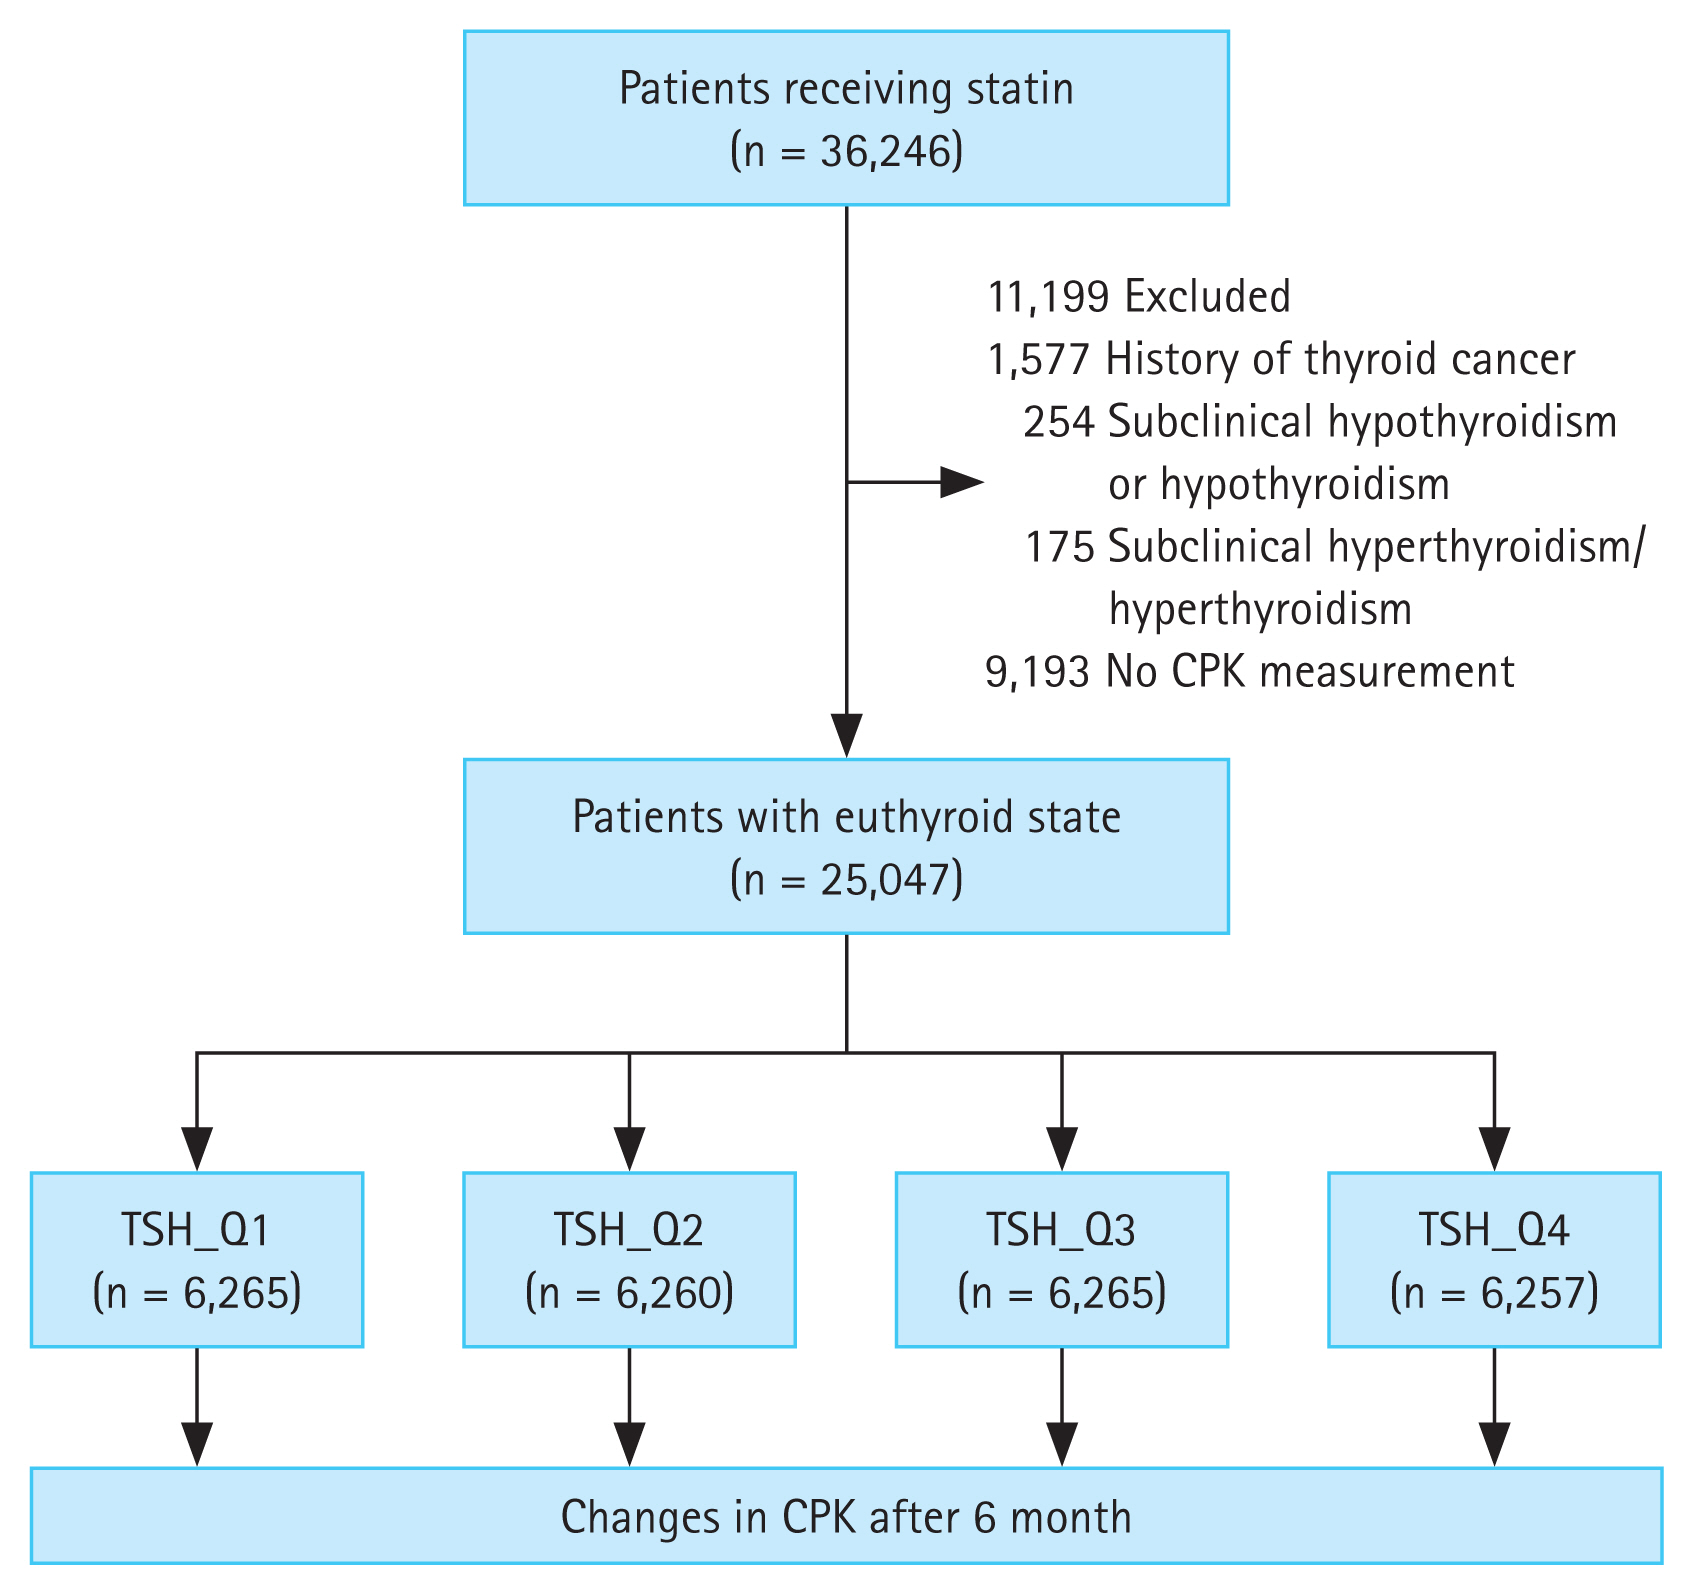
Patients who received statins for the first time (statin-na├»ve participants) (n = 36,246) at the Seoul St. MaryŌĆÖs Hospital between June 2009 and June 2018 were included in the study. After excluding patients with thyroid cancer (n = 1,577), subclinical hypothyroidism or hypothyroidism (n = 254), subclinical hyperthyroidism or hyperthyroidism (n = 175), and no CPK results (n = 9,193), a total of 25,047 patients with euthyroidism were included in the analysis (Fig. 1). The patients were divided into four groups according to TSH quartiles, and changes in CPK levels were retrospectively compared and analyzed among groups after 6 months of statin administration (Fig. 1). The normal range of TSH level was 0.58ŌĆō4.78 ╬╝IU/mL, and was divided into the following quartiles: Q1, 0.58ŌĆō1.062 ╬╝IU/mL; Q2, 1.063ŌĆō1.776 ╬╝IU/mL; Q3, 1.777ŌĆō2.802 ╬╝IU/mL; and Q4, 2.803ŌĆō4.78 ╬╝IU/mL. Low- (pravastatin, 10 and 20 mg), moderate- (rosuvastatin, 5 and 10 mg; atorvastatin, 10 and 20 mg; pitavastatin, 2 and 4 mg; fluvastatin, 80 mg; and simvastatin, 20 and 40 mg), and high- (rosuvastatin, 20 mg, and atorvastatin, 40 mg) intensity statins were administered, depending on the patientŌĆÖs condition, preference, and target low-density lipoprotein (LDL) level. Statin intensity was classified based on the practice guidelines suggested by the American College of Cardiology/American Heart Association [19]. Daily administration of low-, moderate-, and high-intensity statin therapies lowered LDL levels, on average, by < 30%, 30ŌĆō50%, and Ōēź 50%, respectively. The requirement for informed consent was waived owing to the retrospective nature of this study. This study was approved by the Clinical Research Ethics Committee of the Catholic Medical Center (approval number: KC22RISI0016).
Measurements
Patient data, including anthropometric measurements and blood chemistry test results, were collected. Blood samples were collected after overnight fasting to evaluate serum glucose, CPK, total cholesterol, triglyceride, high-density lipoprotein (HDL) cholesterol, LDL cholesterol, free thyroxine, and TSH levels. All measurements were performed using a Hitachi 7600 autoanalyzer (Hitachi Ltd., Tokyo, Japan) at the central laboratory of Seoul St. MaryŌĆÖs Hospital. The triglyceride and total and LDL cholesterol levels were measured using enzymatic assays, and the HDL cholesterol levels were measured using the selective inhibition method. The free thyroxine and TSH levels were measured by enzyme immunoassay using a commercially available IRMA kit (Beckman Coulter, Brea, CA, USA). The normal range of serum CPK levels was Ōēż 200 U/L.
Data privacy and protection and statistical analyses
The data extracted in this study were stored as an encrypted file on the research directorŌĆÖs encrypted computer, which could only be accessed by the principal researcher. For statistical analyses, all personal information was deleted, pseudonymized, and anonymized. In this study, the sample size was considered to be sufficient; therefore, the analysis was conducted under the assumption that population normality was followed without a normality test. Continuous variables are expressed as means ┬▒ standard deviations and compared using t-tests. p values were calculated using correlation analysis for continuous variables and the chi-square test or Fisher exact test for categorical variables. The Pearson correlation coefficient was used for correlation analysis. All statistical analyses were performed using SAS version 9.4 (SAS Institute, Cary, NC, USA). p values < 0.05 were considered statistically significant.
RESULTS
Baseline characteristics
Differences in baseline characteristics among the groups are presented in Table 1. The mean age of the patients was 60.1 ┬▒ 3.4 years, and 43.8% were females. The mean LDL cholesterol level was 123.9 ┬▒ 44.4 mg/dL, and there were no significant differences in lipid profile among the groups. The mean CPK level was 150.0 ┬▒ 33.5 U/L; however, it was highest (198.4 ┬▒ 63.1 U/L) in Q1 and lowest (127.3 ┬▒ 26.5 U/L) in Q4 (p < 0.001). The mean CPK level at follow-up was 115.7 ┬▒ 85.4 U/L; however, there were no significant differences in follow-up CPK levels among groups (p = 0.700). Moderate-intensity statins were prescribed most frequently in all groups. Additionally, there was no significant difference in the prevalence of comorbidities among the quartiles.
Changes in CPK levels according to TSH quartiles before and after statin administration
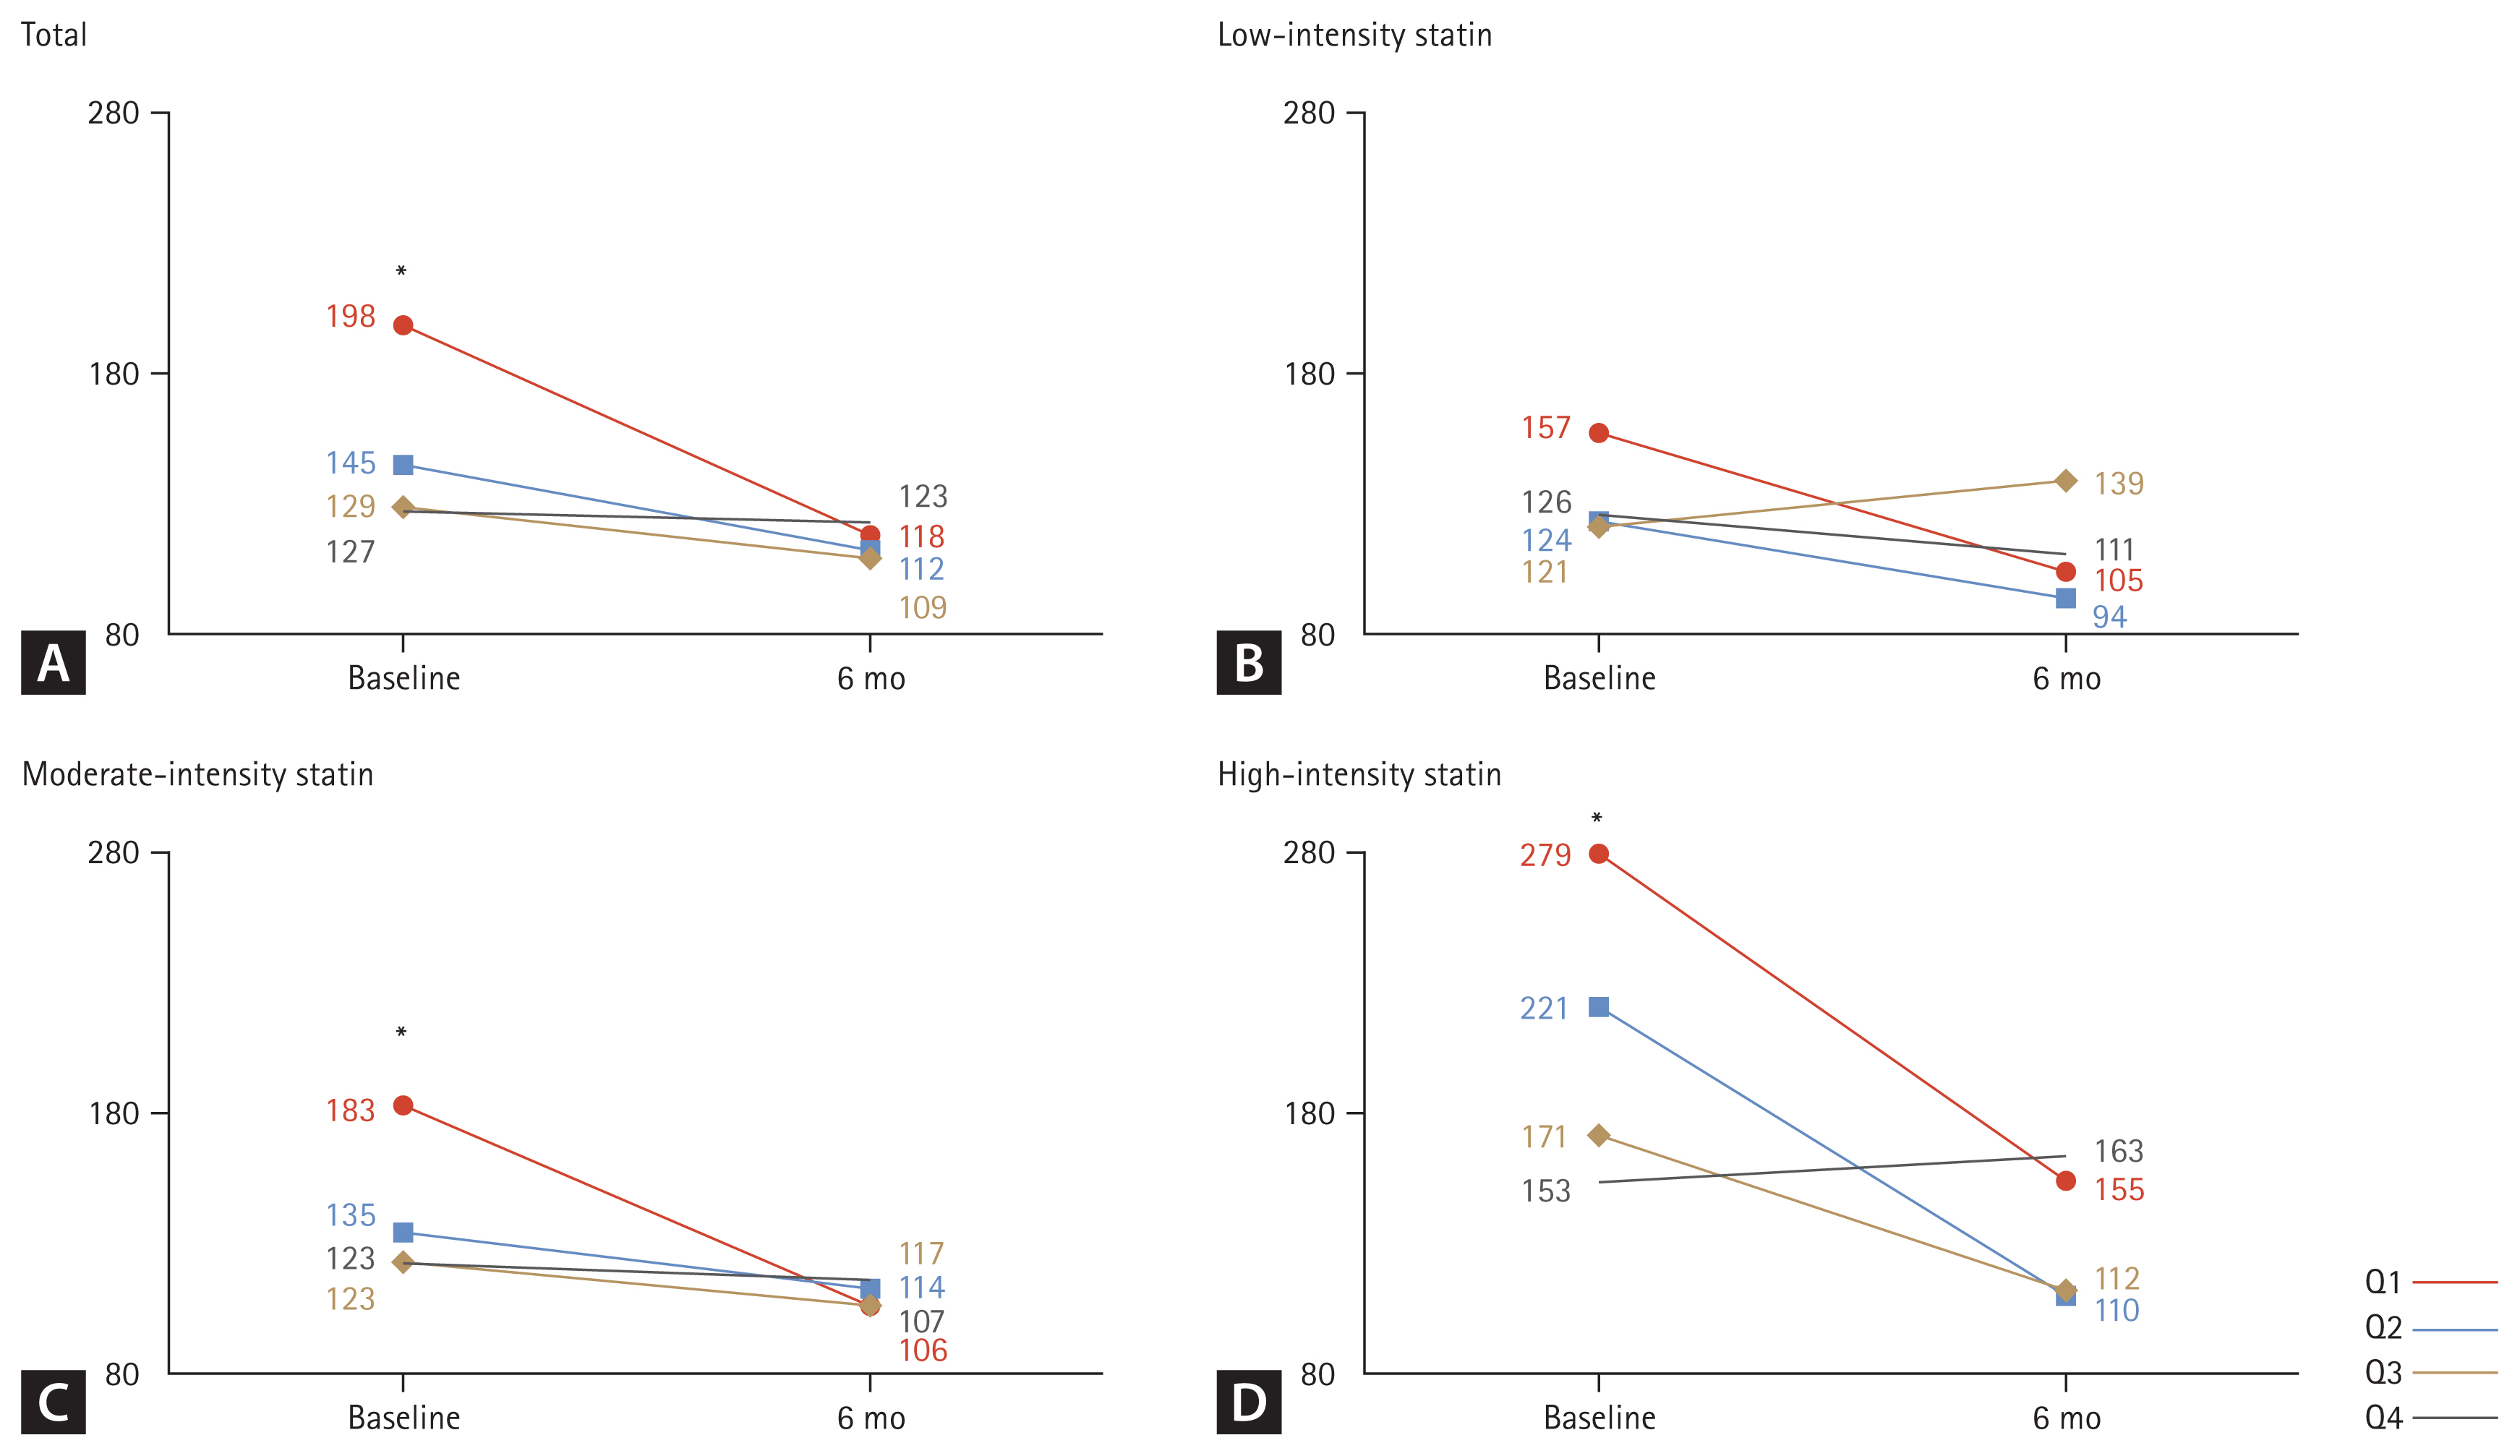
A comparison of CPK levels by TSH quartiles before and after statin administration is illustrated in Fig. 2. At baseline, a significant difference was observed in CPK values by quartile (p < 0.001), but no significant difference was noted at 6 months later (Fig. 2A). In the analysis according to the intensity of the statin, there was a tendency for a difference in CPK value by quartile in the baseline for low-intensity statins, but no statistical difference was noted (p = 0.213) (Fig. 2B). However, for moderate-intensity statin (Fig. 2C) and high-intensity statin (Fig. 2D), a significant difference was observed in CPK values by quartile at baseline (all p < 0.001), but this difference was not significant at 6 months later.
Changes in the proportion of patients with normal CPK levels according to TSH quartiles before and after statin administration
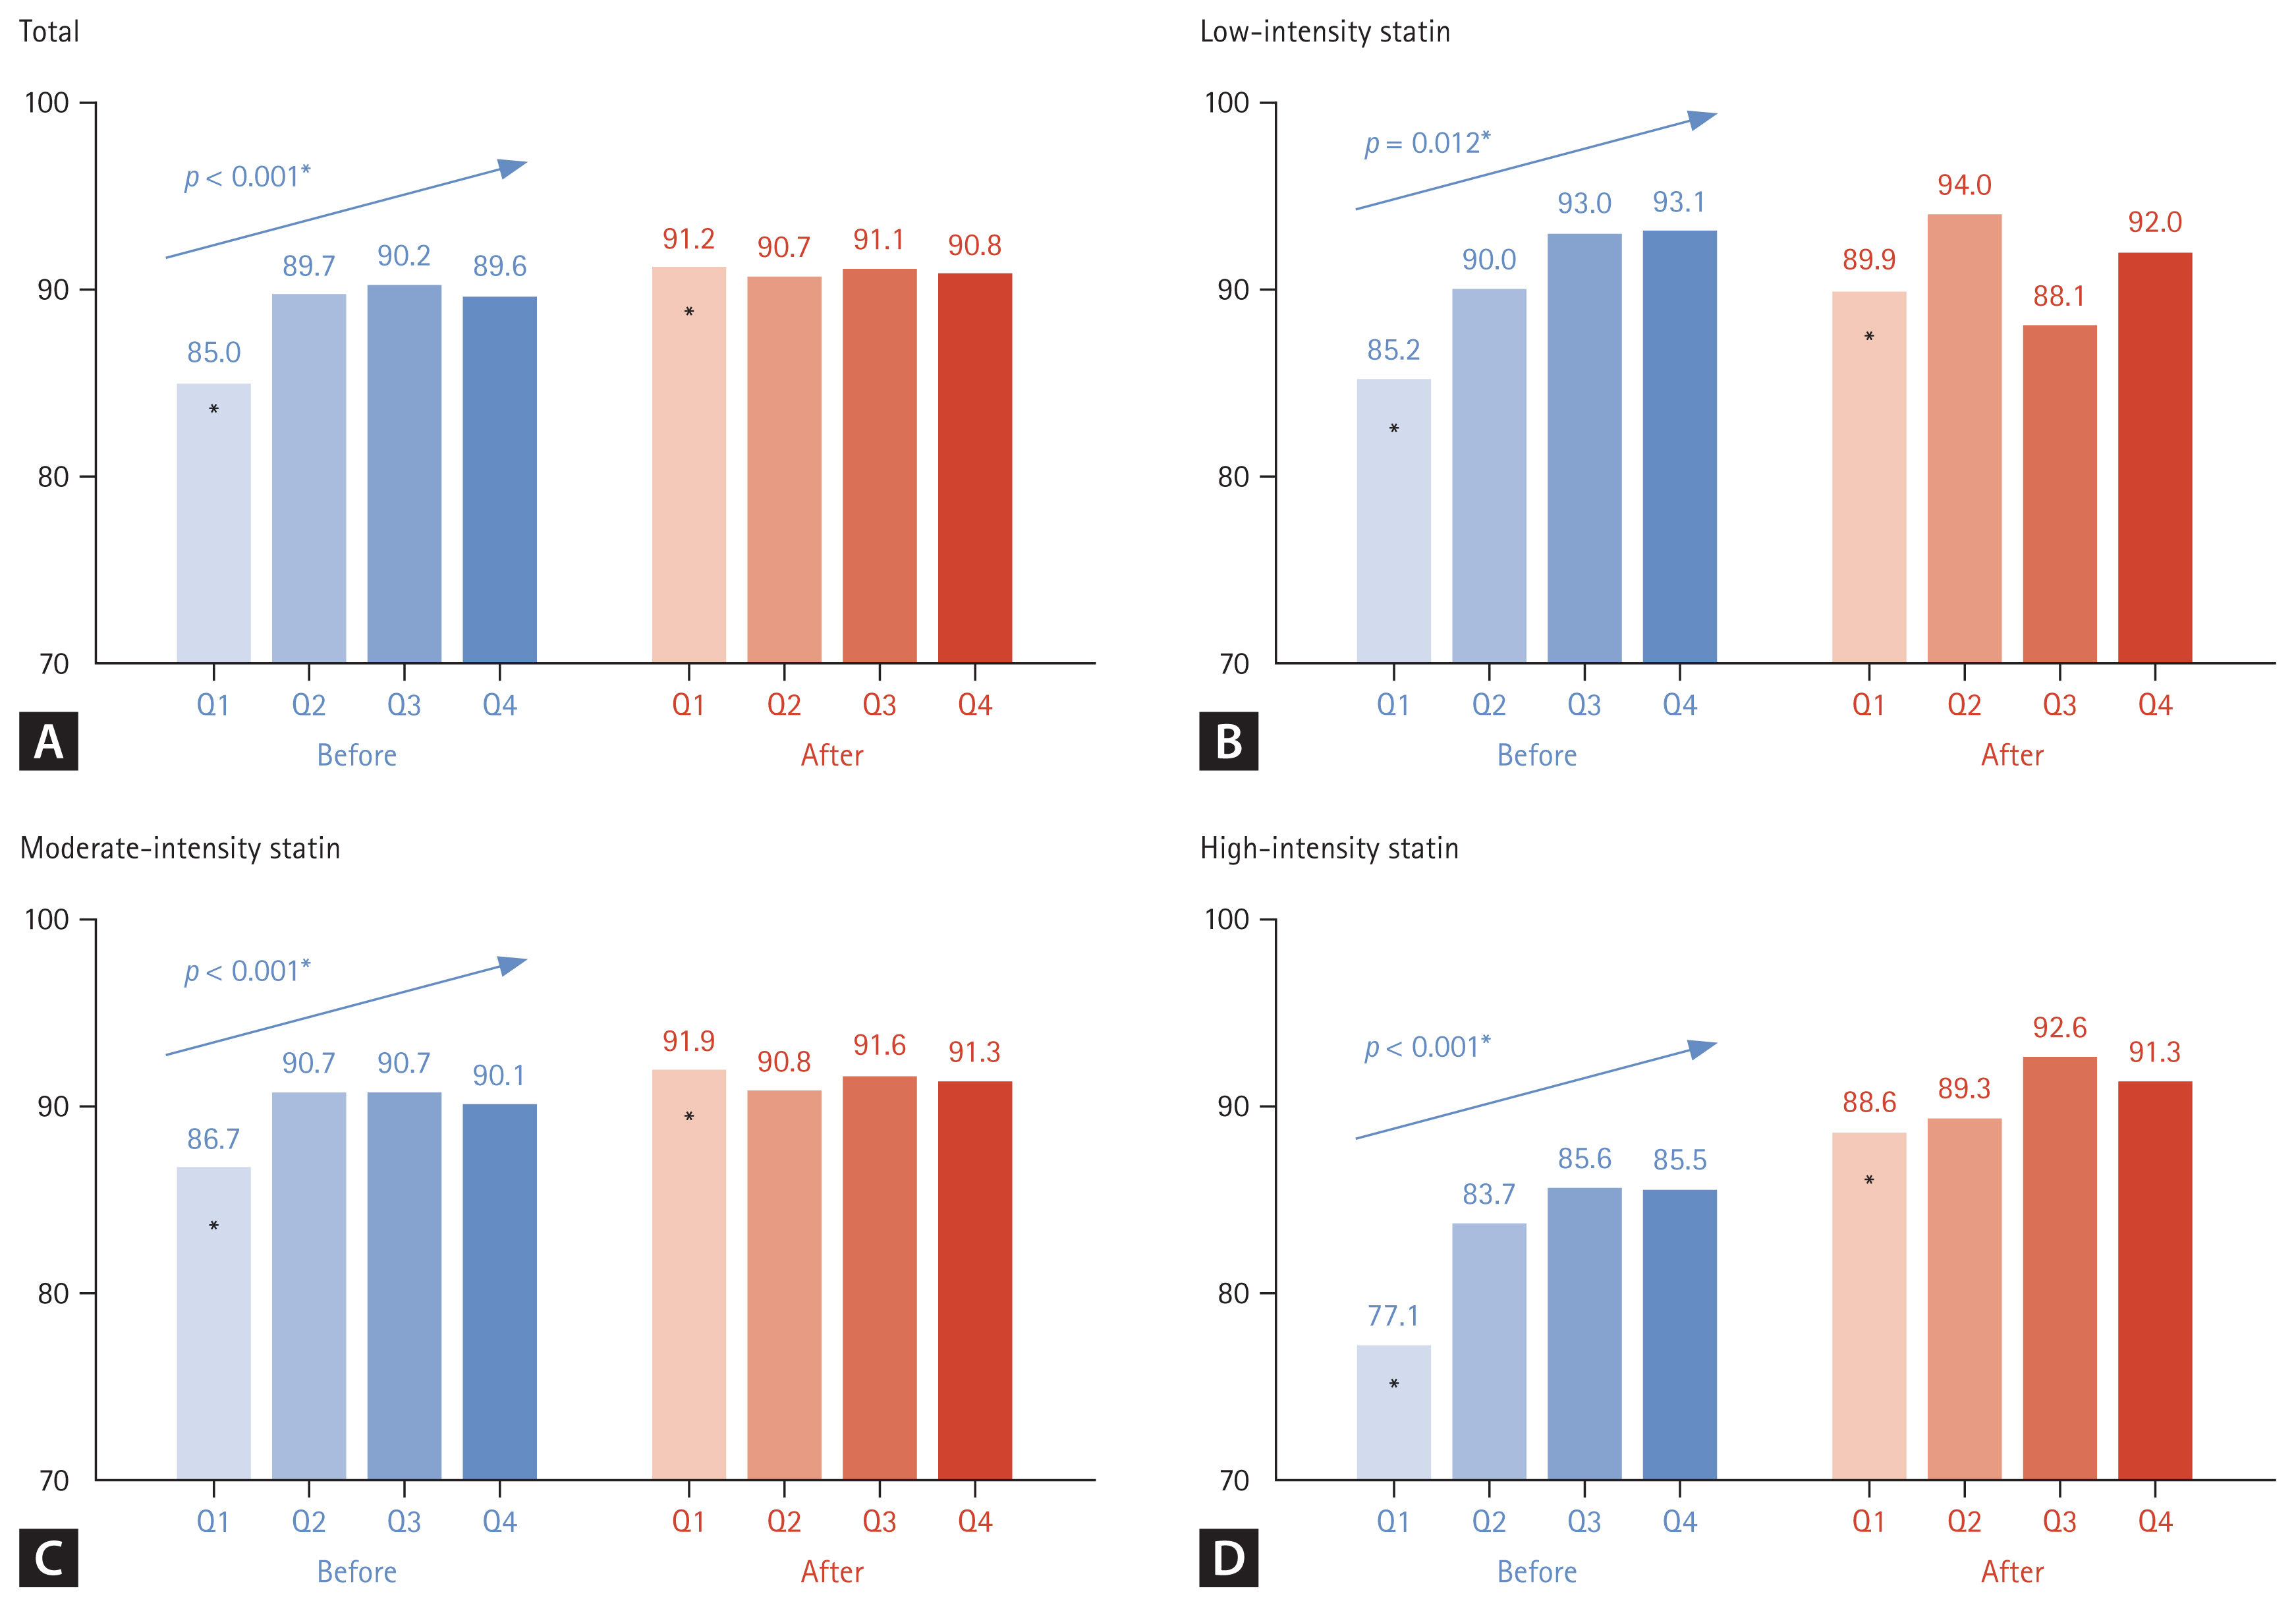
A comparison of the proportion of patients with normal CPK levels (Ōēż 200 U/L) according to statin intensity before and after statin administration is illustrated in Fig. 3. Regardless of statin intensity, there was a significant difference among the groups in the proportion of patients with normal CPK levels before statin administration (p < 0.001, Fig. 3A). However, this difference among the groups after statin administration was not significant (Fig. 3A). A similar pattern was observed in the analysis by statin intensity. The proportion of patients with normal CPK levels in the low-, moderate-, and high-intensity statin groups was significantly the lowest in Q1; however, there was no difference among the groups in the percentage of patients with normal CPK levels after statin administration (Fig. 3B-D). In the high-statin intensity group, the patient group with normal CPK levels before statin administration was the lowest at 77.1% in Q1, however, the rate increased the most after statin administration at 88.6% (p < 0.001, Fig. 3D).
DISCUSSION
In this study, the effect of statin administration on CPK levels in patients with euthyroidism according to TSH quartiles was retrospectively investigated. In the lowest TSH quartile (Q1), the mean CPK level decreased, and the proportion of patients with normal CPK levels increased after statin administration. This change was observed regardless of statin intensity. However, in the other quartile groups, statin administration did not significantly alter the CPK levels.
Since hypothyroidism, typically characterized by elevated TSH, is associated with increased CPK levels, which are a side effect of statin therapy, it prompts the question of whether there is a connection between variations in TSH and CPK levels following statin therapy. However, thyroid function can have various clinical implications depending on the levels of FT4 and TSH. Furthermore, there are contradictory reports on the relationship between changes in TSH and CPK levels after statin administration, depending on whether the hypothyroidism is overt or subclinical. Most studies on hypothyroidism and CPK elevation with statin administration have analyzed patients with untreated overt hypothyroidism. According to previous reports, statin administration in patients with hypothyroidism can lead to mild CPK elevation [20,21], and profound elevation or even overt rhabdomyolysis, although rare, occurs [22ŌĆō24]. The pathogenesis of hypothyroidism-induced changes in CPK levels is entirely fully understood. In hypothyroidism, CPK clearance decreases, and muscle cell permeability may be altered, leading to increased CPK levels [13]. Therefore, patients with hypothyroidism should be converted to a euthyroid state before initiating statin therapy [20]. Several studies have investigated the association between statin administration and myopathy or CPK elevation in subclinical hypothyroidism. Beyer et al. [16] reported a correlation between CPK and TSH levels and an association with CPK elevation under statin administration in subclinical hypothyroidism. Ahn et al. [23] reported that a 63-year-old woman with subclinical hypothyroidism developed rhabdomyolysis after statin administration. However, this is the first study to examine the association between statin administration and changes in CPK levels according to TSH quartiles within the normal TSH range. Even in a euthyroid state, where both FT4 and TSH levels fall within the normal range, we found that low TSH levels were associated with favorable alterations in CPK levels following statin administration. However, the exact mechanism underpinning this association remains unclear. Moreover, the significant difference in CPK levels according to quartiles, even at normal TSH levels, should be continuously considered in the future.
Skeletal muscle is a target organ for thyroid hormones, and impaired muscle metabolism has been reported in subclinical hypothyroidism [25,26]. A positive correlation between CPK and TSH levels in subclinical hypothyroidism has also been reported [16]. Thus, further studies are required to determine whether the low TSH range, even the normal TSH range, has a favorable effect on muscle metabolism. In this study, the CPK level was the highest in TSH_Q1, even in the normal TSH range. Although baseline CPK levels significantly differed by quartiles, there was no difference after 6 months. Therefore, it is difficult to determine a clinical value to the change in CPK levels according to statin prescription in the normal TSH range with this result alone. However, it was possible to indirectly infer that the risk of CPK elevation would be low, at least in the case of TSH_Q1 in the normal TSH range. Thus, future in-depth studies are required to confirm these findings.
Strengths and limitations
CPK elevation varies according to statin intensity [27]. In a recent network meta-analysis of 153,000 patients, elevated CPK levels or myalgia occurred more frequently in a high-intensity therapy group than in a moderate-intensity therapy group [28]. However, Bae et al. [29] reported that short-term adverse effects of statins were rare in Korean patients, and CPK elevation was observed in only 1.2% of patients. However, in this study, in patients with normal TSH levels, the proportion of patients with abnormal CPK levels did not increase after statin administration according to statin intensity, and there was no significant difference among quartiles. Even in the lowest quartile group (Q1), the normal CPK level increased significantly after statin administration. Further studies are required to understand the cause of the favorable effect of the lower normal TSH status on CPK level normalization after statin administration.
This study has some limitations. First, because of the cross-sectional study design, explaining the causal association was difficult. Retrospective cohort studies show correlation rather than causation, further making it challenging to explain the causal association in this study. Consideration of TSH levels can influence CPK levels. It is important to account for changes in TSH when analyzing the changes in CPK levels. However, in this study, the changes in TSH associated with the CPK levels were not investigated. Therefore, additional prospective studies are required to understand the obvious causal relationship in the future. Second, we could not confirm that we objectively assessed adherence, even in patients with regular follow-ups. Moreover, risk factors for CPK elevation after statin administration, such as alcohol consumption and excessive physical activity [30], could not be identified. This is a limitation of electronic medical record-based retrospective cohort studies [31,32]. There is also limited consideration of clinical variables, such as the participantŌĆÖs underlying medical conditions or medications. It may be necessary to assess the impact of these clinical variables on CPK levels. A prospective study based on the results of this study will be required. Thirdly, muscle-related symptoms may hold greater clinical significance than CPK elevation following statin therapy. Thus, while checking CPK levels is crucial, assessing the occurrence of muscle symptoms post-statin use is equally important. However, a limitation of the retrospective study was its failure to analyze the associated symptoms. Finally, the follow-up duration was relatively short at 6 months. However, as statin-associated symptoms usually occur < 4 weeks after statin initiation [33], 6 months is sufficient to investigate any changes in serum CPK levels after statin administration.
To the best of our knowledge, the present study is the first large-scale analysis of 25,074 patients to evaluate the association between statin administration and changes in CPK levels in patients with normal TSH levels. In the lowest TSH quartile of the normal TSH range, the mean CPK levels decreased, and the proportion of patients with normal CPK levels increased significantly after statin administration. However, there was no difference in CPK levels before and after statin administration in other quartiles. This was consistent with the findings of the analysis performed according to statin intensity. Further investigation is required to determine whether low TSH levels within a normal TSH range indicate a favorable effect on CPK clearance and muscle metabolism.
KEY MESSAGE
1. Statin administration impacts CPK levels diversely based on TSH quartiles in euthyroid individuals.
2. Following statin therapy, there is a notable significant decrease within the lowest TSH quartile, accompanied by a significant increase in the proportion of patients with normal CPK levels.
3. Clinically, measuring TSH levels before statin administration may be necessary, as the extent of CPK changes following statin therapy could be influenced by TSH levels.
 PDF Links
 PubReader
 ePub Link
 Full text via DOI
 Download Citation
 Print
Print


