


INTRODUCTION
Globally, more than 296 million people are living with chronic hepatitis B (CHB) infection, and 820,000 deaths occur due to hepatitis B virus (HBV)-related illnesses annually [1]. Chronic HBV infection causes liver fibrosis and cirrhosis and progresses to hepatocellular carcinoma (HCC) in 25ŌĆō40% of HBV carriers [2]. HBV infection is managed with nucleos( t)ide analogues (NAs), which are reverse transcriptase inhibitors [2]. These antiviral agents prevent progression to cirrhosis and reduce the risk of HCC by suppressing HBV replication [3].
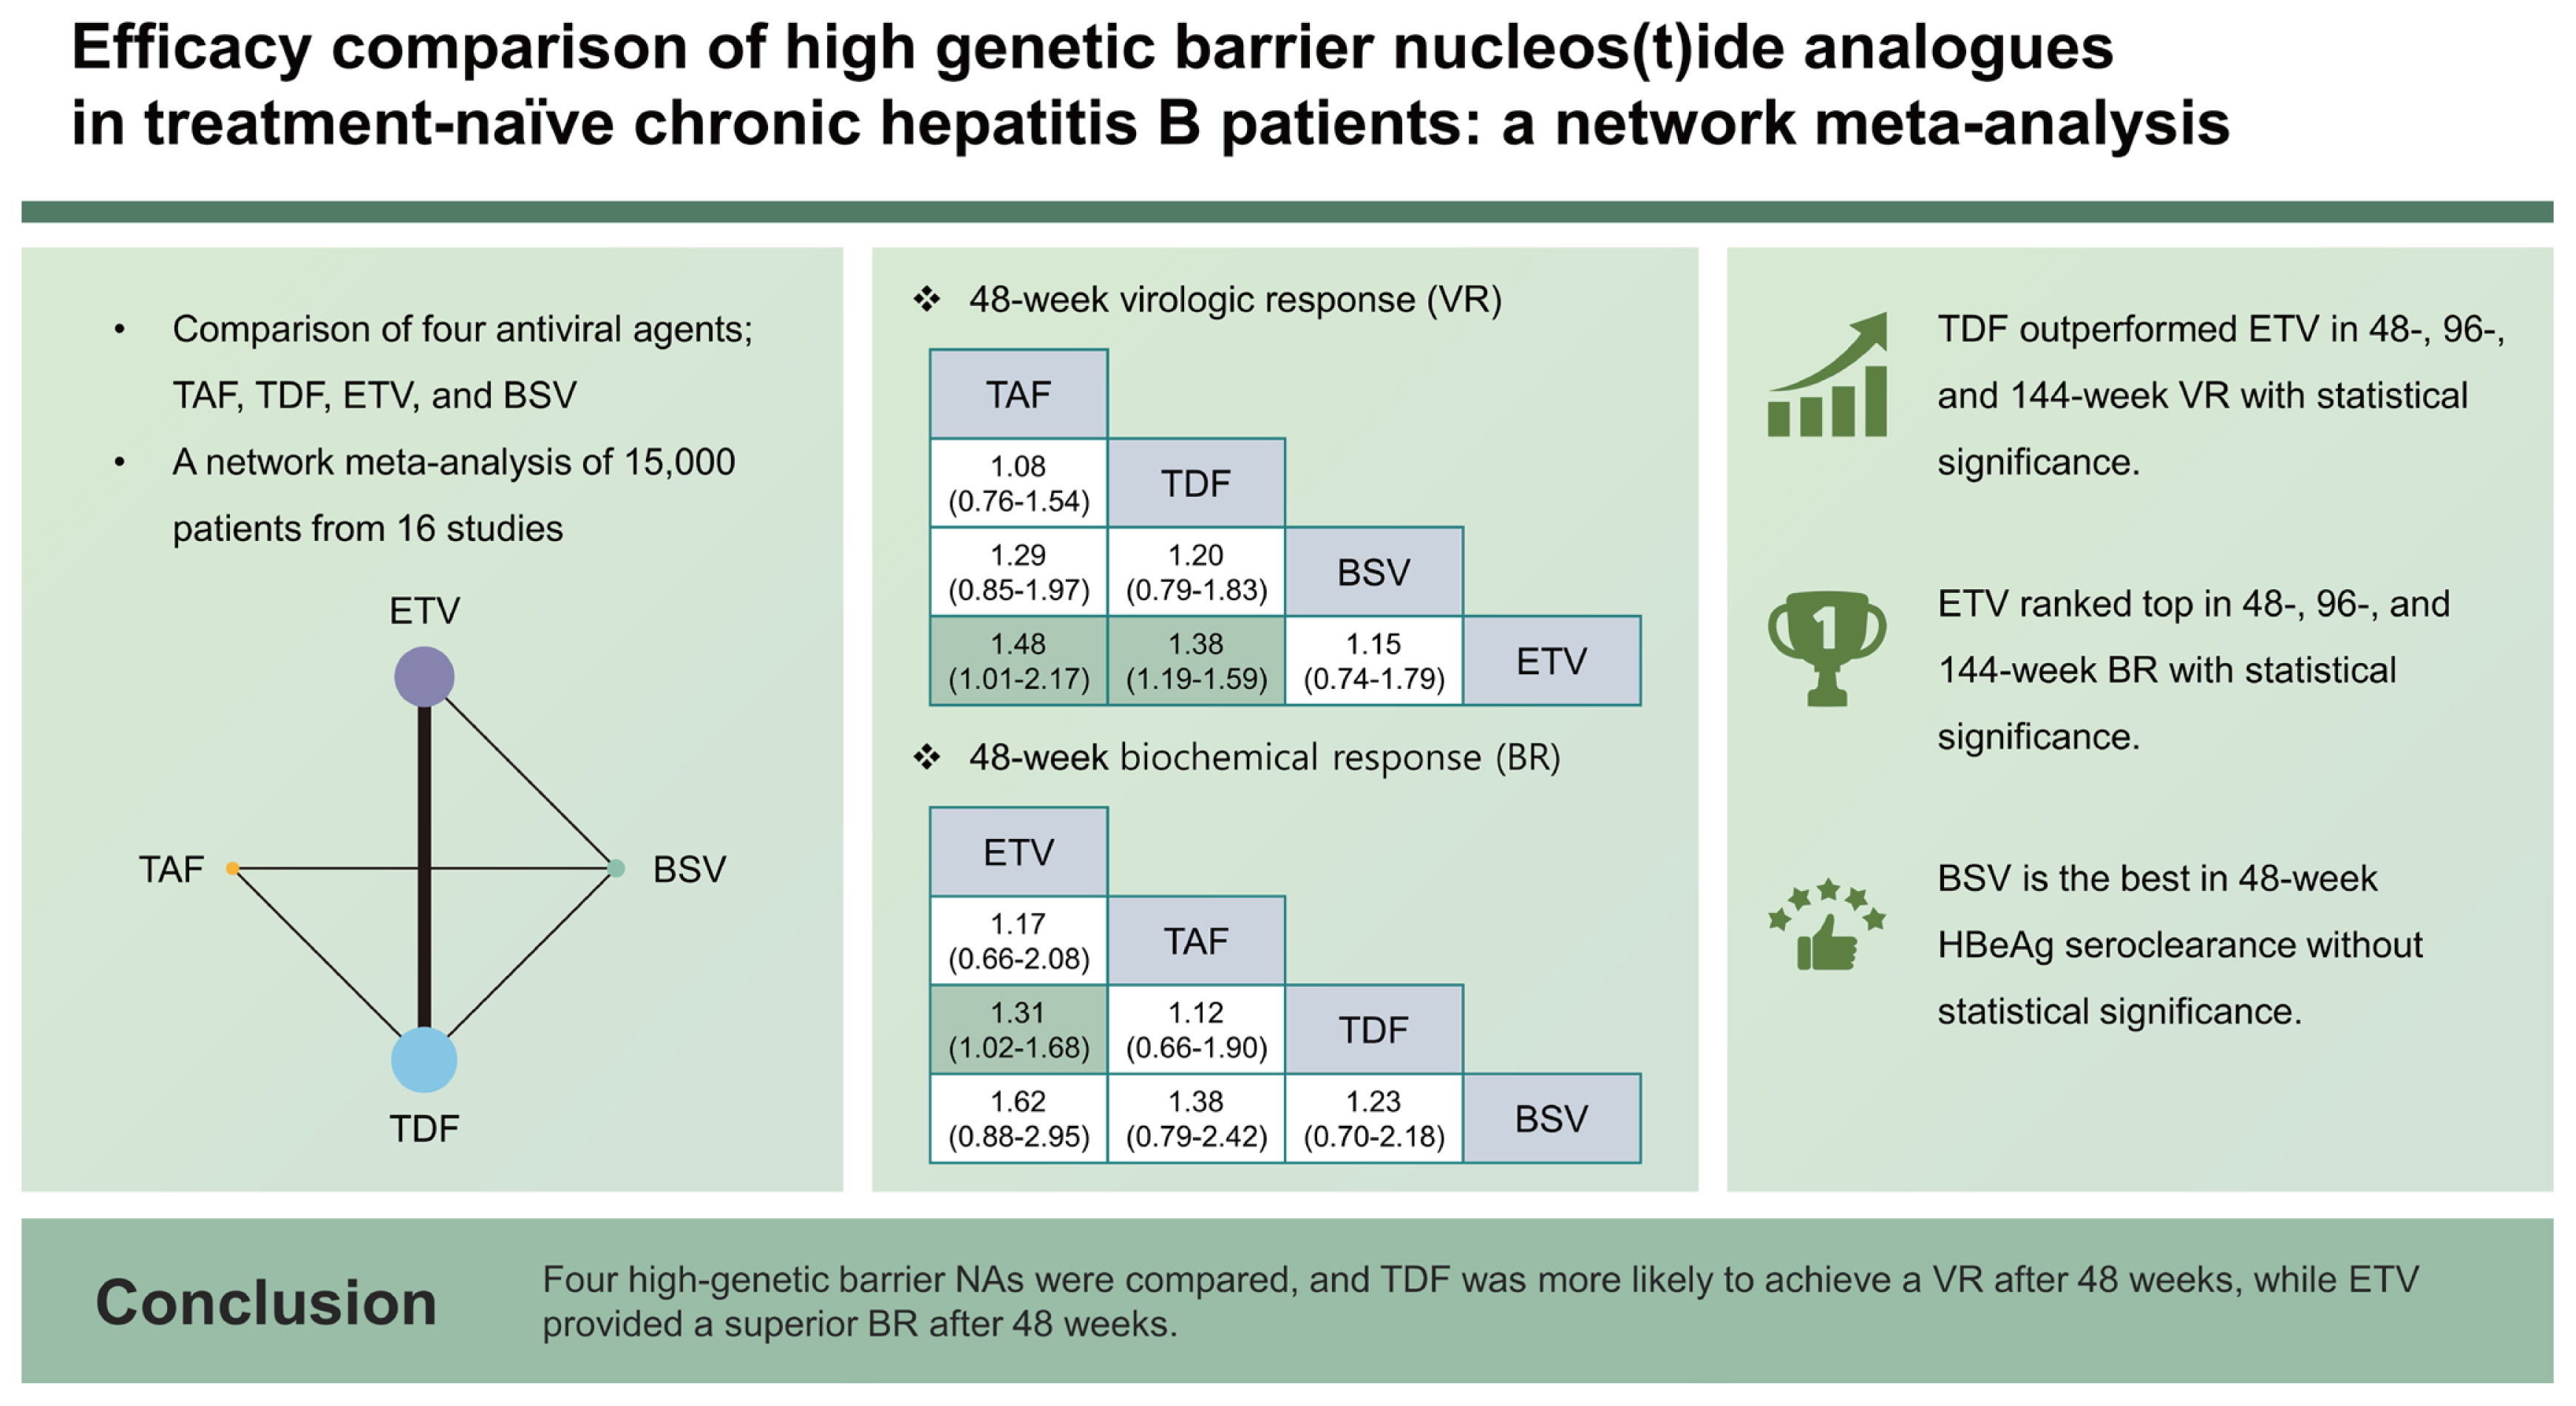
Since the first U.S. Food and Drug Administration (FDA) approval of lamivudine in 1998, various additional NAs have been used in clinical fields, including telbivudine, adefovir, entecavir (ETV), and tenofovir. Recently, professional guidelines from the Asian-Pacific Association for the Study of the Liver, the American Association for the Study of Liver Diseases, and the European Association for the Study of the Liver have all recommended an oral antiviral with a high genetic barrier to resistance, such as ETV, tenofovir disoproxil fumarate (TDF), or tenofovir alafenamide (TAF), as the first-line therapy [4ŌĆō6]. Similarly, the Korean Association for the Study of the Liver guideline also recommends ETV, TDF, and TAF as first-line therapies for HBV infection, together with besifovir dipivoxil maleate (BSV) [7].
There is interest in comparing NAs to establish the best options for those with CHB. Numerous studies, including randomized trials and cohort studies, have compared the efficacy and safety of high-genetic barrier NAs. The majority of these studies did not differ significantly in terms of virologic response (VR) and biochemical response (BR) [8ŌĆō10]. However, previous meta-analyses identified differences between ETV and TDF in achieving complete VR, with favorable outcomes more commonly reported for TDF [11ŌĆō14]. There have been fewer publications addressing TAF or BSV, but some studies have shown that these NAs have similar efficacies to those of ETV and TDF [15,16].
The aim of this study is to estimate the relative efficacies of ETV, TDF, TAF, and BSV in NA-naïve CHB patients in terms of VR, BR, serologic response (SR), virological breakthrough (VB), and hepatitis B surface antigen (HBsAg) loss. Since there have been only a few head-to-head randomized trials directly comparing these high-genetic barrier NAs for CHB patients, we compared these four NAs through a network meta-analysis (NMA) that included randomized trials and propensity score-matched (PSM) studies.
METHODS
Protocol and registration
The systematic review and NMA was conducted in accordance with Preferred Reporting Items for Systematic review and Meta-analysis for Network Meta-Analysis (PRISMA-NMA) (Supplementary Table 1). This NMA was registered in PROSPEROI (registration number: CRD42022357943). Institutional review board approval and informed consent were waived since patients or the public were not involved in this study.
Data sources and search strategy
Published studies were identified from bibliographic databases (PubMED, Embase, and Cochrane library) on March 31, 2023. The search terms using MeSH and text words included the following words or equivalent terms: ŌĆ£Chronic Hepatitis B,ŌĆØ ŌĆ£Besifovir,ŌĆØ ŌĆ£Tenofovir Disoproxil Fumarate,ŌĆØ ŌĆ£Tenofovir Alafenamide,ŌĆØ and ŌĆ£Entecavir.ŌĆØ The full search syntaxes are presented in Supplementary Table 2.
Study inclusion criteria
This systematic review included randomized controlled trials (RCTs) and cohort studies performed with propensity score matching. Studies were included if the following criteria were met: (1) Adult patients (age > 18 yr) diagnosed with CHB; (2) Patients treated with ETV, TDF, TAF, or BSV as monotherapy; and (3) Comparators of the treatment modalities mentioned above. The exclusion criteria were as follows: (1) Previously exposed to NAs or interferons for more than 12 weeks; (2) Placebo-controlled study; (3) Post liver-transplant status; and (4) Studies on special populations such as pregnant women, and those with coinfection with HIV or other concomitant viral infection.
Study selection and data extraction
Two independent researchers (JL and AL) participated in the study selection and evaluation. If discrepancies between their opinions occurred, the corresponding author (HY) participated in the decision process. Required information was extracted in standardized form for publication year, name of first author, study design, number of participants, characteristics of enrolled participants, antiviral therapy administered, and corresponding outcomes (number of events and odds ratio [OR]).
Quality and risk of bias assessment
The quality of the NMA was assessed using a consensus-based 26-item questionnaire posed by Jansen et al. [17]. Risk of bias for the included studies was assessed independently by JL and AL. For RCTs, quality and risk of bias were assessed using CochraneŌĆÖs collaboration tool for randomized studies [18], and the following parameters were evaluated to assess the quality of the studies: randomization, allocation, blinding of participants and researchers, blinding of outcomes, selective reporting, and incomplete outcome data. For non-randomized cohort studies, we assessed bias with respect to selection of participants, confounding variables, intervention measurement, blinding, incomplete outcome data, and selective outcome reporting using RoBINS-I [19].
Outcome measures
Information on HBV DNA suppression, HBsAg loss, hepatitis B e antigen (HBeAg) seroclearance, and alanine aminotransferase (ALT) normalization was collected from the selected studies. For the analyses, VR was defined as undetectable HBV DNA, BR was defined as normalization of ALT after initiation of NA treatment, and SR was defined as seroclearance of HBeAg among patients who were HBeAg-positive prior to treatment. VB which can be defined as a 10-fold increase of HBV DNA level, was also assessed. The primary outcomes were VR at 48 weeks (48VR) and 96 weeks (96VR) after the start of treatment. Outcomes of BR, SR, VB, and HBsAg loss at week 48 were also included in the analyses.
Statistical analysis
The treatment efficacy of the four NAs was compared through a frequentist NMA. Outcomes were assessed as binary and presented as OR. A random-effects model was employed for all outcomes within the NMA, considering the diverse liver function statuses and study designs among the included studies. Global assessment of network inconsistency was performed using a design-by-treatment interaction model [20]. For the local approach of network inconsistencies, a node-splitting method was used to assess the treatment effects derived from direct and indirect comparisons, and the difference between these was significant if the p value was less than 0.05. To visualize the outcomes, pooled ORs and 95% confidence intervals (CIs) of VR results were stratified and presented as a forest plot. Based on the NMA, we estimated ranks for each treatment modality from best to worst outcomes in terms of VR, BR, and SR and presented the results as rankograms. Through NMA that only included randomized studies, sensitivity analysis was carried out for 48VR. For further analyses of ETV and TDF, a conventional meta-analysis with a random effects model was used to compare 96VR, 96BR, and 144BR. The heterogeneity among included studies was quantified using the I2 method. A funnel plot was used to assess publication bias, and the bias in studies comparing ETV and TDF was significant when the p value for the EggerŌĆÖs regression test was less than 0.05. Stata/IC 17 (StataCorp LLC, College Station, TX, USA) was used for the analyses.
RESULTS
Study selection and characteristics
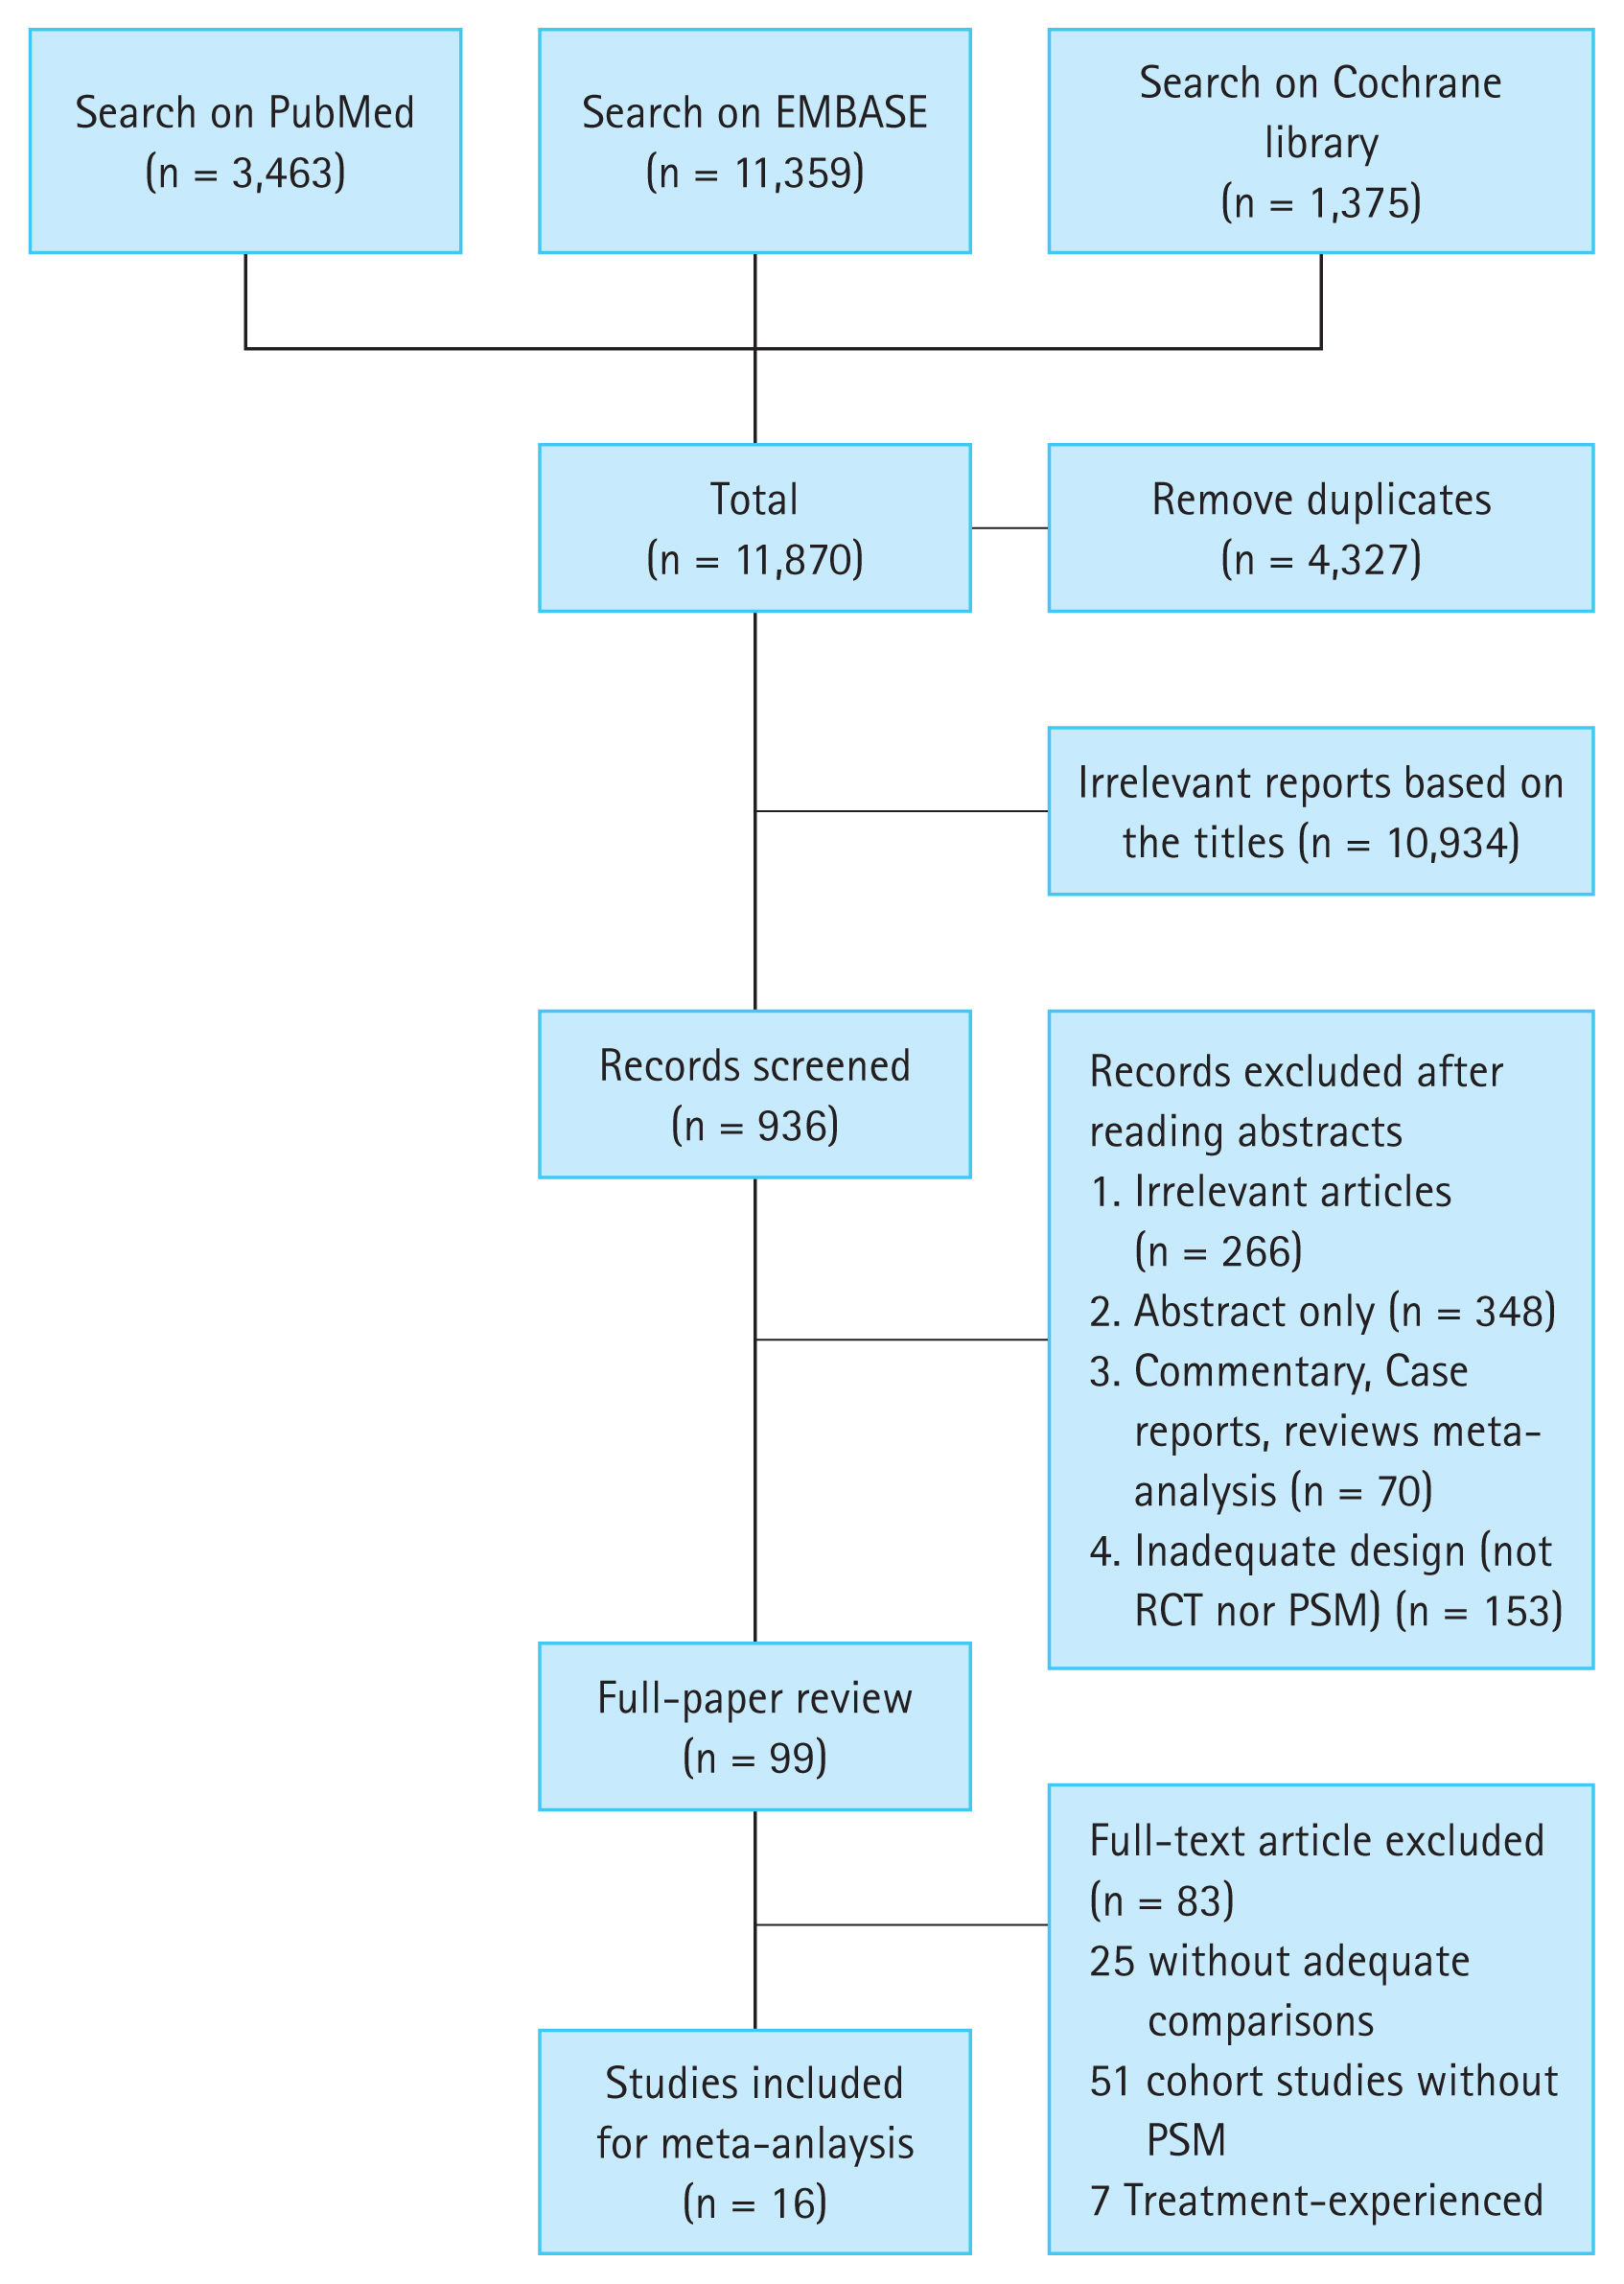
After removal of duplicates (n = 4,327), a total of 11,870 articles initially was identified in the systematic search. After excluding 10,934 irrelevant studies, 936 articles were retrieved for abstract review. Of these, 99 full-text articles were reviewed; 7 RCTs [8,21ŌĆō26] and 9 PSM cohort studies [9,10,27ŌĆō33] were selected for the NMA. The study selection process is shown in Figure 1. In total, 15,000 patients were included in the 16 selected studies: 1,434 patients from RCTs and 13,566 from cohort studies. All studies were from Asian countries, including South Korea, Japan, China, Taiwan, and Thailand. Of the 7 RCTs, 5 compared TDF to ETV, 1 compared BSV to TDF, and 1 compared BSV to ETV. Of the 9 cohort studies, there were 7 comparing TDF to ETV, 1 comparing TAF to TDF, and 1 comparing BSV to TAF. Two studies included only HBeAg-positive subjects, while 14 studies included both HBeAg-positive and negative subjects. In terms of liver function, 1 study included non-cirrhotic patients and 7 included compensated liver diseases. The characteristics of the included studies are presented in Table 1.
Publication bias and quality assessment of individual studies
The quality and risk of bias of the included studies are presented in Supplementary Figure 1. Using ROB 2.0 to assess the quality of RCTs, 2 of the 7 RCTs had a low risk of bias, 3 had a moderate risk, and 2 had a high risk. In terms of the risk of bias for PSM studies, 1 study did not explicitly describe the variables used for the propensity score model. Overall, the risk of bias was moderate in 1 PSM study and low in the remaining PSM studies.
Furthermore, publication bias was assessed and demonstrated using funnel plots (Supplementary Fig. 2A, B). Regarding 48VR, all studies were within or near the diagonal fit lines, and the majority was grouped at the top of the triangle, with the exception of 1 study that compared ETV with TDF and was isolated on the funnel plotŌĆÖs lower left side. Similarly, in the 48BR analysis, the funnel plot displayed most studies to be between the diagonal lines, with the exception of 2 studies comparing ETV and TDF. Therefore, further assessment was performed using EggerŌĆÖs regression test to determine the possibility of bias in studies comparing ETV and TDF. The p values for small study effects were 0.519 for 48VR and 0.955 for 48BR, indicating no significant evidence of publication bias (Supplementary Fig. 2C, D).
Inconsistency test
Using a design-by-treatment interaction model, the global approach for inconsistency was assessed. No evidence of inconsistency was found for 48VR (p = 0.977), 96VR (p = 0.955), 48BR (p = 0.730), and 48SR (p = 0.998). A local inconsistency test also was performed using a node-splitting model and showed no inconsistencies between direct and indirect comparisons for any loop (Supplementary Table 3). Overall, no inconsistency was found and NMA is reliable.
VR: HBV DNA suppression after 48 and 96 weeks of NA treatment
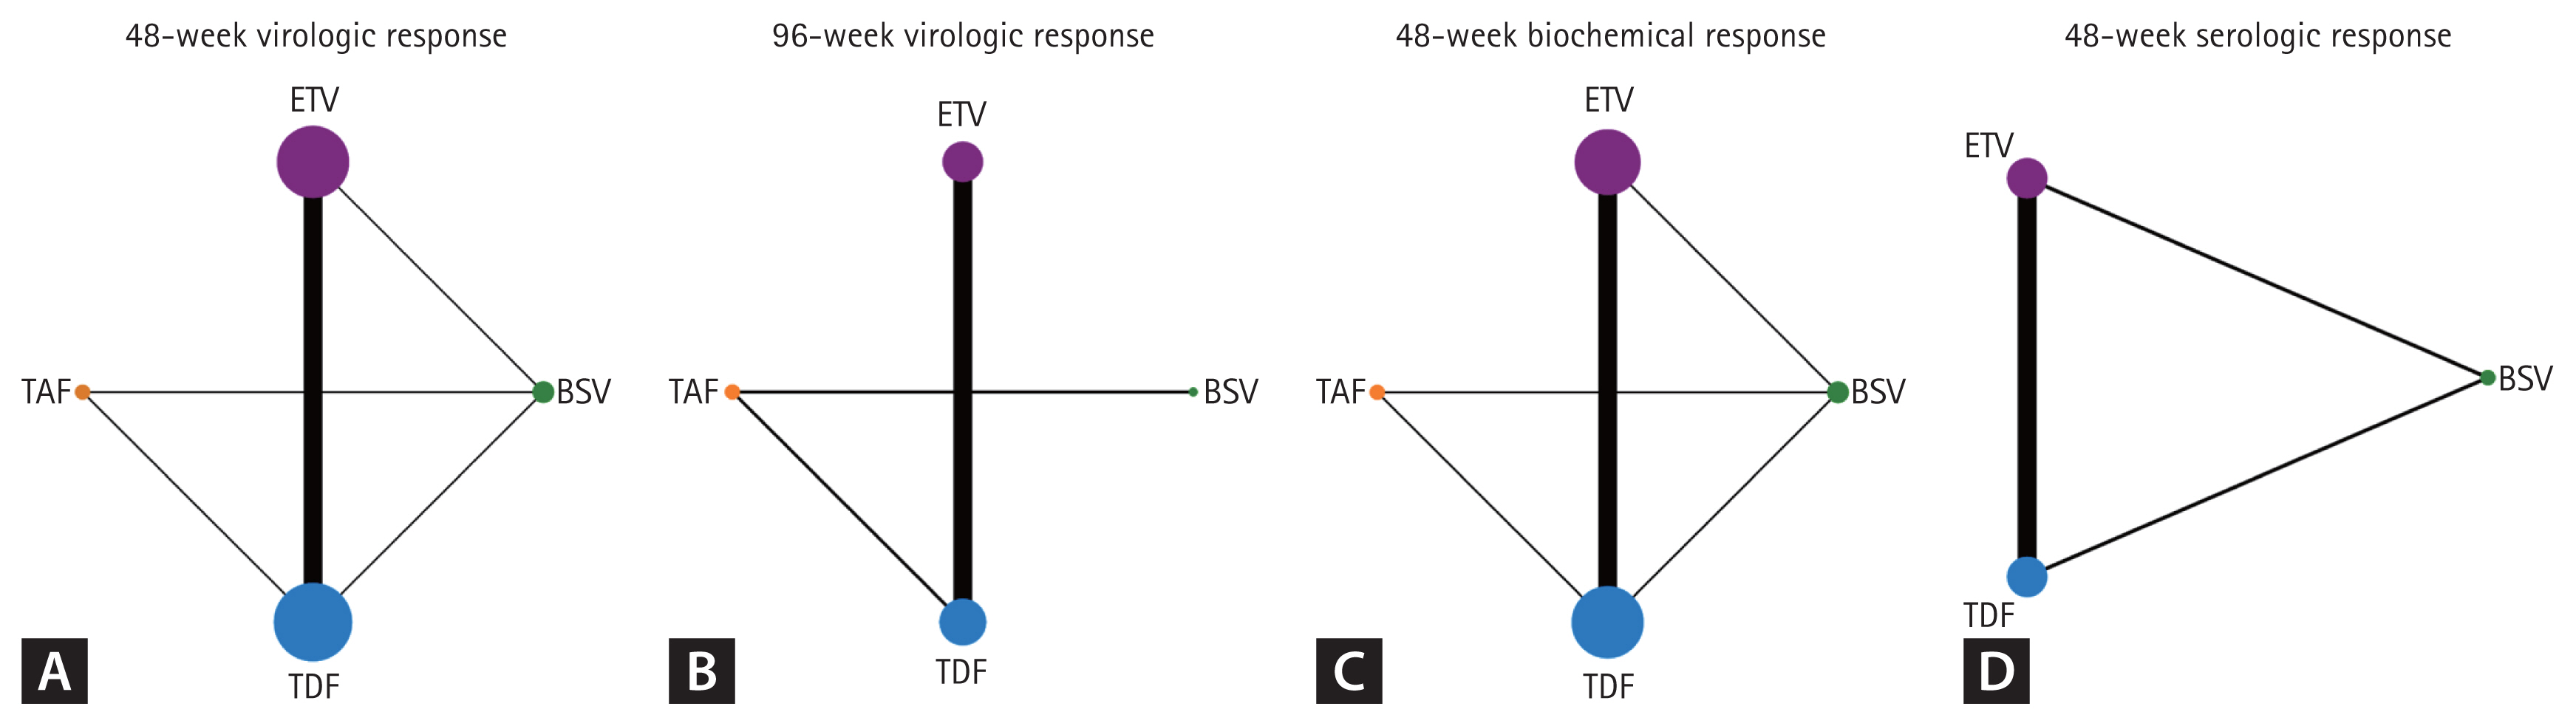
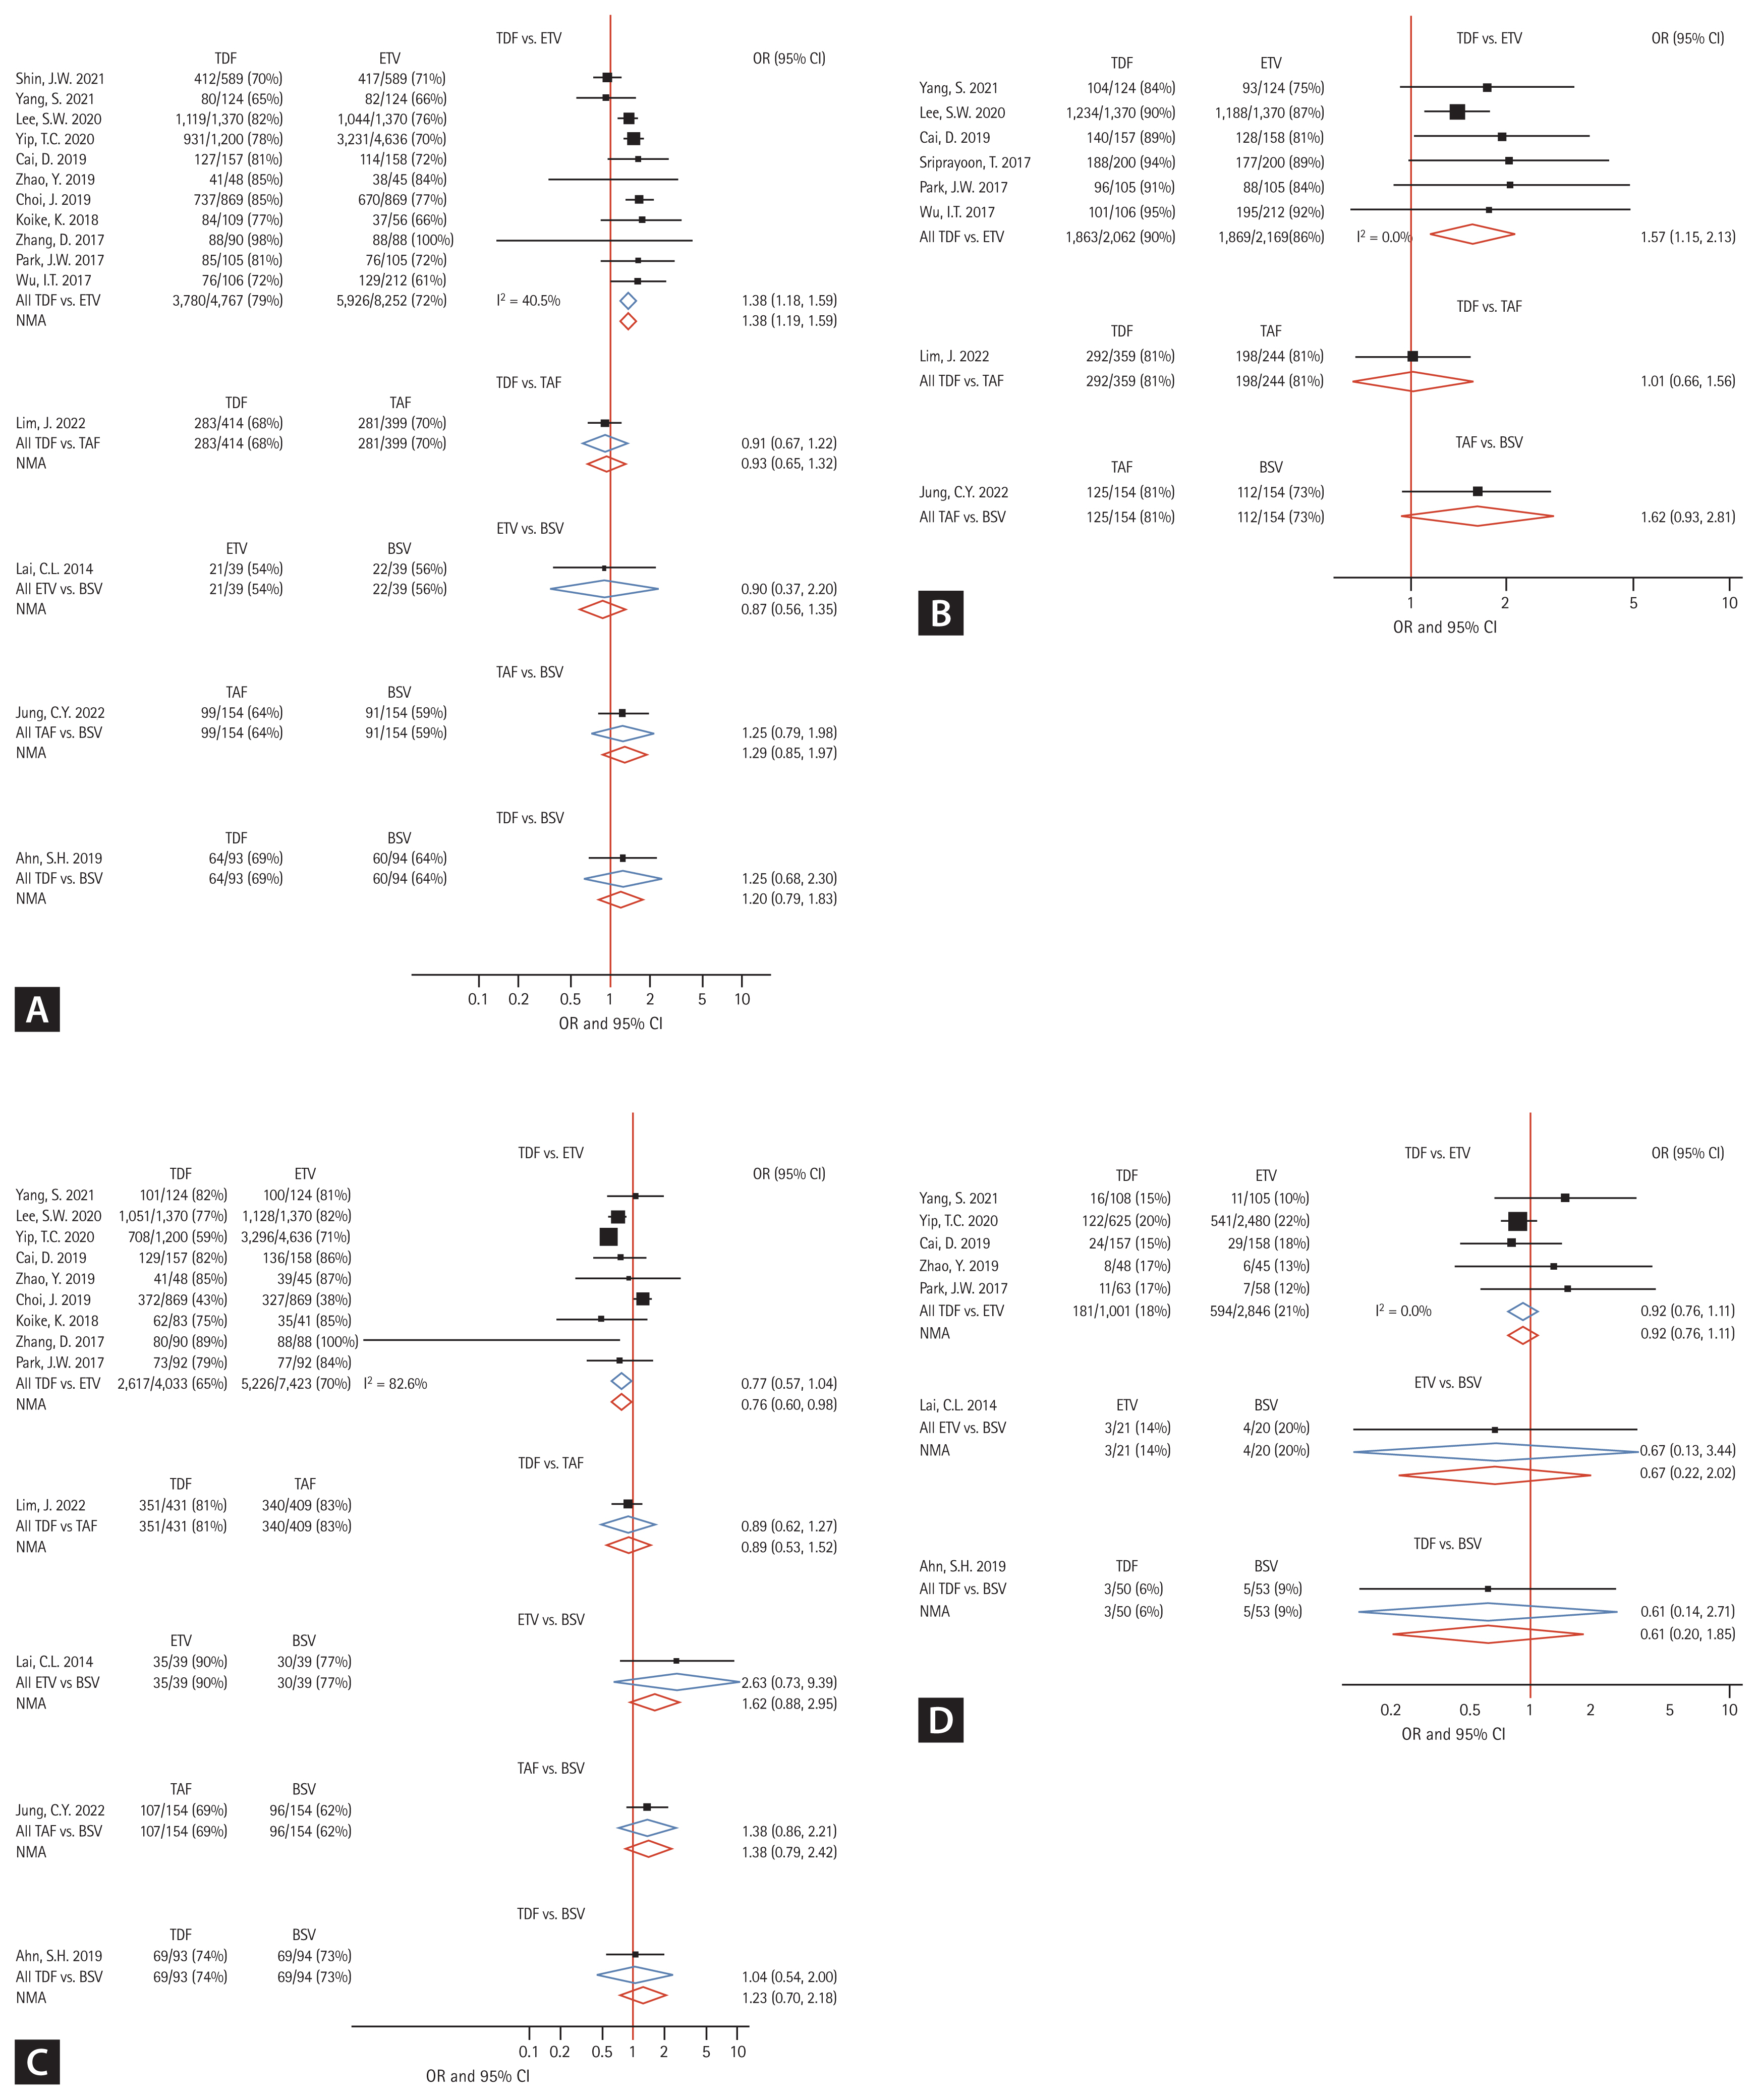
In total, 15 studies (6 RCTs and 9 cohort studies) were analyzed for assessment of 48VR, and the schematic diagram of enrolled studies for 48VR NMA was depicted in a network map (Fig. 2A). In the direct comparisons, 4,127/5,274 patients receiving TDF, 5,947/8,291 patients receiving ETV, 380/553 patients receiving TAF, and 173/287 patients receiving BSV achieved 48VR. The forest plot (Fig. 3A) and interval plot (Supplementary Fig. 3A) were used to show efficacy comparison of 48VR for each NA. Although most of the comparisons showed no significant differences in achieving 48VR, TDF achieved a significantly higher rate than ETV (OR, 1.38; 95% CI, 1.19ŌĆō1.59; p < 0.001). Moreover, using indirect comparison by NMA, TAF was more efficacious than ETV (OR, 1.48; 95% CI, 1.01ŌĆō2.17; p = 0.044).
With regard to 96VR, 8 studies (2 RCTs and 6 cohort studies) were included for NMA (Fig. 2B), and the results are depicted in a forest plot (Fig. 3B). The efficacy outcomes were similar to those for 48VR, and the outcomes for TDF were superior to those for ETV (OR, 1.57; 95% CI, 1.15ŌĆō2.13; p = 0.004). There were no significant differences between other NAs in terms of 96VR as shown in an interval plot (Supplementary Fig. 3B). The league tables for 48VR are shown in Table 2.
We used a random-effects model meta-analysis to expand the analysis of ETV and TDF to 144 weeks. Consistent with the 48VR and 96VR results, TDF demonstrated a higher rate of 144VR than did ETV, with an OR of 1.45 (95% CI, 1.14ŌĆō1.85; p = 0.003; Supplementary Fig. 4A). Supplementary Figure 5A shows a forest plot summarizing the year-by-year comparison of 48VR between ETV and TDF.
BR: ALT normalization after 48 weeks of NA treatment
A total of 13 studies (6 RCTs and 7 cohort studies) was analyzed for the BR (network map shown in Fig. 2C), and the results are shown in Figure 3C and Supplementary Figure 3C. In the 48BR analyses, 3,037/4,557 patients receiving TDF, 5,261/7,462 patients receiving ETV, 447/563 patients receiving TAF, and 195/287 patients receiving BSV in the included studies achieved 48BR. Contrary to the 48VR results, ETV was more likely to achieve 48BR than was TDF (OR, 0.76; 95% CI, 0.60ŌĆō0.98; p = 0.028). Other NAs included in the NMA did not differ in achievement of 48BR. The league table for 48BR is shown in Table 2. Further analysis comparing 96BR and 144BR among patients receiving ETV or TDF was performed using a conventional meta-analysis. Consistent with the 48BR results, patients receiving TDF had a lower likelihood of achieving BR than did those receiving ETV at both the 96- and 144-week time points (96BR: OR, 0.66; 95% CI, 0.55ŌĆō0.80; p < 0.001; 144BR: OR, 0.71; 95% CI, 0.58ŌĆō0.87; p = 0.001; Supplementary Fig. 4B, C). A forest plot displaying BR over time is provided in Supplementary Figure 5B.
SR: HBeAg seroclearance after 48 weeks of NA treatment
Seven studies (4 RCTs and 3 cohort studies) were included in the SR analyses (Fig. 2D). In the 48BR analyses, 184/1051 patients receiving TDF, 597/2867 patients receiving ETV, and 9/73 patients receiving BSV in the included studies achieved 48SR. As shown in Figure 3D and Supplementary Figure 3D, there were no statistical differences among NAs in terms of 48SR (ETV vs. BSV: OR, 0.67; 95% CI, 0.22ŌĆō2.02; p = 0.489; TDF vs. BSV: OR, 0.61; 95% CI, 0.20ŌĆō1.85; p = 0.391; TDF vs. ETV: OR, 0.92; 95% CI, 0.76ŌĆō1.11; p = 0.395).
VB after 48 weeks of NA treatment
For the NMA of the 48VB results, 4 RCTs and 1 cohort study were retrieved from the enrolled studies. In direct comparisons, 6/133 patients, 4/285 patients, and 6/392 patients in the included studies experienced VB during the first 48 weeks of treatment in patients treated with BSV, ETV, and TDF, respectively. There were no statistical differences in the incidence of 48VB among those three NAs, as shown in Supplementary Figure 6A and B.
HBsAg loss after 48 weeks of NA treatment
Only 4 studies (3 RCTs and 1 cohort studies) reported HBsAg seroclearance at 48 weeks: 3 studies compared ETV to TDF and 1 study compared TDF to BSV. Only 1 of 377 ETV-treated patients (0.3%) and 4 of 515 (0.8%) TDF-treated patients demonstrated HBsAg loss. No BSV-treated patients (n = 87) achieved antigen loss. Using conventional meta-analysis, there was no significant difference between ETV and TDF in terms of achieving HBsAg seroclearance after 48 weeks of treatment.
Rankogram showing efficacy comparisons by NA
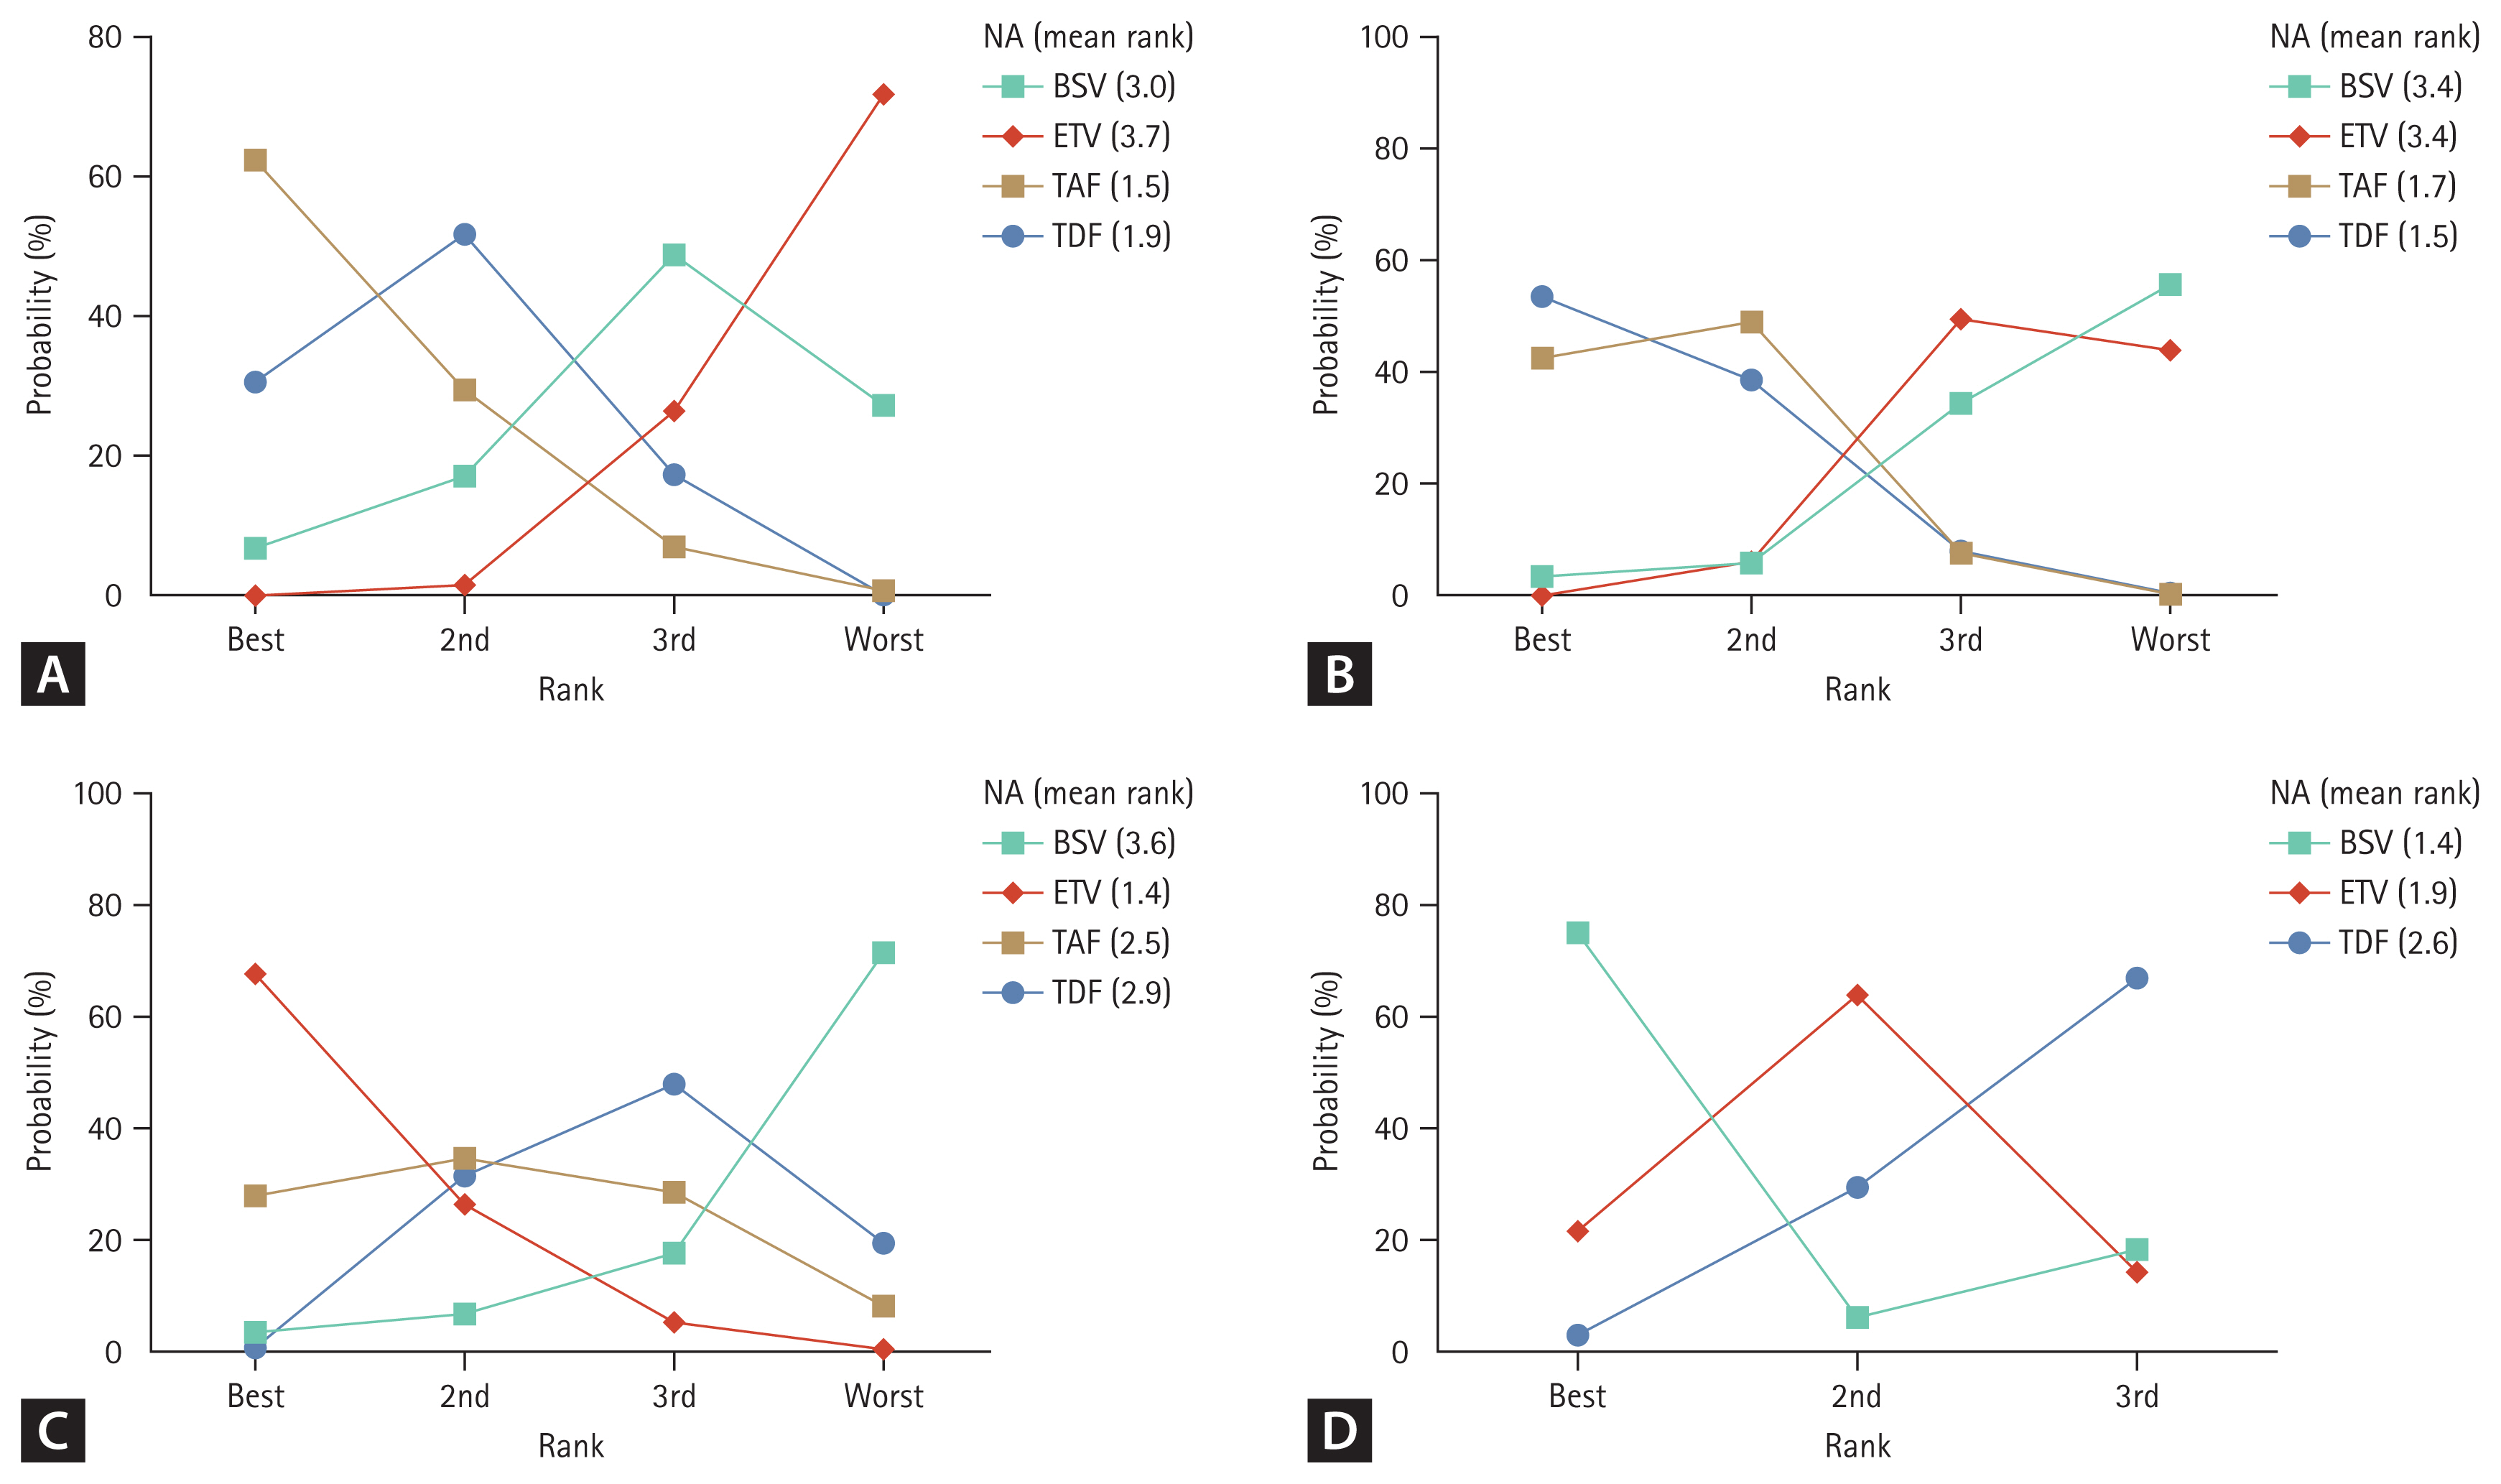
To support the decision-making process for NA selection, NA ranking was evaluated for and is displayed in Figure 4. When 48VR was evaluated using a rankogram, the rankings in descending order were TAF, TDF, BSV, and ETV. For 48BR, the order was ETV, TAF, TDF, and BSV. As for 48SR, the ranking order was BSV, ETV, and TDF. TAF was not assessed for the 48SR due to a lack of related studies.
Sensitivity analyses
We solely used RCTs for the sensitivity analysis of the study outcome, comparing the results of all studies. In the analysis using RCTs, similar tendencies were found, with TDF achieving a better outcome than ETV for 48VR (OR, 1.51; 95% CI, 1.04ŌĆō2.19; p = 0.030; Supplementary Fig. 7A). Furthermore, in the NMA for 48VR with compensated liver diseases (5 RCTs, 3 cohort studies), TDF outperformed ETV (OR, 1.28; 95% CI, 1.00ŌĆō1.63; p = 0.047), while the outcomes for the other NAs did not differ (Supplementary Fig. 7B). Additionally, for our sensitivity analysis, we specifically gathered studies that utilized an HBV DNA level of 20 IU/mL as the lower limit of detection (Supplementary Fig. 7C). Among the 8 studies included in this subset for 48VR, TDF exhibited a more favorable outcome compared to ETV (OR, 1.44; 95% CI, 1.12ŌĆō1.84; p = 0.004), whereas the results for other NAs did not show significant differences.
Subgroup analyses based on the presence or absence of HBeAg
Next, a subgroup analysis of 48VR was performed according to the presence or absence of HBeAg. Four studies, including 1 RCT and 3 cohort studies, were included in the analyses. In the HBeAg-positive subgroup, a tendency was observed suggesting that TDF had a higher probability of achieving VR compared to ETV, with an OR of 1.63 (95% CI, 0.93ŌĆō2.86; p = 0.088) using a random-effects model (Supplementary Fig. 8A). However, contrary to the previously established results on 48VR, no difference between ETV and TDF in HBeAg-negative was found (OR, 1.34; 95% CI, 0.64ŌĆō2.80; p = 0.445) (Supplementary Fig. 8B).
DISCUSSION
The current study analyzed the efficacies of high-genetic barrier NAs in treatment-naïve CHB patients with respect to VR, BR, SR, and VB. For VR, TDF was likely to achieve higher proportion of 48VR and 96 VR compared to ETV, while patients treated with ETV fared better than those receiving TDF with respect to 48BR, illustrating divergent outcomes in terms of therapeutic efficacy.
Numerous published studies, including RCTs and cohort studies, have reported the efficacy and safety of high-genetic barrier NAs, and the majority could not reveal statistical difference among the NAs in terms of VR and BR. Meta-analysis concerning efficacy of these drugs also been performed previously, and the results revealed differences between ETV and TDF in achieving complete VR, with most cases showing more favorable outcomes for patients receiving TDF [11ŌĆō14]. Moreover, in recent years, several studies using nationwide data and/or hospital-based cohorts that compared the incidence of HCC in patients treated with ETV or TDF have been published, yielding disparate outcomes for both arms [30,32,34]. As for these results, there is debate whether difference exists on the outcome of treatment efficacy between TDF and ETV exists. Fewer studies addressing TAF or BSV have been published, but some of these have reported similar efficacies of TAF or BSV when compared with the previously approved drugs, ETV and TDF. In addition, several meta-analyses have been introduced regarding those two NAs [35,36].
This study demonstrated that TDF outperformed ETV in terms of VR at both 48 and 96 weeks when assessed by NMA and at 144 weeks when assessed by conventional meta-analysis. The results by NMA indicated superior results of ETV to TDF for the 48BR. A conventional meta-analysis was used to compare ETV and TDF with respect to BR, and the tendency for ETV to be superior persisted for 144 weeks. No difference between the drugs was noted with respect to SR. When comparing BSV or TAF to the other drugs, TAF performed better than ETV for the 48VR endpoint, but there was no significant difference in BR or SR. Furthermore, we performed subgroup analyses of the studies that only included compensated liver disease, and the results continued to indicate superior outcomes for TDF compared to ETV with respect to 48VR. Given the majority of CHB patients are diagnosed in the early stages of liver disease and are routinely monitored under an active surveillance system, subgroup analyses based on compensated liver disease represent types of patients seen in real-world clinical practice. Subgroup analyses of HBeAg-positive and -negative CHB also were performed. In the HBeAg-positive subgroup, TDF provided better outcomes than ETV, whereas no differences between the two drugs was found for the HBeAg-negative subgroup. The outcomes of the subgroup analyses may have reflected the greater reported prevalence of the YMDD mutation in HBeAg-positive patients than in HBeAg-negative patients, which may render ETV less efficient than TDF [37].
The current treatment of choice for CHB is a drug with a high genetic barrier. While many studies have compared the efficacies of diverse NAs for CHB, to the best of our knowledge, no study has focused solely on high-genetic barrier NAs, and few studies have included BSV in the analyses. In contrast to previous meta-analyses, the majority of which did not include TAF or BSV in the comparison arms, our study included all four NAs known to have high barriers to HBV resistance, namely ETV, TDF, TAF, and BSV [7]. Moreover, our study demonstrated various outcomes that are commonly used in clinical practice to determine the efficacy of the drugs [5ŌĆō7]. As a result, our study design strongly reflects the patient population in real-world practice and may be more useful in assisting clinicians when choosing NAs. Additionally, whereas prior systematic reviews included both treatment-experienced and treatment-naive patients, the current study restricted trial enrollment to treatment-naive patients, strengthening its novelty [12]. This allowed us to better reflect real-life clinical practice and to provide more relevant insights for clinicians managing such patients.
As stated earlier, there are discrepancies between the BR and VR results for ETV and TDF. However, the mechanisms underlying these discrepancies are not well established. Concerning this issue, Con et al. have proposed that the lipid-lowering effect of TDF may influence BR by disrupting the cellular membrane and causing liver enzyme leakage [36]. In addition, Chen et al. [11] have postulated that metabolites of the drugs might lead to such results. Another hypothesis, proposed by Chen et al. [11], posits that TDFŌĆÖs ability to induce a more robust immune response, as evidenced by a higher rate of achieving 48VR, might inadvertently lead to greater hepatic cell damage, resulting in elevated liver enzyme levels. There may be other explanations of these outcomes. First, regarding BR, the background characteristics of the TDF and ETV groups in PSM studies might differ. TDF and ETV are unique drugs that were developed at different times and have different historical backgrounds. Even though PSM was performed, such differences may result in discrepancies in some areas that cannot be thoroughly calibrated by PSM, such as liver function, the presence of steatosis, and use of concomitant drugs. Second, even though lamivudine-resistant patients were excluded based on medical records, there is a small chance that such patients were included in PSM studies, potentially leading to bias. Although some studies have greater BR among patients treated with TAF than those receiving TDF [38,39], this tendency was not found in the current NMA. Since the present study only compared VR and BR over 144 weeks, outcomes for longer treatment durations should be compared to better understand the discrepancies between these outcomes.
Our study has several limitations. As stated earlier, current analyses only included treatment-naïve patients, which resulted in exclusion of initial phase 3 clinical trials of TAF and TDF that included both naïve and experienced patients [40,41]. As a result, only a few RCTs were available to evaluate the effectiveness of the four NAs using NMA. There was no RCT assessing TAF efficacy and only a few RCTs assessing BSV, resulting in insufficient data for both BSV and TAF. This could be attributed in part to the relatively recent introduction of these two drugs and could also be influenced by publication bias. In the same context, the rankogram highlighting BSV as the optimal choice for achieving a 48SR must be interpreted cautiously as it is based on limited evidence. Additional studies are imperative to enhance the level of evidence supporting the results obtained in our study. Second, because the included studies only examined short-term outcomes, no long-term outcomes such as HCC incidence, liver transplantation, or death could be addressed. Lack of analyses on safety issues, such as renal impairment and osteoporosis, was another limitation of our study. Furthermore, there were variations observed among studies in terms of the normal value for transaminase level and the detectable threshold of HBV DNA levels. These disparities introduce the potential for bias in the NMA. Last, the studies included in the NMA were all conducted in Asia-Pacific countries. Since genotypes B and C are predominant in these regions, it is uncertain whether the findings can be generalized to other regions where genotype A or D is predominant. While several observational studies outside the Asia-Pacific region have reported results consistent with our findings on VR, their inclusion in our NMA was precluded due to methodological constraints [42,43].
In conclusion, the present study found that TDF and TAF may be preferable to ETV in terms of VR, and ETV showed superior performance in terms of BR. Our analyses can serve as a useful reference for NA selection strategies for treatment-naïve CHB patients. Further analyses of high-quality RCTs and long-term outcomes are needed to better understand the efficacy of each of the NA drugs and to guide clinicians in selecting the appropriate option.
 PDF Links
 PubReader
 ePub Link
 Full text via DOI
 Download Citation
 Supplement table 1
 Print
Print


