


INTRODUCTION
The most common cause of joint pain and disability with aging is osteoarthritis (OA) of the knee and is associated with a heavy disease burden. In national population-based studies, the prevalence of knee OA and symptomatic knee OA in the middle-aged or elderly individuals was approximately 33.3 and 12.4% in Korea and 37.4 and 12.1% in the USA, respectively [1,2]. According to a primary care-based registry in Belgium, the prevalence of knee OA patients seeking medical care has been increasing between 1996 and 2015 with an annual percentage change of 2.5%. Additionally, an upward trend for mean disease counts per patient and prescription of acetaminophen, weak opioid, and oral non-steroid anti-inflammatory drugs (NSAID) has been observed, which indicates an increasing comorbidity and disease burden [3].
Furthermore, knee OA is also associated with a higher mortality. Community or population-based studies revealed an association between knee OA and all-cause and cardiovascular disease (CVD) mortality [4,5]. An association between knee pain and mortality independent of radiographic knee OA (ROA) has been demonstrated in studies that included a negative control group of participants with knee pain in the absence of ROA or separated symptomatic and asymptomatic OA [6ŌĆō8]. According to these studies, pain is the most biologically plausible mediating pathway, leading to a sedentary lifestyle, reduced physical activity and cardiovascular fitness, and early mortality [9].
A dilemma in inferring the causality of knee OA to mortality is that metabolic risk factors such as obesity and hypertension are strongly associated with OA and CVD mortality. Evidence has shown that metabolic dysregulation is causal to OA [10], which indicates that metabolic risk factors are important confounding factors. However, regression analysis may not reliably adjust for substantial differences in the distribution of metabolic risk factors in the control and knee OA group, especially in the symptomatic ROA group that has the strongest association with metabolic dysregulation [11]. Therefore, prior studies that used regression analysis might have overestimated the association between knee OA and CVD mortality. Additionally, there was a possibility that the estimates were biased due to index event bias. An index event bias is a type of selection bias, also referred to as collider stratification bias, that occurs during conditioning on the common effects of independent risk factors [12], where a spurious association between risk factors is present and employs bias on the association between risk factors and outcomes in index populations. Because both OA and CVD share metabolic risk factors, conditioning on OA could influence the distribution of unmeasured risk factors and produce bias in the association of risk factors and CVD mortality unless there is a stringent and thorough accounting of all shared risk factors. Indeed, a study on knee OA and mortality showed the presence of the obesity paradox, an inverse and protective association of obesity and mortality in knee OA. [4]. Some reports have elucidated that a matching-based analysis, such as a propensity score matching, eliminated the obesity paradox [13,14].
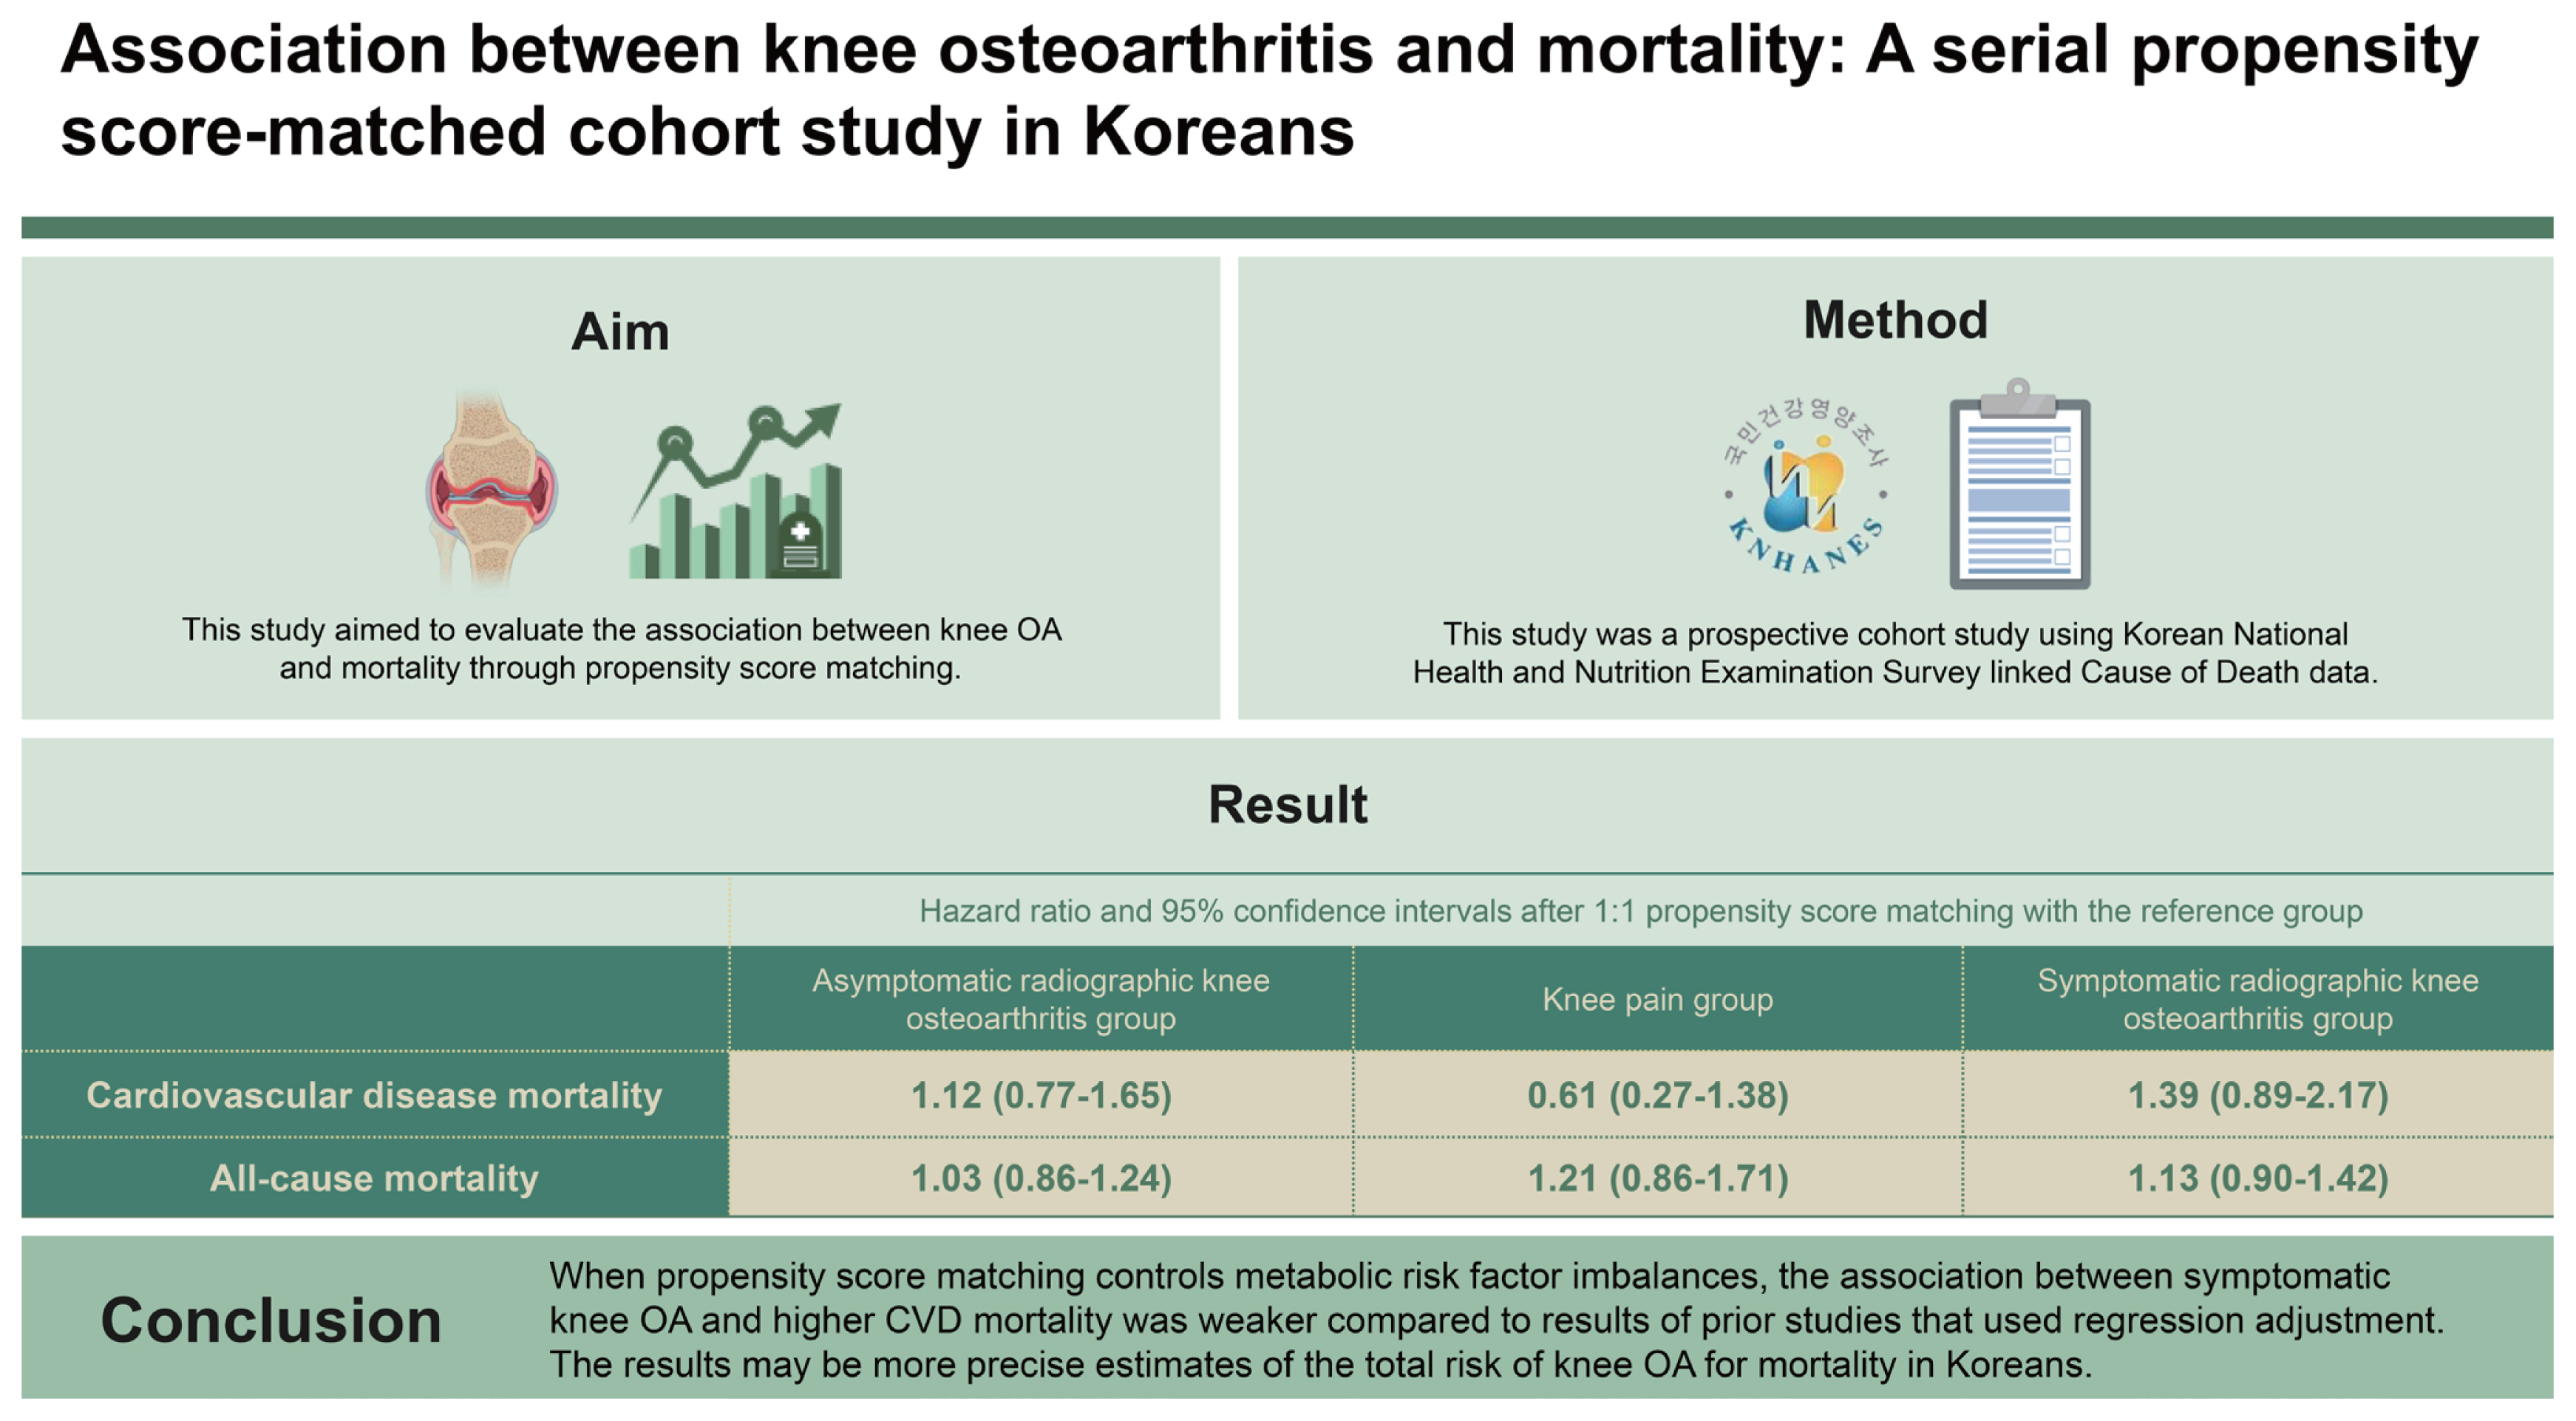
In this study, we aimed to estimate the total effect of knee OA on all-cause and cause-specific mortality in three sequential propensity score-matched cohorts of asymptomatic ROA, symptomatic ROA, and a negative exposure control group with knee pain but without ROA [15].
METHODS
Study design and participants
This study was a cohort study that linked data from the Fifth and Sixth Korean National Health and Nutrition Examination Survey (KNHANES 2010ŌĆō2013) to cause of death data by Statistics Korea. The KNHANES, for which the participants were selected through systematic sampling, is a South Korean nationwide health and nutrition survey of children, adolescents, and adults. In a previous study, details of the sample selection process were reported [1]. The overall participation rates were 81.9, 80.4, 80.8, and 79.3% from 2010 to 2013, respectively. Plain radiographs of both knees were performed for all participants aged at least 50 years, and those who underwent radiographic examination were eligible for this study. A written informed consent was provided by all participants for both participation in the survey and use of their data for research purposes. The Institutional Review Board of Inje University Haeundae Paik Hospital approved this study (file number 2021-06-024).
Health interview and examination
A health interview was conducted to obtain data on age, sex, household income, history of stroke or myocardial infarction, and smoking history. The Korean version of the International Physical Activity Questionnaire (self-administered last 7-day short format) was used to measure physical activity at three levels: mild, moderate, and vigorous intensities. The metabolic equivalent of task (MET) estimates for each physical activity intensity were 3.3, 4.0, and 8.0, respectively [16]. MET for physical activity per week was calculated by adding METs for the three physical activity levels which was calculated by multiplying the MET estimate for each level of physical activity, number of days per week, and hours per day engaged in each level of physical activity. Mobility impairment was measured using the mobility domain of the Korean version of the European quality of life questionnaire (EQ-5D) [17]. The EQ-5D is a composite measure of health outcomes that consists of five domains: mobility, self-care, daily activity, pain/discomfort, and anxiety/depression. The mobility index comprised the following three statements, and the participants selected the statement that best described them: ŌĆ£I have no problems in walking about,ŌĆØ ŌĆ£I have some problems in walking about,ŌĆØ and ŌĆ£I am confined to bed.ŌĆØ
Data from anthropometric measurements (height and weight) obtained during the health examination were used. Body mass index (BMI) was categorized into the following groups: reference weight (BMI < 25 kg/m2), overweight (BMI 25ŌĆō29.9 kg/m2), and obesity (BMI Ōēź 30 kg/m2) [18]. Blood pressure was measured by experienced nurses using a mercury sphygmomanometer (Baumanometer Wall Unit 33[0850]; Baum, Copiague, NY, USA) and stethoscope (Littmann Cardiology 3; 3 M, Maplewood, NJ, USA). Hypertension was defined as a systolic blood pressure of Ōēź 140 mmHg, diastolic blood pressure of Ōēź 90 mmHg, or under-going treatment [19]. Moreover, 12-h fasting blood samples were collected and refrigerated at 2ŌĆō8┬░C before transfer to a central testing facility for analysis within 24 hours of sampling. Serum fasting glucose, total cholesterol, and high density lipoprotein-cholesterol were measured on a Hitachi Automatic Analyzer 7600ŌĆō210 (Hitachi, Tokyo, Japan) in 2010ŌĆō2012 and on COBAS 8000 C702 (Roche, Mannheim, Germany) in 2013. Diabetes was defined as a fasting blood glucose Ōēź 126 mg/dL or undergoing treatment [20].
Assessment of radiographic features of knee osteoarthritis and knee pain
An SD3000 Synchro Stand (SYFM, Namyangju, Korea) was used to acquire bilateral anteroposterior, lateral (30┬░ flexion), and weight-bearing anteroposterior plain radiographs of the knees. The radiographic features of knee OA were assessed using the KellgrenŌĆōLawrence grade [21]. In 2010 and 2011, two radiologists evaluated and graded the radiographic digital images. The inter-rater agreement between the two radiologists was 57.4 and 64.0%, with an unweighted CohenŌĆÖs kappa coefficient of 0.43 and 0.44 in 2010 and 2011, respectively. In 2012, one of the two radiologists (a senior musculoskeletal radiologist) read all images, and 5% of the images were read by another radiologist. The inter-rater agreement was 67.0%, and the linear-weighted kappa was 0.74. In 2013, 10% of the images were sampled, and the inter-rater agreement and the linear-weighted kappa were 61.7% and 0.64, respectively. ROA was defined as the presence of KellgrenŌĆōLawrence grade Ōēź 2 radiographic features. Data regarding knee pain were obtained through a health interview. Knee pain was defined as the presence of knee pain for more than 30 days during the past 3 months. Symptomatic ROA was defined as the presence of both ROA knee pain. The normal group was defined as absence of both ROA and knee pain.
Assessment of mortality and cause-specific death
This study used data on mortality based on a death certificate provided by Statistics Korea (KNHANES linked cause of death data version 1.2). Causes of death were coded according to the seventh edition of the Korean Standard Classification of Diseases which was based on the International Classification of Disease tenth revision. Death from nonaccidental causes (A00ŌĆōR99) was ascertained. Additionally, data on cause-specific death from CVD (I00ŌĆōI99) and malignant neoplasm (C00ŌĆōC97) were used.
Statistical analysis
Data were presented as mean and standard deviation (SD) for continuous variables and count and weighted percentage for categorical variables. To account for the complex survey design and produce nationally presentative estimates, all comparison and analyses were weighted. Sampling weights were generated by considering the complex sample design and nonresponse rate of the target population. PROC SURVEYFREQ and PROC SURVEYMEANS were used to calculate the weighted prevalence and the mean and SD, respectively. Propensity score matching with the Mahalanobis distance at the caliper width of 0.2 was conducted to reduce bias due to confounding variables, including age, sex, obesity, hypertension, diabetes, total cholesterol, household income, history of stroke, and history of myocardial infarction based on the causal diagram of this study (Supplementary Fig. 1). The mortality was estimated as all-cause and cause-specific death cases per 1,000 person-years, and the Cox proportional hazard model was applied to estimate the hazard ratio (HR) and 95% confidence interval (CI) in the knee state groups. The KaplanŌĆōMeier curve was used to assess for differences between knee state groups. The index date of follow-up was the date when participants participated in the survey. The index date of death was defined as the median day (fifteenth) of the month of death because only data on the year and month of death were released to researchers to protect private information. Sensitivity analysis was performed on the data excluding those who died a year after observation. SAS version 9.4 (SAS Institute, Cary, NC, USA) and R software (version 4.1; R Foundation for Statistical Computing, Vienna, Austria) were used for all data analyses. Statistical significance was set at a p value < 0.05.
RESULTS
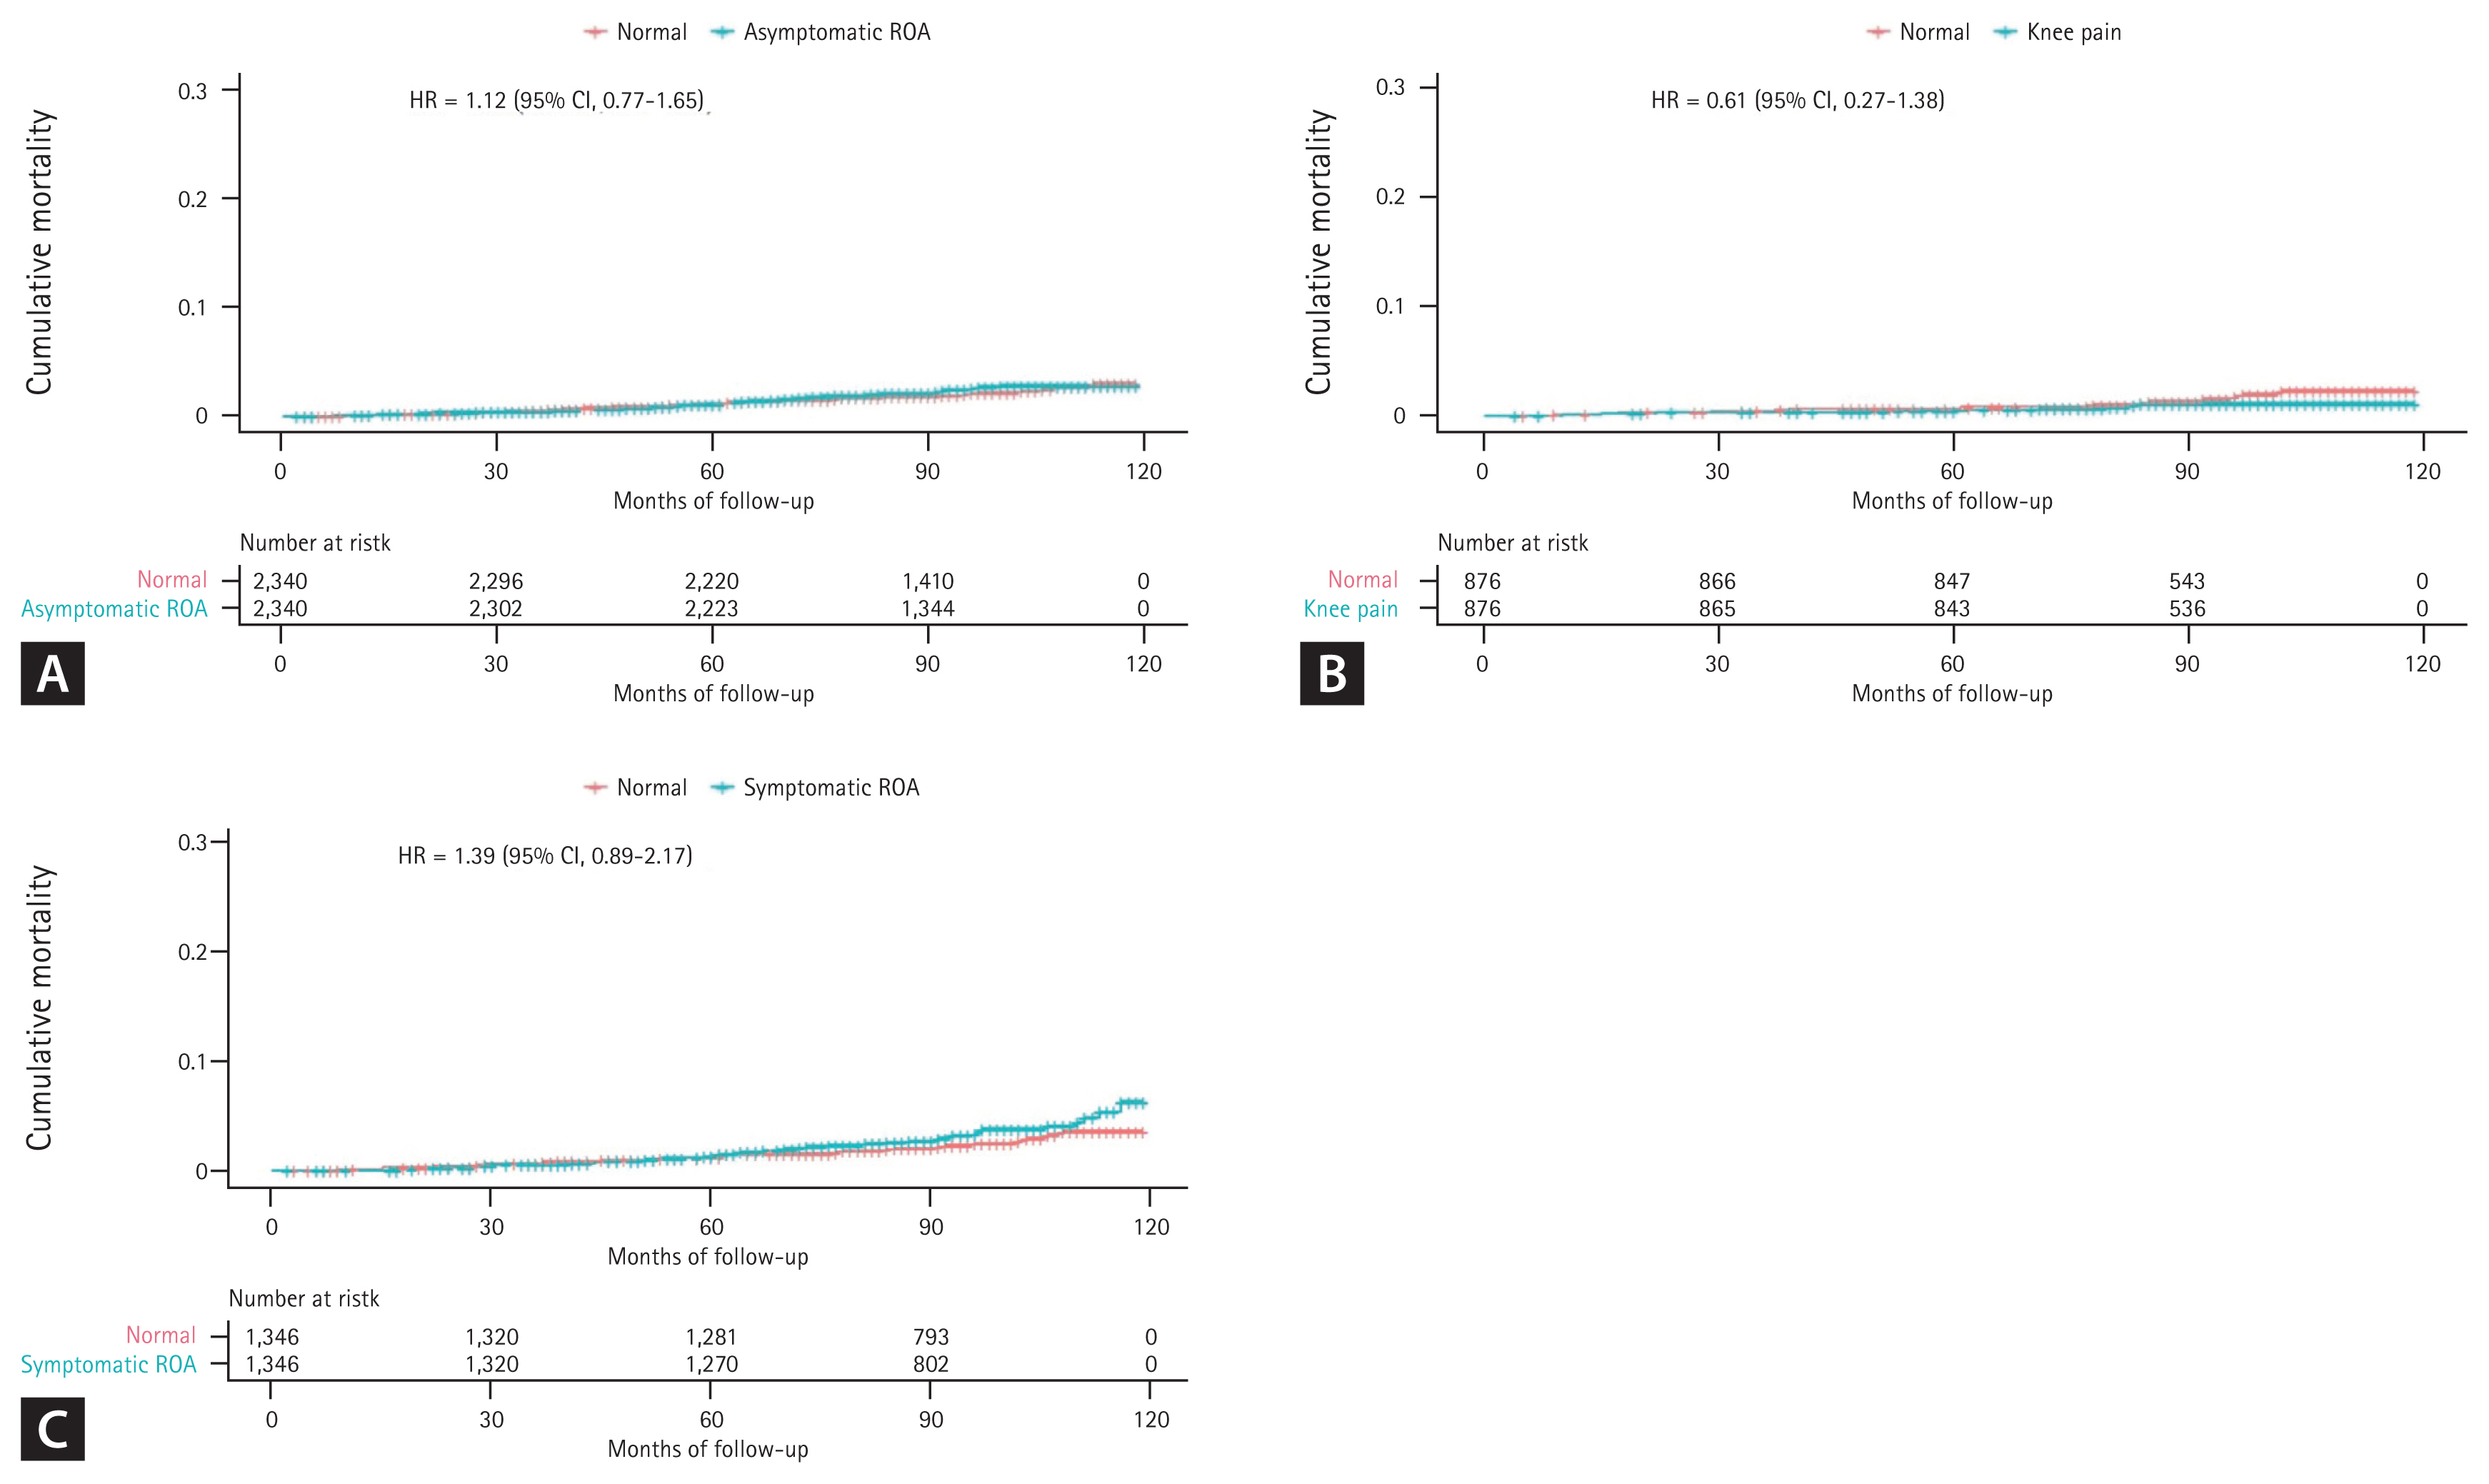
A total of 13,087 participants were included, and the prevalence for each group was asymptomatic ROA, 22.1% (20.9ŌĆō23.2%); knee pain, 8.5% (7.8ŌĆō9.2%); and symptomatic ROA, 12.6% (11.7ŌĆō13.4%). The median and range of follow-up duration were 95 months (0ŌĆō124 mo), with a total observation period of 103,330 person-years. In the observation period, a total of 1,128 deaths were documented (Supplementary Table 1). The mortality rate was higher in the knee OA groups. The all-cause mortality rate was 0.87, 1.32, 1.08, and 1.48 per 1,000 patient-year in the normal, asymptomatic ROA, knee pain, and symptomatic ROA groups, respectively. A total of 9,124 participants were included after propensity score matching. There were 2,340 pairs in the asymptomatic ROA group, 876 in the knee pain group, and 1,346 in the symptomatic ROA group.
Prior to propensity score matching, the mean age and proportion of female were higher in the asymptomatic ROA, knee pain, and symptomatic ROA groups than in the normal group (Table 1). The proportion of participants with mobility impairment was higher in the asymptomatic ROA, knee pain, and symptomatic ROA groups. However, no difference in the physical activity level was found. The proportion of current smoker and high household income was lower in the three groups than in the normal group. Among the metabolic risk factors, obesity, hypertension, and diabetes were associated with asymptomatic and symptomatic ROA. After matching, the distribution of metabolic risk factors was mostly balanced between the matched groups (standardized difference < 0.10) (Table 2). However, because of the remarkable imbalances between the normal group and symptomatic ROA group, age, sex, and prevalence of obesity failed to completely match. Notably, an imbalance in mobility was still present in all the three knee state groups after matching because it was considered a mediating pathway and was not intended to be controlled (Supplementary Fig. 1).
In the matched cohorts, no significant association was found between all-cause mortality and any group (Table 3, Supplementary Fig. 2). Regarding cause-specific mortality, there was a trend for a higher CVD mortality in the symptomatic ROA group (HR 1.39 [95% CI 0.89ŌĆō2.17], p = 0.145). Asymptomatic ROA and knee pain were not associated with CVD mortality (Fig. 1). Cancer mortality was not associated with any group (Supplementary Fig. 3). In the sensitivity analysis, a closer trend for a higher CVD mortality was found in the symptomatic ROA group (Table 3). The risk estimate was HR 1.48 (CI 0.94ŌĆō2.33, p = 0.090).
DISCUSSION
This study aimed to examine the association between knee OA and mortality controlling imbalances in the distribution of risk factors through propensity score matching, and a trend for the association between symptomatic ROA and higher CVD mortality was noted, although it was not statistically significant. Asymptomatic ROA and knee pain were not associated with a higher CVD mortality, and no association was found between any group and cancer mortality. Results from previous studies that used regression modeling to control confounding factors differed and showed an association between knee pain and higher mortality regardless of presence of ROA [9].
Although symptomatic ROA revealed trends for higher CVD mortality in this study, the strength of the association was weaker than expected. Additionally, considering that impairment in mobility, a potential mediating pathway, was left unadjusted and that NSAIDs, a known mediator of CVD mortality in knee OA [22], could not be adjusted in this study, the results suggest that the known association between symptomatic knee OA and CVD mortality may largely be explained by metabolic risk factors as confounding variables and that the direct effect of symptomatic knee OA to CVD mortality might not be high. Observational studies support this inference. The Ulm study examined long-term mortality in patients with hip or knee OA who underwent total joint replacement arthroplasty (TJR) [23]. In the study, long-term mortality was not associated with a 12-month postoperative improvement in joint-specific pain and function but with postoperative impairment in general function, suggesting that functional impairments in daily living that are influenced by comorbidities are more important for long-term survival. Furthermore, an interventional study that examines the effect of TJR on long-term survival has not been conducted. Although observational studies showed beneficial effects of TJR, interpretation of the results was limited by selection bias [24,25].
If metabolic dysregulation is a mediating pathway to a higher CVD mortality in knee OA, the results of this study may be an underestimation of the effect of knee OA on CVD mortality. Evidence supports a biologically plausible hypothesis that a painful knee decreases physical activity and leads to metabolic dysregulation such as metabolic syndrome [26], which is a phenotype susceptible for CVD [27]. The weakest point in the hypothesis, we believe, is whether painful knee causes decreased physical activity, which was not the case in this study. In accordance with this finding, a cross-sectional study showed no difference in the level of physical activity according to the presence of pain, suggesting that pain may not be the barriers to physical activity in people with knee OA [28]. Although a systematic review and clinical practice guidelines support exercise for the short-term improvement of pain and function in knee OA [29ŌĆō31], evidence is lacking regarding its effect on physical activity level and long-term cardiovascular fitness. Epidemiologically, to address the reciprocal causation of metabolic risk factors such as obesity being both a confounder and a mediator, multiple time-specific measurements of the variables are necessary [32]. As a preamble to such a long-term observational study, a longitudinal study on the changes of metabolic risk factors in patients with knee OA compared with normal can be considered.
The absence of an association between knee pain in the absence of ROA and mortality was conflicting with the results of other prior studies that showed a higher mortality in patients with a painful knee regardless of structural features of OA [6,9]. Regarding the difference, we believe that this study might have an insufficient observation for a valid estimation of true association. The prevalence of knee-pain-only phenotype was lower than the other groups, and the participants in the group had a weaker association with metabolic risk factors than those with ROA and developed fewer mortality in the observation period. Second, ethnic difference may explain the distinction. To the best of our knowledge, a painful knee independent of structural features of knee OA has not been shown to be associated with higher mortality in East Asian population, and further research is warranted.
In this study, variables were weighted for the complex survey design, and risk factors other than the mediating variables were balanced through propensity score matching. Therefore, the results may have less bias and may have more precise estimates of total effect of knee OA on mortality in Koreans. In addition, all the participants in the three knee state groups could be matched, minimizing changes in the target population. However, this study had limitations. First, although a 1:1 matching was performed for each case in the three groups, owing to the large imbalance in the distribution of risk factors between the normal and symptomatic ROA group, a complete balance could not be attained in age, sex, and obesity variables. Although the difference was small, it could have influenced the results. Mendelian randomization studies may be a solution to such intractable confounding, and identification of strong instrumental variables for knee OA is prerequisite for such studies [33]. Second, ROA was defined as a bilateral KellgrenŌĆōLawrence grade of Ōēź 2, and analysis using a difference definition (such as unilateral knee OA) could not be performed. Conceptually, OA could be divided to metabolic, senile, and mechanical clusters, and the study results may explain the so-called metabolic knee OA better with limited validity in other clusters [34]. Third, the CVD profile in Asians including Koreans is different from Western people, where stroke is more common and ischemic heart disease is less common as was also found in this study (Supplementary Table 1). This could be another factor limiting external validity of this study, and the results require validation in other ethnic groups. Lastly, prevalent user design was used in this study, which means that participants were included in this study when they participated in the survey and not on the date when knee OA developed or was diagnosed. Prevalent user design is prone to errors originating from selection bias such as immortal time bias and inaccurate adjustment of baseline covariate. In addition, the date of death was defined as the fifteenth of the month of death, because only data on the year and month of death were released to researchers. As the hypothesis that participants with knee OA tend to die on a specific date of a month does not hold, it is unlikely that the limitation has biased the results of this study; however, it could have reduced the statistical power of this study.
In conclusion, when imbalances in risk factors were controlled by propensity score matching, trends for a higher CVD mortality in the symptomatic ROA group were observed, albeit not statistically significant. Asymptomatic ROA and painful knee without radiographic features of OA was not associated with a higher mortality. Assuming that matching is a stronger method to control confounding variables and bias, the results may be more precise estimates of the total risk of knee OA for mortality. Further research on the mediating effects of metabolic dysregulation in the association between OA and CVD mortality is necessary. Ethnic difference also merits further research.
KEY MESSAGE
1. This study examined the association between knee osteoarthritis and mortality for the first time in Koreans, and trends for a higher cardiovascular disease mortality in symptomatic knee osteoarthritis group were found, associations which were weaker than prior studies that used regression analysis.
2. Evidence suggests that matching-based methods control confounding or index event bias. Therefore, the study results, which used propensity score matching, may have more precise estimates of total risk for mortality associated with knee osteoarthritis.
3. The issue of causality and modifiable risk of osteoarthritis for mortality merits further research on the mediating effects of metabolic dysregulation and ethnic difference.
 PDF Links
 PubReader
 ePub Link
 Full text via DOI
 Download Citation
 Supplement figure 1
 Print
Print


