 |
 |
| Korean J Intern Med > Volume 35(5); 2020 > Article |
|
Abstract
Background/Aims
Methods
Results
Conclusions
Supplementary Materials
Supplementary Table 3.
Supplementary Table 5.
Supplementary Table 6.
Supplementary Table 7.
Supplementary Table 9.
Supplementary Table 10.
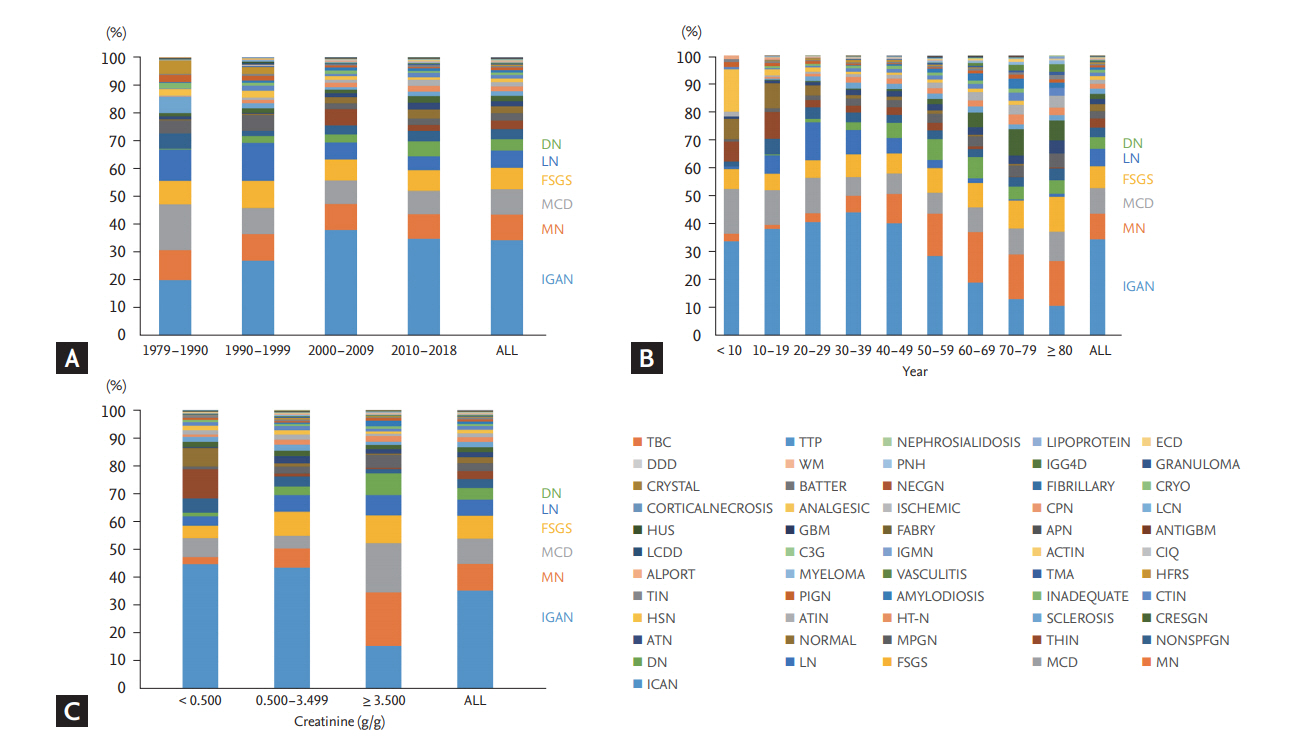
Figure 1.

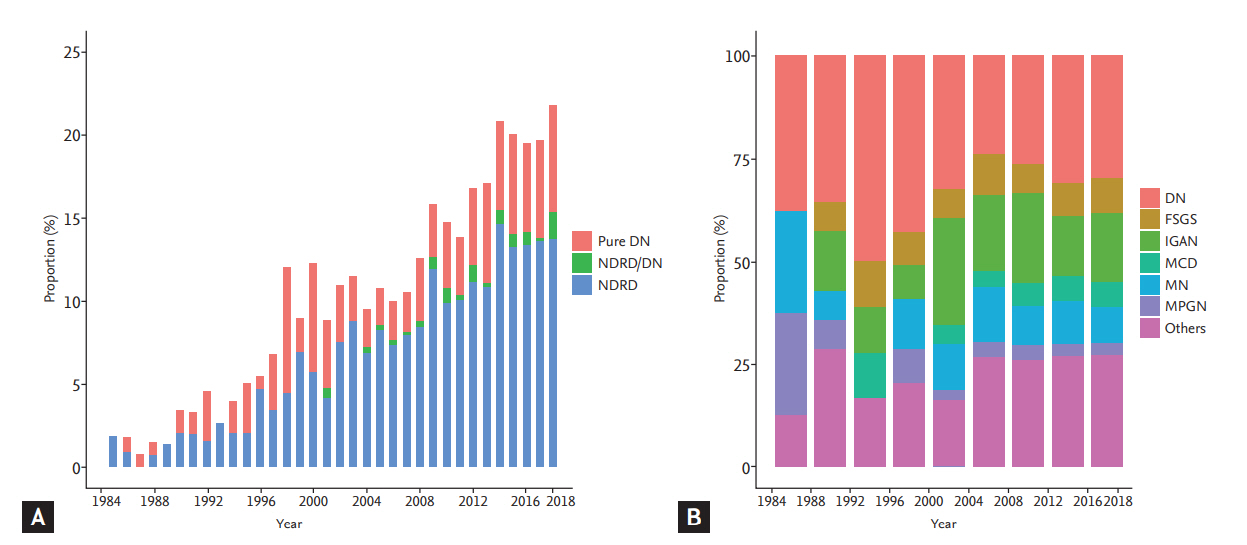
Figure 2.

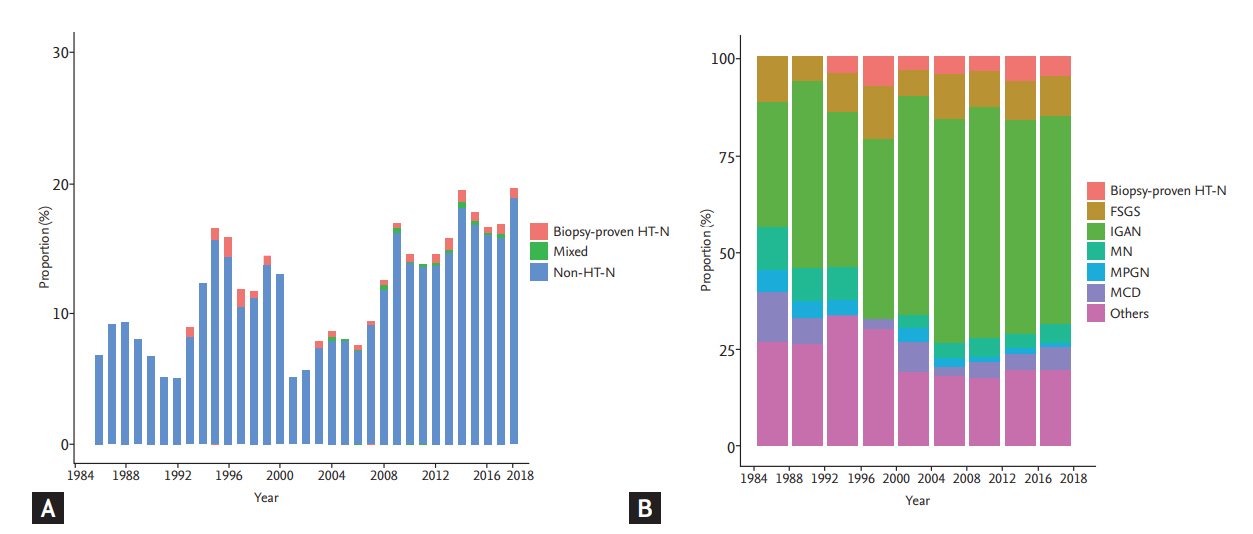
Figure 3.

Table 1.
| Group | Pathologic diagnosis | Number | % |
|---|---|---|---|
| Glomerulonephritis | IgA nephropathy (IGAN) | 7,586 | 34.17 |
| Membraous nephropathy (MN) | 2,035 | 9.17 | |
| Minimal change disease (MCD) | 2,028 | 9.13 | |
| Focal segmental glomerulosclerosis (FSGS) | 1,698 | 7.65 | |
| Lupus nephritis (LN) | 1,398 | 6.30 | |
| Diabetic nephropathy (DN) | 887 | 3.99 | |
| Membranoproliferative glomerulonephritis (MPGN)a | 585 | 2.63 | |
| Crescentic glomerulonephritis (CRESGN) | 410 | 1.85 | |
| Henoch-Schonlein nephritis (HSN) | 290 | 1.31 | |
| Post-infectious glomerulonephritis (PIGN)b | 177 | 0.80 | |
| Thrombotic microangiopathy (TMA)c | 75 | 0.34 | |
| Vasculitis | 66 | 0.30 | |
| C1q nephropathy (C1QN) | 51 | 0.23 | |
| IgM nephropathy (IGMN) | 40 | 0.18 | |
| C3 glomerulopathy (C3G) | 34 | 0.15 | |
| Anti-glomerular basement membrane nephritis (ANTIGBM) | 19 | 0.09 | |
| Hemolytic uremic syndrome (HUS) | 14 | 0.06 | |
| Liver cirrhosis-related nephropathy (LCN) | 12 | 0.05 | |
| Cryoglobulinemic glomerulonephritis (CRYO) | 5 | 0.02 | |
| Nectrotizing glomerulonephritis (NECGN) | 3 | 0.01 | |
| IgG4 related disease (IGG4D) | 2 | 0.01 | |
| Paroxysmal nocturanl hemoglobinuria (PNH) | 2 | 0.01 | |
| Dense deposition disease (DDD) | 1 | 0.00 | |
| Thrombotic thrombocytopenic purpura (TTP) | 1 | 0.00 | |
| Tubulointerstitial lesion | Acute tubular necrosis (ATN) | 412 | 1.86 |
| Acute tubulointerstitial nephritis (ATIN) | 340 | 1.53 | |
| Chronic tubulointerstitial nephritis (CTIN) | 276 | 1.24 | |
| Tubulointerstitial nephritis (TIN) | 127 | 0.57 | |
| Hemorrahgic fever with renal syndrome (HFRS) | 110 | 0.50 | |
| Acute and chronic tubulointerstitial nephritis (ACTIN) | 50 | 0.23 | |
| Batter syndrome (BATTER) | 2 | 0.01 | |
| Interstitial granuloma (GRANULOMA) | 2 | 0.01 | |
| Glomerular basement membrane abnormality (GBM) lesion | Thin membrane disease (THIN) | 690 | 3.11 |
| Alport’s syndrome (ALPORT) | 58 | 0.26 | |
| Non-specified glomerular basement membrane abnormality (GBM) | 14 | 0.06 | |
| Paraproteinemia-related lesion | Amyloidosis | 196 | 0.88 |
| Myeloma kidney (MYELOMA) | 63 | 0.28 | |
| Light chain deposition disease (LCDD) | 35 | 0.16 | |
| Fibrillary glomerulonephritis (FIBRILLARY) | 5 | 0.02 | |
| Waldenstrom’s macroglobulinemia related proliferative glomerulonephritis (WM) | 2 | 0.01 | |
| Ischemic lesion | Hypertensive nephrosclerosis (HT-N) | 372 | 1.68 |
| Ischemic nephropathy (ISCHEMIC) | 7 | 0.03 | |
| Cortical necrosis (CORTICALNECROSIS) | 6 | 0.03 | |
| Miscellaneous lesion | Acute pyelonephritis (APN) | 15 | 0.07 |
| Fabry’s disease (FABRY) | 15 | 0.07 | |
| Chronic pyelonephritis (CPN) | 11 | 0.05 | |
| Analgesic nephropathy (ANALGESIC) | 6 | 0.03 | |
| Crystal nephropathy (CRYSTAL) | 2 | 0.01 | |
| Tuberculosis (TBC) | 1 | 0.00 | |
| Erdheim-chester disease (ECD) | 1 | 0.00 | |
| Lipoprotein nephropathy (LIPOPROTEIN) | 1 | 0.00 | |
| Nephrosialidosis | 1 | 0.00 | |
| Not specified lesion | No abnormality (NORMAL) | 546 | 2.46 |
| Diffuse global sclerosis (SCLEROSIS)d | 393 | 1.77 | |
| Non-specific glomerulonephritis without mesangial proliferative lesion (NONSPFGN_MESE)e | 550 | 2.48 | |
| Non-specific glomerulonephritis with mesangial proliferative lesion (NONSPFGN_MESP)f | 260 | 1.17 | |
| Inadequate sample | Inadequate sample (INADEQUATE)g | 215 | 0.97 |
| Sum | 22,203 | 100.00 |
Table 2.
| Period of biopsy | Totala (n = 21,426) | 1979–1989 (n = 1,598) | 1990–1999 (n = 1,392) | 2000–2009 (n = 7,252) | 2010–2018 (n = 11,065) | p value | |
|---|---|---|---|---|---|---|---|
| Annual biopsy rate, p.m.p./yr | 11.59 | 3.61 | 3.11 | 15.06 | 24.26 | ||
| Age, yr | 42.1 ± 17.7 | 32.5 ± 12.7 | 38.7 ± 14.7 | 40.1 ± 17.0 | 45.1 ± 18.3 | < 0.001 | |
| Children | 976 (4.6) | 162 (10.5) | 59 (4.3) | 354 (4.9) | 401 (3.6) | < 0.001 | |
| Male sex | 11,565 (54.0) | 933 (58.4) | 764 (54.9) | 3,876 (53.5) | 5,909 (53.4) | 0.002 | |
| Hypertension | 10,994 (53.0) | 837 (66.9) | 704 (52.3) | 3,135 (43.7) | 6,254 (57.5) | < 0.001 | |
| Diabetes | 2,833 (14.0) | 18 (2.0) | 78 (5.9) | 803 (11.2) | 1,932 (17.9) | < 0.001 | |
| SBP, mmHg | 127.3 ± 19.4 | 131.1 ± 21.8 | 130.0 ± 21.8 | 125.2 ± 18.4 | 127.6 ± 19.1 | < 0.001 | |
| DBP, mmHg | 78.6 ± 13.4 | 88.2 ± 16.2 | 84.2 ± 13.8 | 77.7 ± 12.2 | 77.0 ± 12.7 | < 0.001 | |
| Albumin, g/dL | 3.4 ± 0.9 | 3.0 ± 1.0 | 3.0 ± 0.9 | 3.6 ± 0.9 | 3.5 ± 0.9 | < 0.001 | |
| Hemoglobin, g/dL | 12.6 ± 2.4 | 13.1 ± 2.8 | 12.3 ± 2.7 | 12.8 ± 2.3 | 12.5 ± 2.3 | < 0.001 | |
| eGFR, mL/min/1.73 m2 | 77.1 ± 60.4 | 62.3 ± 33.2 | 66.9 ± 37.8 | 80.0 ± 82.8 | 78.3 ± 45.9 | < 0.001 | |
| ≥ 90 | 7,664 (37.1) | 243 (17.6) | 357 (26.8) | 2,745 (38.7) | 4,319 (39.9) | ||
| 60–89 | 5,553 (26.9) | 510 (36.9) | 429 (32.2) | 2,095 (29.5) | 2,519 (23.2) | ||
| 45–59 | 2,294 (11.1) | 231 (16.7) | 156 (11.7) | 758 (10.7) | 1,149 (10.6) | ||
| 30–44 | 1,952 (9.5) | 150 (10.8) | 135 (10.1) | 592 (8.3) | 1075 (9.9) | ||
| 15–29 | 1,690 (8.2) | 110 (8.0) | 124 (9.3) | 475 (6.7) | 981 (9.1) | ||
| < 15 | 1,492 (7.2) | 139 (10.1) | 130 (9.8) | 429 (6.0) | 794 (7.3) | ||
| UPCR, g/g Cr | 3.3 ± 4.2 | 3.9 ± 4.6 | 4.5 ± 4.7 | 3.0 ± 3.9 | 3.3 ± 4.1 | < 0.001 | |
| Neprotic syndrome | 3,420 (17.5) | 377 (27.3) | 423 (32.5) | 845 (13.2) | 1750 (16.9) | < 0.001 | |
Table 3.
| Characteristic | NDRD | NDRD/DN | Pure DN | p value |
|---|---|---|---|---|
| Number | 1,932 | 91 | 790 | |
| Age, yr | 57.4 ± 14.2 | 49.7 ± 16.7 | 52.9 ± 12.7 | < 0.001a,b |
| Male sex | 1,120 (58.0) | 51 (56.0) | 509 (64.4) | 0.01a |
| Hypertension | 1,563 (81.0) | 73 (80.2) | 676 (86.0) | 0.01a |
| Period of biopsy | 0.01a | |||
| 1979–1989 | 13 (0.7) | - | 5 (0.6) | |
| 1990–1999 | 43 (2.2) | - | 34 (4.3) | |
| 2000–2009 | 575 (29.8) | 22 (24.2) | 200 (25.3) | |
| 2010–2018 | 1,301 (67.3) | 69 (75.8) | 551 (69.7) | |
| SBP, mmHg | 130.1 ± 20.5 | 133.7 ± 20.7 | 140.5 ± 23.0 | < 0.001a,c |
| DBP, mmHg | 77.5 ± 12.5 | 78.8 ± 12.3 | 81.2 ± 12.9 | < 0.001a |
| eGFR, mL/min/1.73 m2 | 57.9 ± 51.3 | 63.2 ± 41.8 | 47.1 ± 38.7 | < 0.001a,c |
| Albumin, g/dL | 3.2 ± 0.9 | 3.3 ± 0.7 | 3.1 ± 0.7 | < 0.001a,c |
| Hemoglobin, g/dL | 11.8 ± 2.4 | 11.9 ± 2.5 | 10.7 ± 2.2 | < 0.001a,c |
| UPCR, g/g Cr | 4.6 ± 4.9 | 4.1 ± 4.7 | 6.1 ± 5.1 | <0.001a,c |
Values are presented as mean ± SD or number (%). Adjusted p values for multiple comparisons were obtained using the Tukey-Kramer method.
NDRD, non-diabetic renal disease; DN, diabetic nephropathy; SBP, systolic blood pressure; DBP, diastolic blood pressure; eGFR, estimated glomerular filtration rate; UPCR, urine protein-to-creatinine ratio.
Table 4.
HRs were adjusted for age, sex, period of kidney biopsy, presence of hypertension, estimated glomerular filtration rate, serum albumin, hemoglobin, urine protein-to-creatinine ratio, systolic blood pressure, and diastolic blood pressure.
B, beta coefficients; HR, hazard ratio; CI, confidence interval; ESKD, end-stage kidney disease; DN, diabetic nephropathy; NDRD, non-diabetic renal disease.
Table 5.
| Characteristic | Biopsy-proven HT-N | Mixeda | Non-HT-Nb | p value |
|---|---|---|---|---|
| Number | 103 | 39 | 2,785 | |
| Age, yr | 44.7 ± 13.7 | 42.9 ± 19.3 | 43.6 ± 15.1 | 0.54 |
| Male sex | 70 (68.0) | 24 (61.5) | 1,599 (57.4) | 0.09 |
| Period of biopsy | 0.01c | |||
| 1979–1989 | - | - | 230 (8.3) | |
| 1990–1999 | 8 (7.8) | - | 139 (5.0) | |
| 2000–2009 | 22 (21.4) | 12 (30.8) | 708 (25.4) | |
| 2010–2018 | 73 (70.9) | 27 (69.2) | 1,708 (61.3) | |
| SBP, mmHg | 136.6 ± 21.1 | 132.8 ± 21.9 | 134.0 ± 18.3 | 0.24 |
| DBP, mmHg | 84.2 ± 15.1 | 81.4 ± 14.1 | 83.7 ± 13.3 | 0.95 |
| Pulse pressure, mmHg | 52.4 ± 13.8 | 51.4 ± 12.8 | 50.3 ± 13.5 | 0.12 |
| eGFR, mL/min/1.73 m2 | 43.2 ± 35.4 | 81.2 ± 55.8 | 73.7 ± 37.2 | < 0.001d,e |
| Albumin, g/dL | 3.9 ± 0.5 | 4.0 ± 0.5 | 3.9 ± 0.6 | 0.35 |
| Hemoglobin, g/dL | 12.5 ± 1.9 | 13.1 ± 2.5 | 13.1 ± 2.2 | 0.01c |
| UPCR, g/g Cr | 0.8 ± 0.6 | 0.7 ± 0.5 | 0.9 ± 0.5 | 0.37 |
Values are presented as mean ± SD or number (%). The biopsy-proven HT-N group represents patients with only HT-N as pathologic diagnosis. Adjusted p values for multiple comparisons were obtained using the Tukey-Kramer method.
HT-N, hypertensive nephrosclerosis; SBP, systolic blood pressure; DBP, diastolic blood pressure; eGFR, estimated glomerular filtration rate; UPCR, urine protein-to-creatinine ratio.
Table 6.
| Pathologic diagnosis |
Total patients with clinical HT-N (n = 2,927)a |
Matched cohort with biopsy-proven HT-N or non-HT-N (n = 103/206) |
||
|---|---|---|---|---|
| HR (95% CI) | p value | HR (95% CI) | p value | |
| Biopsy-proven HT-N | 0.93 (0.54–1.59) | 0.78 | 0.92 (0.49–1.71) | 0.78 |
| Non-HT-N | 1.0 (reference) | - | 1.0 (reference) | - |
HRs were adjusted with age, sex, period of kidney biopsy, estimated glomerular filtration rate, serum albumin, hemoglobin, urine protein-to-creatinine ratio, systolic blood pressure, and diastolic blood pressure. The biopsy-proven HT-N group represents patients with only HT-N as pathologic diagnosis.
ESKD, end-stage kidney disease; HT-N, hypertensive nephrosclerosis; HR, hazard ratio; CI, confidence interval.
REFERENCES
- TOOLS
-
METRICS

- Related articles
-
Current status of managing diabetes mellitus in Korea2016 September;31(5)


 PDF Links
 PubReader
 ePub Link
 Full text via DOI
 Download Citation
 Supplement 1
 Print
Print


