 |
 |
| Korean J Intern Med > Volume 34(3); 2019 > Article |
|
Abstract
Background/Aims
Methods
Results
Conclusions
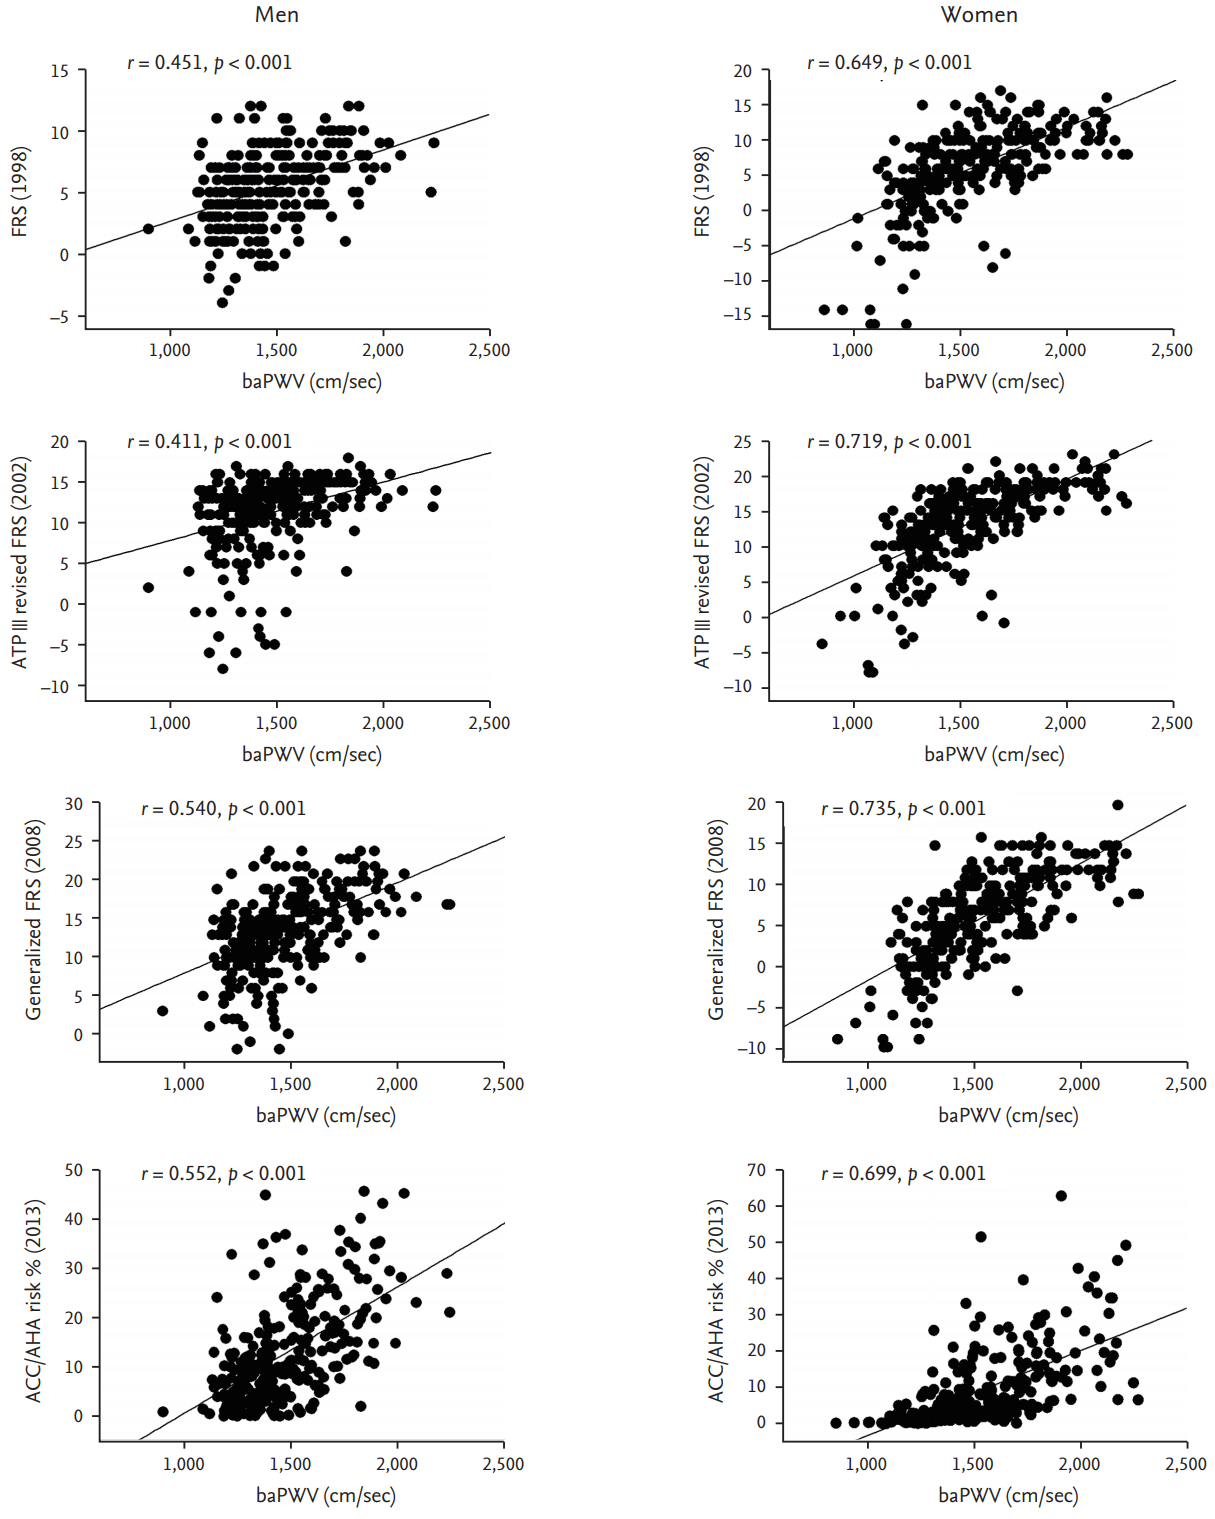
Figure┬Ā1.

Table┬Ā1.
CVD, cardiovascular disease; TC, total cholesterol; LDL-C, low density lipoprotein cholesterol; HDL-C, high density lipoprotein cholesterol; SBP, systolic blood pressure; HTN, hypertension; Rx, medication; CHD, coronary heart disease; FRS, Framingham risk score; ATP, Adult Treatment Panel; ACC/AHA, American College of Cardiology/American Heart Association; ASCVD, atherosclerotic cardiovascular disease.
Table┬Ā2.
| Characteristic | Total (n = 539) | Men (n = 270) | Women (n = 269) | p valuea |
|---|---|---|---|---|
| Age, yr | 58.1 ┬▒ 12.2 | 55.9 ┬▒ 12.1 | 60.3 ┬▒ 12.0 | < 0.001 |
| Height, cm | 162 ┬▒ 9 | 168 ┬▒ 6 | 155 ┬▒ 6 | < 0.001 |
| Weight, kg | 65.5 ┬▒ 12.3 | 72.6 ┬▒ 11.5 | 58.5 ┬▒ 8.6 | < 0.001 |
| BMI, kg/m2 | 24.7 ┬▒ 3.4 | 25.3 ┬▒ 3.1 | 24.1 ┬▒ 3.5 | < 0.001 |
| SBP, mmHg | 126 ┬▒ 14 | 126 ┬▒ 13 | 127 ┬▒ 16 | 0.184 |
| DBP, mmHg | 76.3 ┬▒ 9.4 | 77.5 ┬▒ 9.1 | 75.2 ┬▒ 9.5 | 0.005 |
| Traditional risk factors | ||||
| ŌĆāHypertension | 284 (52.7) | 140 (51.9) | 144 (53.5) | 0.696 |
| ŌĆāDiabetes mellitus | 92 (17.1) | 46 (17.0) | 46 (17.1) | 0.984 |
| ŌĆāDyslipidemia | 313 (58.1) | 155 (57.4) | 158 (58.7) | 0.755 |
| ŌĆāSmoking | 136 (25.2) | 133 (49.3) | 3 (1.1) | < 0.001 |
| Laboratory findings | ||||
| ŌĆāWBC, /┬ĄL | 6,485 ┬▒ 1,819 | 6,793 ┬▒ 1,897 | 6,171 ┬▒ 1,681 | < 0.001 |
| ŌĆāHemoglobin, g/dL | 14.0 ┬▒ 1.6 | 14.9 ┬▒ 1.4 | 13.0 ┬▒ 1.2 | < 0.001 |
| ŌĆāFasting glucose, mg/dL | 105.5 ┬▒ 23.5 | 105.7 ┬▒ 20.8 | 105.2 ┬▒ 25.9 | 0.796 |
| ŌĆāTotal cholesterol, mg/dL | 185 ┬▒ 36 | 183 ┬▒ 38 | 187 ┬▒ 33 | 0.275 |
| ŌĆāHDL-C, mg/dL | 49.2 ┬▒ 11.1 | 45.6 ┬▒ 9.9 | 52.8 ┬▒ 11.1 | < 0.001 |
| ŌĆāLDL-C, mg/dL | 117 ┬▒ 34 | 117 ┬▒ 35 | 116 ┬▒ 32 | 0.801 |
| ŌĆāTriglyceride, mg/dL | 127 ┬▒ 69 | 139 ┬▒ 75 | 115 ┬▒ 60 | < 0.001 |
| ŌĆāhs-CRP, mg/dL | 0.22 ┬▒ 0.48 | 0.25 ┬▒ 0.53 | 0.18 ┬▒ 0.40 | 0.328 |
| ŌĆāeGFR, mL/min/1.73 m2 | 87.6 ┬▒ 19.5 | 87.6 ┬▒ 17.8 | 87.6 ┬▒ 21.1 | 0.998 |
| baPWV, cm/sec | 1,511 ┬▒ 253 | 1,480 ┬▒ 224 | 1,542 ┬▒ 275 | 0.005 |
| Framingham risk score (1998) | 6.0 (4.0ŌĆō8.0) | 6.0 (3.75ŌĆō7.0) | 7.0 (4.0ŌĆō10.0) | < 0.001 |
| ATP III revised FRS (2002) | 13.0 (10.0ŌĆō15.0) | 12.0 (10.0ŌĆō14.0) | 14.0 (11.0ŌĆō17.0) | < 0.001 |
| Generalized FRS against total CVD (2008) | 13.0 (9.0ŌĆō16.0) | 14.0 (10.0ŌĆō17.0) | 12.0 (7.5ŌĆō15.0) | < 0.001 |
| ACC/AHA first hard ASCVD risk equation (2013) | 8.1 (3.2ŌĆō16.2) | 10.4 (5.4ŌĆō18.7) | 5.7 (1.8ŌĆō13.1) | < 0.001 |
Values are presented as mean ┬▒ SD, number (%), or median (interquartile range).
BMI, body mass index; SBP, systolic blood pressure; DBP, diastolic blood pressure; WBC, white blood cell; HDL-C, high density lipoprotein cholesterol; LDL-C, low density lipoprotein cholesterol; hs-CRP, high-sensitivity C-reactive protein; eGFR, estimated glomerular filtration rate; baPWV, brachial-ankle pulse wave velocity; ATP, Adult Treatment Panel; FRS, Framingham risk score; CVD, cardiovascular disease; ACC/AHA, American College of Cardiology/American Heart Association; ASCVD, atherosclerotic cardiovascular disease.
Table┬Ā3.
| Cardiovascular risk scores | Total (n = 539) |
Simple linear correlations |
||
|---|---|---|---|---|
| Men (n = 270) | Women (n = 269) | p valuea | ||
| FRS (1998) | 0.577b | 0.451b | 0.649b | < 0.001 |
| ATP III revised FRS (2002) | 0.594b | 0.411b | 0.719b | < 0.001 |
| Generalized FRS against total CVD (2008) | 0.589b | 0.540b | 0.735b | < 0.001 |
| ACC/AHA first hard ASCVD risk equation (2013) | 0.571b | 0.552b | 0.699b | 0.005 |
FRS, Framingham risk score; ATP, Adult Treatment Panel; CVD, cardiovascular disease; ACC/AHA, American college of cardiology/American heart association; ASCVD, atherosclerotic cardiovascular disease.


 PDF Links
 PubReader
 ePub Link
 Full text via DOI
 Download Citation
 Print
Print


