 |
 |
| Korean J Intern Med > Volume 33(4); 2018 > Article |
|
Abstract
Background/Aims
The methacholine bronchial provocation test (MBPT) is used to detect and quantify airway hyper-responsiveness (AHR). Since improvements in the severity of asthma are associated with improvements in AHR, clinical studies of asthma therapies routinely use the change of airway responsiveness as an objective outcome. The aim of this study was to assess the relationship between serial MBPT and clinical profiles in patients with asthma.
Methods
A total of 323 asthma patients were included in this study. The MBPT was performed on all patients beginning at their initial diagnosis until asthma was considered controlled based on the Global Initiative for Asthma guidelines. A responder was defined by a decrease in AHR while all other patients were considered non-responders.
Results
A total of 213 patients (66%) were responders, while 110 patients (34%) were non-responders. The responder group had a lower initial PC20 (provocative concentration of methacholine required to decrease the forced expiratory volume in 1 second by 20%) and longer duration compared to the non-responder group. Members of the responder group also had superior qualities of life, compared to members of the non-responder group. Whole blood cell counts were not related to differences in PC20; however, eosinophil concentration was. No differences in sex, age, body mass index, smoking history, serum immunoglobulin E, or frequency of acute exacerbation were observed between responders and non-responders.
Asthma is an increasingly common chronic respiratory disease in adults and children. It is characterized by chronic airway inflammation and is associated with airway hyper-responsiveness (AHR). The presence of AHR is not required to diagnose asthma; however, it is a supplementary diagnostic feature [1]. The bronchial provocation test (BPT) is used to identify AHR, and can be either direct or indirect depending on the mechanism by which the stimulus mediates bronchoconstriction. Direct BPT refers to the administration of methacholine or histamine, which acts directly on the smooth muscle receptors of the airway. Indirect BPT refers to the administration of hypertonic saline or mannitol, which stimulates the release of bronchoconstrictive mediators from inflammatory cells [2].
The methacholine bronchial provocation test (MBPT) is highly sensitive and widely used to detect and quantify AHR [3,4]. AHR can be excluded if the provocative concentration that causes a 20% decrease in the forced expiratory volume in 1 second (FEV1) from baseline (PC20) is > 16 mg/mL [5]. AHR increases during an exacerbation, and decreases during treatment with anti-inflammatory medications. Since improvements in the clinical severity of asthma are associated with improvements in AHR [6,7], asthma therapies routinely use the change in airway responsiveness as an objective outcome [8-16]. In this study, the MBPT was performed serially in patients with asthma to identify relationships between MBPT and clinical profiles.
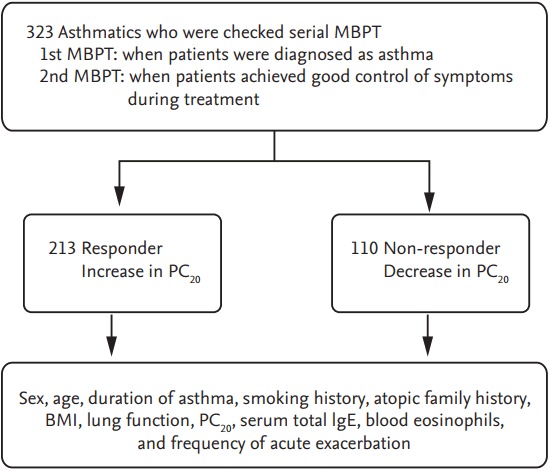
In this retrospective study, a total of 323 asthma patients were enrolled at Soonchunhyang University between January 2009 and December 2011 (Fig. 1). The data used for this study were provided by the biobank at Soonchunhyang University Bucheon Hospital, which is a member of the Korean Biobank Network. Asthma was diagnosed using the 2008 Global Initiative for Asthma (GINA) guidelines [17] and our previous report [18].
All subjects diagnosed with asthma exhibited one or more of the following: (1) > 20% variability in the maximum diurnal peak expiratory flow over 14 days; (2) > 12% and > 200 mL increase in FEV1 after inhaling 200 to 400 ╬╝g albuterol; or (3) a 20% reduction in FEV1 in response to < 10 mg/mL methacholine.
Asthma control was classified according to the GINA guidelines [17]. Subjects underwent a standardized examination, including assessments of whole blood cell counts (with differential counts), immunoglobulin E (IgE) concentrations, posteroanterior chest radiographs, allergy skin prick tests, and spirometries. The body mass index (BMI) for each patient was calculated as their weight (kg) / height (m2) [19,20].
Patients with respiratory infections, chronic obstructive pulmonary disease, vocal cord dysfunction, obstructive sleep apnea, Churg-Strauss syndrome, cardiac dysfunction, allergic bronchopulmonary aspergillosis, and poor adherence to treatment were excluded from the study. All subjects were Korean and were required to provide informed written consent. The research protocol for this study was approved by the Soonchunhyang Institutional Review Board (SCHBC 2016-01-004-002).
Demographic information was collected from all subjects during their baseline visit. A spirometry was performed using a Vmax Series 2130 Autobox Spirometer (Sensor Medics, Yorba Linda, CA, USA), before and after the use of a bronchodilator. Baseline forced vital capacity (FVC) and FEV1 measurements were obtained when a bronchodilator was not used within the previous 8 hours. Basal and postbronchodilator FEV1, FVC, forced expiratory flow (FEF) between 25% and 75% FVC (FEF 25% to 75%), and the carbon monoxide diffusing capacities of the lungs were measured. FVC and FEV1 were measured every 1 to 2 months.
Skin prick tests included 55 species of common inhalant allergens, including house dust mites (Bencard Co., Brentford, UK). Atopy was defined as having an allergen-induced wheal reaction equal to or greater than that caused by histamine (1 mg/mL), or a zone of Ōēź 3 mm in diameter. Total IgE was measured using the UniCAP System (Pharmacia Diagnostics, Uppsala, Sweden).
Quality-of-life (QOL) was evaluated using the Korean modification of the Juniper Asthma QOL Questionnaire. Evaluations were performed at baseline and after 4 weeks of treatment [21]. The answers to each question were scored on a 5-point scale, with a score of 1 representing the greatest impairment, and a score of 5 representing no impairment. Items were weighted equally and reported as mean scores for each domain (activity limitations, emotions, symptoms, and exposure to environmental stimuli), with the overall score.
The MBPT was performed using the method of Chai et al. [22], and the results were expressed as the PC20 (in noncumulative units) based on the bronchial inhalation challenge procedures. Methacholine concentrations of 1.25, 2.5, 6.25, 12.5, and 25 mg/mL were prepared by dilution in buffered saline. A Rosenthal-French dosimeter (Laboratory for Applied Immunology, Baltimore, MD, USA) was used to deliver the aerosol generated by a DeVilbiss 646 nebulizer (Medical Depot Inc., Port Washington, NY, USA). Using tidal breathing, subjects inhaled increasing concentrations of methacholine until the FEV1 fell by more than 20% of its baseline value. A bronchodilator (two puffs of salbutamol) was then administered and the FEV1 was measured after 15 minutes. The MBPT was performed serially in all asthmatics. The MBPT was first performed when patients were diagnosed with asthma, and the second MBPT was performed when patients failed to exhibit symptoms more than once per week, when night waking due to asthma ceased, when relief medication was consumed less than twice per week, and when activities were not limited due to asthma. Responders were defined by a decrease in AHR, while all other patients were considered non-responders.
Duplicate data were entered into SPSS version 14.0 software (SPSS Inc., Chicago, IL, USA), and expressed as the mean ┬▒ standard deviation or standard error of the mean. Group differences were compared using a twotailed t test, the Mann-Whitney U test, or the Pearson chi-square test for normally distributed, skewed, and categorical data, respectively. Differences in the proportions of patient populations were analyzed using the chi-square test or the Fisher exact test when low cell counts were encountered. A p value of < 0.05 was considered statistically significant.
Patient characteristics are detailed in Table 1. A total of 323 patients were included in the study. When classified based on the MBPT data, 213 patients (66%) were responders, while 110 patients (34%) were non-responders. The duration of asthma follow-up was 4.25 ┬▒ 2.84 years. Most subjects had normal or near-normal lung functions, as indicated by FEV1 and the FEV1/FVC ratio. No differences in sex, age, BMI, smoking history, total serum IgE, or frequencies of acute exacerbations were observed between responders and non-responders.
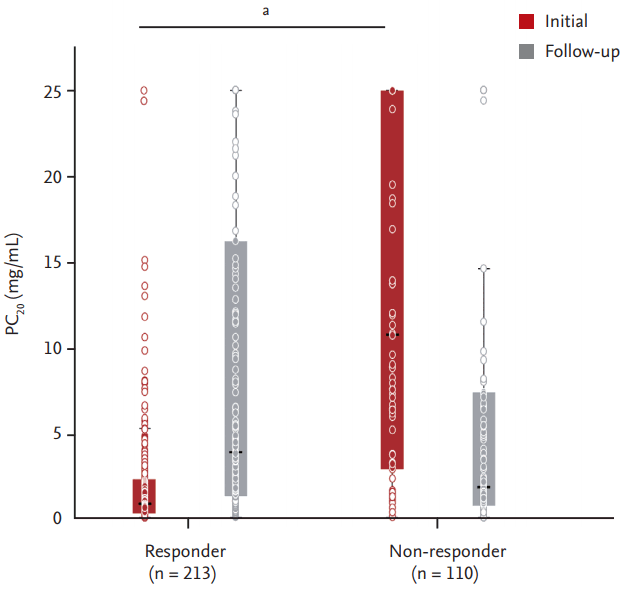
In asthma patients, the PC20 was 5.98 ┬▒ 0.47 mg/mL at baseline and 8.10 ┬▒ 0.53 mg/mL at the follow-up examination. In the responder group, PC20 increased from 2.23 ┬▒ 0.26 to 8.91 ┬▒ 0.68 mg/mL, while in the non-responder group PC20 decreased from 13.25 ┬▒ 0.98 to 6.55 ┬▒ 0.85 mg/mL (Fig. 2). Patients in the responder group had a lower initial PC20 (2.23 ┬▒ 0.26 mg/mL vs. 13.25 ┬▒ 0.98 mg/mL, respectively; p = 0.001), and longer duration of asthma (5.54 ┬▒ 0.63 years vs. 2.84 ┬▒ 0.59 years, respectively; p = 0.002), compared to patients in the non-responder group (Fig. 3). Differences in the MBPT interval were also observed between the responder and non-responder groups (1.24 ┬▒ 0.08 years vs. 1.74 ┬▒ 0.16 years, respectively; p = 0.001).
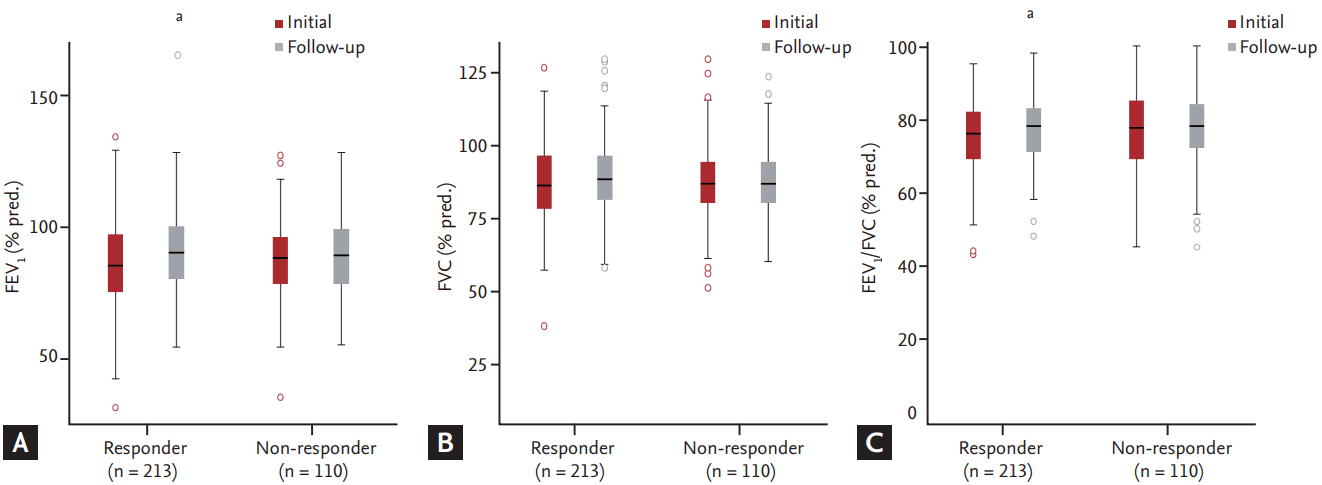
The serial changes in patientsŌĆÖ lung function are shown in Table 2. FEV1, FVC, and FEV1/FVC increased serially during the follow-up period. FEV1 (% predicted [pred.]), FVC (% pred.), and FEV1/FVC (% pred.) improved significantly in both groups (Fig. 4). The FEV1 (% pred.) increased from 85.74% ┬▒ 1.14% to 90.97% ┬▒ 1.07% in the responder group and from 87.44% ┬▒ 1.44% to 88.99% ┬▒ 1.42% in the non-responder group. FVC (% pred.) increased from 86.75% ┬▒ 0.97% to 89.51% ┬▒ 0.87% in the responder group and from 86.28% ┬▒ 1.28% to 87.20% ┬▒ 1.11% in the non-responder group. FEV1/FVC (% pred.) increased from 75.04% ┬▒ 0.67% to 76.63% ┬▒ 0.71% in the responder group and from 76.98% ┬▒ 1.12% to 76.80% ┬▒ 1.01% in the non-responder group.
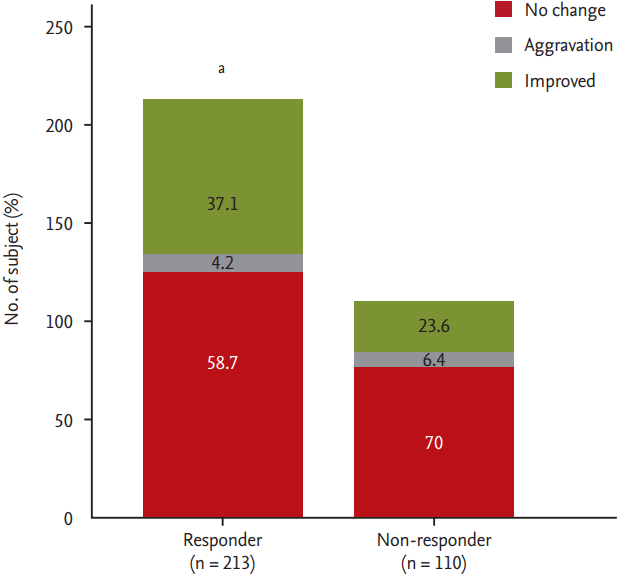
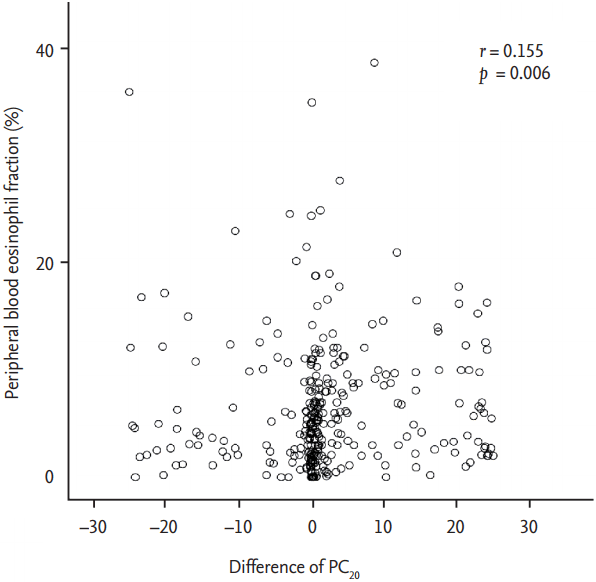
The responses to the QOL questionnaire improved more in the responder group than the non-responder group (79/213 [37%] vs. 26/110 [23.6%], respectively; p = 0.023) (Fig. 5). No differences in the numbers of peripheral blood eosinophils were observed between responder and non-responder groups (479.9 ┬▒ 37.9/╬╝L vs. 468.2 ┬▒ 45.3/╬╝L, respectively). Whole blood cell counts were not associated with differences in PC20, while eosinophil counts were (r = 0.155, p = 0.006) (Fig. 6).
Low initial PC20, long durations of asthma, high eosinophil counts, and QOL assessments may be useful for predicting improvements in AHR in asthma patients. Changes in AHR are typically measured by performing bronchial challenge with direct or indirect stimuli. Since changes in AHR to indirect stimuli are dependent on the presence of inflammatory cells, the release of mediators, and muscle responses, it is considered more reflective of airway inflammation than airway geometry [23].
Monitoring tools that improve the control of asthma and prevent exacerbations are detailed in the asthma guidelines [24-26]. No single outcome can adequately assess the control of asthma [27], and subjective measures involve clinical assessments, diary cards, and QOL questionnaires. Traditional objective methods for monitoring (but not controlling) asthma include assessments of spirometry/peak flow, and the degree of AHR [28]. Newer methods include measurements of airway inflammation, including airway cell differentials in sputum or the fraction of exhaled nitric oxide.
The MBPT is highly sensitive and is used serially to guide asthma therapies [29]. In this study, the MBPT was performed serially on all asthma patients. Initial MBPTs were performed upon diagnosis, while the second was performed when patients controlled their asthma.
The serial measurement of the MBPT may help predict long-term disease activity and provide physiological rationale for asthma therapies. As shown in Fig. 4, most patients exhibited improved lung function during the follow-up pulmonary function test. However, follow-up MBPTs exhibited varying results, despite the fact that they were performed when asthma was controlled.
As shown in Fig. 2, the PC20 increased from 2.23 ┬▒ 0.26 to 8.91 ┬▒ 0.68 mg/mL in the responder group, indicating that AHR improved. However, the PC20 decreased from 13.25 ┬▒ 0.98 to 6.55 ┬▒ 0.85 mg/mL in the non-responder group. These data suggest that high AHRs may be a positive response to asthma.
Symptoms and lung functions are important markers of disease activity, but they do not reflect the degree of airway inflammation or AHR. Sont et al. [24] reported that the presence of an inflammatory infiltrate does not cause the symptoms of asthma or airway obstruction. However, the presence of inflammatory infiltrates may indicate long-term disease activity [30]. Therefore, although symptoms and lung functions may have improved in the non-responder group, AHR may not have improved. These data suggest that the increase in PC20 in the responder group reduced the long-term disease activity. Thus, additional long-term follow-up studies are necessary to test this possibility.
The QOL questionnaire provided an adequate method to monitor the control of asthma. QOL improved more in the responder group, compared to members of the non-responder group. Thus, changes to AHR may affect QOL.
Assessments of the fractional concentration of exhaled nitric oxide [31] are becoming increasingly available, and this metric is mildly associated with the degree of eosinophilic airway inflammation. The asthma control questionnaire [32] and the asthma control test [33] also assist in monitoring the control of asthma.
Inflammation in patients with asthma can be eosinophilic or non-eosinophilic (including neutrophilic) [29]. Eosinophils are important in the pathogenesis of asthma. Regardless of the type of airway inflammation, inhaled corticosteroids remain the primary treatment to control asthma symptoms [27].
In this study, no differences were observed in the numbers of eosinophils between the responder and non-responder groups. However, eosinophil count was associated with differences of PC20. Thus, eosinophil counts are predictive of airway responsiveness and performance in the methacholine provocation test.
In conclusion, low initial PC20 values, long durations of asthma, and high eosinophil counts in patients with asthma have better responses in AHR. The MBPT may be useful to predict the AHR response in asthmatics with such characteristics. Additional tests are necessary to monitor asthma and airway inflammation.
Acknowledgments
This research was supported by a grant from the Korea Health Technology R&D Project through the Korea Health Industry Development Institute (KHIDI), a grant from the Korean Ministry of Health and Welfare (number: HI15C2032), and the Soonchunhyang University Research Fund.
Figure┬Ā1.
Schematic of the study design. MBPT, methacholine bronchial provocation test; PC20, provocative concentration of methacholine required to decrease the forced expiratory volume in 1 second by 20%; BMI, body mass index; IgE, immunoglobulin E.
Figure┬Ā2.
Serial change in PC20 in response using methacholine bronchial provocation test. PC20, provocative concentration of methacholine required to decrease the forced expiratory volume in 1 second by 20%. a p < 0.01, compared to the baseline bronchial provocation test in the non-responder group.
Figure┬Ā3.
Comparison of asthma duration based on methacholine provocation test response. a p < 0.01, compared to the non-responder group.

Figure┬Ā4.
Serial changes in lung function; (A) FEV1 (%pred), (B) FVC (% pred), (C) FEV1/FVC based on the methacholine bronchial provocation test results. FEV1, forced expiratory volume in 1 second; pred., predicted; FVC, forced vital capacity. a p < 0.05, compared to the baseline bronchial provocation test.
Figure┬Ā5.
Comparisons of quality-of-life responses between responders and non-responders. a p < 0.01, compared to non-responders.
Figure┬Ā6.
Relationships between the peripheral blood eosinophil fraction (%) and differences in PC20. PC20, provocative concentration of methacholine required to decrease the forced expiratory volume in 1 second by 20%.
Table┬Ā1.
Clinical and physiological variables in patients with bronchial asthma by response of airway responsiveness using MBPT
| Characteristic | Responder | Non-responder |
|---|---|---|
| No. of subject | 213 | 110 |
| Male sex, % | 37.0 | 39.0 |
| Age (at initial visit), yr | 47.5 ┬▒ 0.97 | 49.5 ┬▒ 1.38 |
| Duration of asthma, yra | 5.54 ┬▒ 0.63 | 2.84 ┬▒ 0.59 |
| Atopy, % | 44.3 | 38.8 |
| BMI | 24.5 ┬▒ 0.26 | 25.1 ┬▒ 0.39 |
| FEV1, % pred. | 85.7 ┬▒ 1.13 | 87.4 ┬▒ 1.43 |
| FVC, % pred. | 86.7 ┬▒ 0.97 | 86.2 ┬▒ 1.27 |
| FEV1/FVC | 75 ┬▒ 0.06 | 76.9 ┬▒ 1.1 |
| Smoking status (none/ex/current) | 140/49/24 | 78/20/12 |
| PC20, mg/mLb | 2.22 ┬▒ 0.26 | 13.2 ┬▒ 0.97 |
| Total IgE, kU/L | 418.2 ┬▒ 47.7 | 315.4 ┬▒ 58.9 |
| Blood eosinophils, % | 6.56 ┬▒ 38 | 6.14 ┬▒ 0.67 |
Values are presented as mean ┬▒ standard error. The responder was defined by decrease of airway hyper-responsiveness in methacholine provocation test and the other was non-responder group.
MBPT, methacholine bronchial provocation test; BMI, body mass index; FEV1, forced expiratory volume in 1 second; pred., predicted; FVC, forced vital capacity; PC20, provocative concentration of methacholine required to decrease the FEV1 by 20%; IgE, immunoglobulin E.
Table┬Ā2.
Serial changes in lung function and PC20 in patients with bronchial asthma
| Characteristic |
Responder |
Non-responder |
Total |
|||
|---|---|---|---|---|---|---|
| At initial MBPT | At second MBPT | At initial MBPT | At second MBPT | At initial MBPT | At second MBPT | |
| FEV1, % pred. | 85.74 ┬▒ 1.14 | 90.97 ┬▒ 1.07a | 87.44 ┬▒ 1.44 | 88.99 ┬▒ 1.42 | 86.30 ┬▒ 0.89 | 90.30 ┬▒ 0.85a |
| FVC, % pred. | 86.75 ┬▒ 0.97 | 89.51 ┬▒ 0.87 | 86.28 ┬▒ 1.28 | 87.20 ┬▒ 1.11 | 86.60 ┬▒ 0.77 | 88.70 ┬▒ 0.68 |
| FEV1/FVC | 75.04 ┬▒ 0.67 | 76.63 ┬▒ 0.71 | 76.98 ┬▒ 1.12 | 76.80 ┬▒ 1.01 | 75.70 ┬▒ 0.60 | 76.60 ┬▒ 0.58 |
| PC20, mg/mL | 2.23 ┬▒ 0.26 | 8.91 ┬▒ 0.68a | 13.25 ┬▒ 0.98 | 6.55 ┬▒ 0.85a | 5.98 ┬▒ 0.47 | 8.10 ┬▒ 0.53a |
REFERENCES
1. Reddel HK, Bateman ED, Becker A, et al. A summary of the new GINA strategy: a roadmap to asthma control. Eur Respir J 2015;46:622ŌĆō639.


2. Brannan JD, Lougheed MD. Airway hyperresponsiveness in asthma: mechanisms, clinical significance, and treatment. Front Physiol 2012;3:460.


3. Cockcroft DW, Killian DN, Mellon JJ, Hargreave FE. Bronchial reactivity to inhaled histamine: a method and clinical survey. Clin Allergy 1977;7:235ŌĆō243.


4. Sumino K, Sugar EA, Irvin CG, et al. Methacholine challenge test: diagnostic characteristics in asthmatic patients receiving controller medications. J Allergy Clin Immunol 2012;130:69ŌĆō75.


5. Crapo RO, Casaburi R, Coates AL, et al. Guidelines for methacholine and exercise challenge testing-1999. This official statement of the American Thoracic Society was adopted by the ATS Board of Directors, July 1999. Am J Respir Crit Care Med 2000;161:309ŌĆō329.


6. Juniper EF, Frith PA, Hargreave FE. Airway responsiveness to histamine and methacholine: relationship to minimum treatment to control symptoms of asthma. Thorax 1981;36:575ŌĆō579.


7. Murray AB, Ferguson AC, Morrison B. Airway responsiveness to histamine as a test for overall severity of asthma in children. J Allergy Clin Immunol 1981;68:119ŌĆō124.


8. Song WJ, Cho SH. Challenges in the management of asthma in the elderly. Allergy Asthma Immunol Res 2015;7:431ŌĆō439.


9. Kerrebijn KF, van Essen-Zandvliet EE, Neijens HJ. Effect of long-term treatment with inhaled corticosteroids and beta-agonists on the bronchial responsiveness in children with asthma. J Allergy Clin Immunol 1987;79:653ŌĆō659.


10. Dinh Xuan A, Lockart A. Use of non-specific bronchial challenges in the assessment of anti-asthmatic drugs. Eur Respir Rev 1991;1:19ŌĆō24.
11. Crimi N, Palermo F, Oliveri R, Polosa R, Settinieri I, Mistretta A. Protective effects of inhaled ipratropium bromide on bronchoconstriction induced by adenosine and methacholine in asthma. Eur Respir J 1992;5:560ŌĆō565.


12. Laitinen LA, Laitinen A, Haahtela T. A comparative study of the effects of an inhaled corticosteroid, budesonide, and a beta 2-agonist, terbutaline, on airway inflammation in newly diagnosed asthma: a randomized, double-blind, parallel-group controlled trial. J Allergy Clin Immunol 1992;90:32ŌĆō42.


13. van Essen-Zandvliet EE, Hughes MD, Waalkens HJ, et al. Effects of 22 months of treatment with inhaled corticosteroids and/or beta-2-agonists on lung function, airway responsiveness, and symptoms in children with asthma. The Dutch Chronic Non-specific Lung Disease Study Group. Am Rev Respir Dis 1992;146:547ŌĆō554.


14. Rabe KF, Jorres R, Nowak D, Behr N, Magnussen H. Comparison of the effects of salmeterol and formoterol on airway tone and responsiveness over 24 hours in bronchial asthma. Am Rev Respir Dis 1993;147:1436ŌĆō1441.


15. Prieto L, Berto JM, Gutierrez V, Tornero C. Effect of inhaled budesonide on seasonal changes in sensitivity and maximal response to methacholine in pollen-sensitive asthmatic subjects. Eur Respir J 1994;7:1845ŌĆō1851.


16. Cockcroft DW, Swystun VA, Bhagat R. Interaction of inhaled beta 2 agonist and inhaled corticosteroid on airway responsiveness to allergen and methacholine. Am J Respir Crit Care Med 1995;152:1485ŌĆō1489.


17. Bateman ED, Hurd SS, Barnes PJ, et al. Global strategy for asthma management and prevention: GINA executive summary. Eur Respir J 2008;31:143ŌĆō178.


18. Jang AS, Kim SH, Kim TB, et al. Impact of atopy on asthma and allergic rhinitis in the cohort for reality and evolution of adult asthma in Korea. Allergy Asthma Immunol Res 2013;5:143ŌĆō149.


19. Adams KF, Schatzkin A, Harris TB, et al. Overweight, obesity, and mortality in a large prospective cohort of persons 50 to 71 years old. N Engl J Med 2006;355:763ŌĆō778.


20. McGee DL, Diverse Populations Collaboration. Body mass index and mortality: a meta-analysis based on person-level data from twenty-six observational studies. Ann Epidemiol 2005;15:87ŌĆō97.


21. Juniper EF, Guyatt GH, Willan A, Griffith LE. Determining a minimal important change in a disease-specific Quality of Life Questionnaire. J Clin Epidemiol 1994;47:81ŌĆō87.


22. Chai H, Farr RS, Froehlich LA, et al. Standardization of bronchial inhalation challenge procedures. J Allergy Clin Immunol 1975;56:323ŌĆō327.


23. Cockcroft D, Davis B. Direct and indirect challenges in the clinical assessment of asthma. Ann Allergy Asthma Immunol 2009;103:363ŌĆō369.


24. Sont JK, Han J, van Krieken JM, et al. Relationship between the inflammatory infiltrate in bronchial biopsy specimens and clinical severity of asthma in patients treated with inhaled steroids. Thorax 1996;51:496ŌĆō502.


25. Petsky HL, Cates CJ, Lasserson TJ, et al. A systematic review and meta-analysis: tailoring asthma treatment on eosinophilic markers (exhaled nitric oxide or sputum eosinophils). Thorax 2012;67:199ŌĆō208.


26. Kim HB, Eckel SP, Kim JH, Gilliland FD. Exhaled NO: determinants and clinical application in children with allergic airway disease. Allergy Asthma Immunol Res 2016;8:12ŌĆō21.


27. British Thoracic Society Scottish Intercollegiate Guidelines Network. British guideline on the management of asthma. Thorax 2008;63 Suppl 4:iv1ŌĆōiv121.


28. Reddel HK, Taylor DR, Bateman ED, et al. An official American Thoracic Society/European Respiratory Society statement: asthma control and exacerbations: standardizing endpoints for clinical asthma trials and clinical practice. Am J Respir Crit Care Med 2009;180:59ŌĆō99.


29. Cockcroft DW, Davis BE. Mechanisms of airway hyperresponsiveness. J Allergy Clin Immunol 2006;118:551ŌĆō559.


30. Zacharasiewicz A, Wilson N, Lex C, et al. Clinical use of noninvasive measurements of airway inflammation in steroid reduction in children. Am J Respir Crit Care Med 2005;171:1077ŌĆō1082.


31. Korevaar DA, Westerhof GA, Wang J, et al. Diagnostic accuracy of minimally invasive markers for detection of airway eosinophilia in asthma: a systematic review and meta-analysis. Lancet Respir Med 2015;3:290ŌĆō300.


 PDF Links
 PubReader
 ePub Link
 Full text via DOI
 Download Citation
 Print
Print


