INTRODUCTION
Tumors growing in hypoxic environments are more prone to vigorous growth and metastasis, which are associated with poor prognoses [1,2]. Hyperbaric oxygen enhances tumor oxygenation and is used in combination with both chemotherapy and radiotherapy to treat various solid tumors [3-6]. Hyperoxia is tumoricidal [7-9]; however, any effect thereof on lung cancer has received little attention, and the mechanism of the effect is poorly understood [10-13].
Hyperbaric oxygen (application of pure 100% oxygen under pressure) increases soluble oxygen levels in tumor tissue [14]. However, hyperbaric oxygen applied as a treatment for lung cancer may cause acute lung injury [15]. In tumor-bearing mice exposed to either normobaric or hyperbaric conditions, tumors exhibited growth retardation, reductions in vascular density, decrease in gland size and enhanced cell death. The development of these effects did not seem to require hyperbaric conditions [9].
We explored whether intermittent normobaric hyperoxia was tumoricidal in mice with lung tumors and whether hyperoxia enhanced the effect of carboplatin chemotherapy. We measured early indicators of oxidative stress and apoptosis to determine the mechanisms responsible for the tumoricidal effects.
METHODS
Animals and chemicals
Female A/J mice (6 to 7 weeks old) were purchased from the Institute of Medical Science (University of Tokyo, Tokyo, Japan). Mice were fed the AIN-93M diet and housed in pathogen-free animal quarters. Fresh food was provided every 2 to 3 days and the water bottles were changed twice weekly. The diet and drinking water were provided ad libitum. The mice were maintained at room temperature (20°C ± 2°C) at a relative humidity of 50% ± 10% with ≥ 10 to 15 air changes/hour under an alternating 12-hour/12-hour light/dark cycle. The study was approved by the Institutional Animal Care and Use Committees in Department of Laboratory Animal, St. Paul's Hospital, The Catholic University of Korea (SPH-20140207-01).
Benzo[a]pyrene (B[a]P, purity > 99%) and carboplatin were purchased from Sigma (St. Louis, MO, USA). Carboplatin was dissolved in double-distilled water.
Experimental design
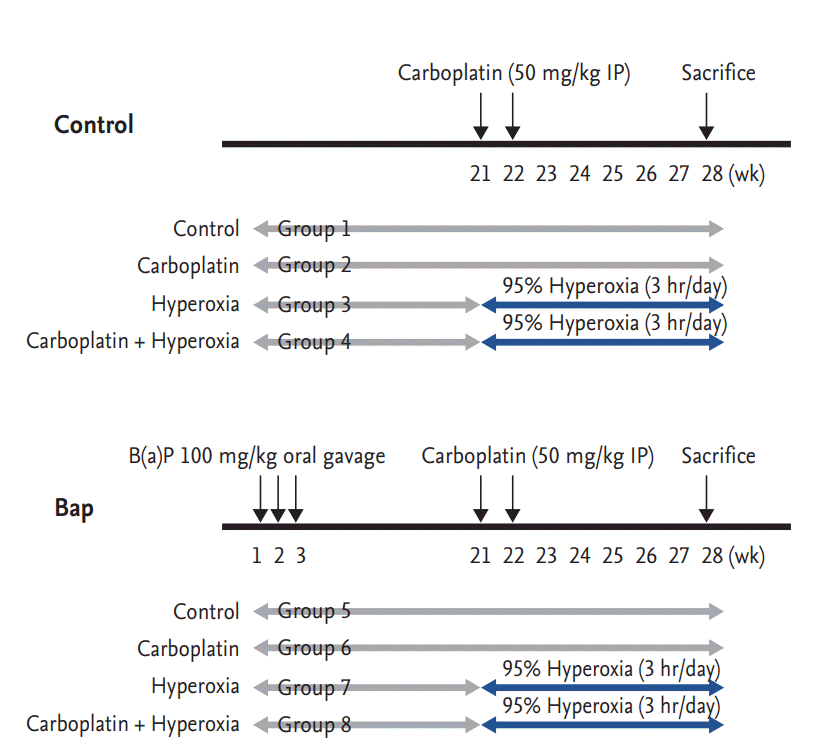
The experimental design is illustrated in Fig. 1. After 1 week of acclimation, the mice were divided into two groups: (1) control and (2) oral gavage with 100 mg/kg B[a]P. The B[a]P group received B[a]P in 0.1 mL amounts of corn oil once a week for 3 consecutive weeks. In each group, the mice were randomized into four subgroups (n = 6 per group): (1) control, (2) carboplatin (50 mg/kg intraperitoneally), (3) hyperoxia (95% fraction of inspired oxygen [FiO2]), and (4) carboplatin and hyperoxia. Mice were given 50 mg/kg carboplatin via single intraperitoneally injections at 21 and 22 weeks. Hyperoxia (95%) was applied for 3 hours/day from weeks 21 to 28 [16]. Body weights were recorded weekly throughout the experiment. All mice were sacrificed at 28 weeks.
A computer-controlled Biospherix Oxycycler system (Reming Bioinstruments, Redfield, NY, USA) was used to maintain the oxygen level at a constant 95%. The atmosphere was circulated continually, and the oxygen concentration monitored. The carbon dioxide level was maintained at < 0.5% by adjusting the extent of chamber “leak.” Mice exposed to room air and oxygen were evaluated at the same time.
Lung tumor evaluation
The gross morphology and number of lung tumor nodules were recorded after sacrifice; we counted the tumor number and calculated the tumor volume. Size was measured using a Thorpe caliper (Biomedical Research Instruments, Rockville, MD, USA). Nodules ≥ 1.5 mm in diameter were measured using the naked eye. Nodules < 1.5 mm in diameter were microscopically categorized as either ≤ 0.5 mm in diameter or otherwise. Tumor volume was calculated using the formula: (d1 × d2 × d3) × 0.5236, where dn represent the three orthogonal diameters. A portion of each tumor was fixed in 4% paraformaldehyde prior to histological analysis.
Bronchoalveolar lavage fluid sampling
Mice were anesthetized via intraperitoneally injection of a mixture of zoletil (30 mg/kg; Zoletil 50, Virbac, Carros, France) and rompun (10 mg/kg; Rompun, Bayer Health-Care, Leverkusen, Germany), and the trachea were exposed and cannulated with silicone tubing attached to a 23-gauge needle on a tuberculin syringe. Bronchoalveolar lavage (BAL) fluid was withdrawn after instillation of 800 μL sterile phosphate-buffered saline (PBS) through the trachea into the lung. The total cell counts in BAL fluid were determined using a hemocytometer. The BAL fluid was cytospun (5 minutes at 750 g) onto microscope slides and stained with Diff-Quick (Sysmax, Kobe, Japan). The percentages of macrophages, lymphocytes, eosinophils, and neutrophils were calculated by counting 500 leukocytes on randomly selected regions of the slides under a light microscope. The supernatants were stored at −70°C.
Histopathology
The left lung was fixed in 10% formalin, embedded in paraffin wax, and cut into 4 μm thick sections using a microtome. Deparaffinized tissue sections were subjected to hematoxylin and eosin staining and examined under a microscope. Lung tumors were classified as papillary adenomas, solid/alveolar adenomas, or undifferentiated carcinomas.
Antioxidant enzyme assays
Lung tissues were excised, weighed, and homogenized in the assay buffers from various kits. Within 1 week of collection, all homogenates were subjected to enzyme-linked immunosorbent assay (ELISA) to determine the levels of superoxide dismutase (SOD), total glutathione peroxidase (GSH), and catalase (eBioscience, San Diego, CA, USA) following the manufacturer’s instructions.
Measurement of 8-OHdG and caspase 3 levels
The serum levels of the oxidative stress biomarker 8-hydroxy-2’-deoxyguanosine (8-OHdG) were measured by competition ELISA employing a monoclonal antibody (Oxford Biochemical Research, Oxford, MI, USA) according to the manufacturer’s instructions. Optical densities at 450 nm were measured using a microplate reader. Values were calculated in ng/mL using the standards included in the kit.
Caspase 3 levels were assayed using a commercial kit (BioVision, Milpitas, CA, USA). Snap-frozen lung tissue was homogenized in buffer and analyzed according to the manufacturer’s instructions. Optical densities at 450 nm were measured using a microplate reader. Caspase 3 mRNA expression was measured by quantitative reverse transcription polymerase chain reaction (PCR) and the level of cleaved caspase 3 protein was measured using Western blot analysis.
Western blot analysis
Lung tissues were homogenized in radio immunoprecipitation assay cell lysis buffer containing a mixture of protease inhibitors (GenDEPOT, Barker, TX, USA) and centrifuged at 13,000 rpm for 15 minutes at 4°C. Protein concentrations were determined using a BCA protein assay kit (Thermo Scientific/Pierce Biotechnology, Rockford, MA, USA). Equal amounts of protein (40 μg) were loaded onto a 15% SDS-PAGE gel, electrophoresed, and transferred to a PVDF membrane (Millipore, Billerica, MA, USA). The membrane was blocked with 5% nonfat milk containing 0.1% Tween-20 at room temperature for 2 hours and incubated with the primary antibody (against Bcl-2, Bax, caspase 3, or β-actin [Cell Signaling Technology Inc., Danvers, MA, USA]) at a 1:1,000 dilution at 4°C overnight. The membrane was then washed with Tris-buffered saline containing 0.1% Tween-20 and incubated with a 1:2,000 dilution of goat anti-rabbit secondary antibody for 2 hours at room temperature. The blot was developed using the ECL-Western Blotting analysis system (GE Healthcare Life sciences, Buckinghamshire, UK) and exposed to X-ray film.
Quantitative reverse transcription polymerase chain reaction
Total RNA was extracted from lung tissue using TRIzol reagent (Invitrogen, Carlsbad, CA, USA) according to the manufacturer’s recommendations, and RNA quality and quantity were evaluated using the Nanodrop spectrophotometer (Nanodrop Technologies, Wilmington, DE, USA). First-strand cDNA synthesis was performed using random hexamers and the PrimeScript RT reagent kit (TAKARA Bio, Otsu, Japan) according to the manufacturer’s protocol. Quantitative PCR was performed using 2 × SYBR FAST qPCR Master Mix (KAPA Biosystems, Wilmington, MA, USA). The PCR conditions were 95°C (3 minutes), followed by 40 cycles at 95°C (3 seconds) and 60°C (30 seconds); we drew the standard denaturation curves. The following primers were used: Bax forward 5’-GGCTGGACACTGGACTTCCT-3’, reverse 5’-GGTGAGGACTCCAGCCACAA-3’; Bcl-2 forward 5’-TTCGCAGAGATGTCCAGTCA 3’, reverse 5’-TTCAGAGACAGCCAGGAGAA-3’; caspase 3 forward 5’-TGTCATCTCGCTCTGGTACG-3’, reverse 5’-AAATGACCCCTTCATCACCA-3’; and β-actin (control) forward 5’- GACGGCCAGGTCATCACTAT-3’, reverse 5’-CGGATGTCAACGTCACACTT-3’. All assays were performed in triplicate using the CFX96 Touch Real-Time PCR Machine (Bio-Rad, Foster City, CA, USA), and fold changes in expression were derived using the comparative cycle threshold method.
Terminal transferase-mediated dUTP nick end-labeling (TUNEL) assay
Apoptosis was evaluated using the TUNEL assay according to the manufacturer’s instructions (Promega, Madison, WI, USA). Briefly, 4 μm thick sections of paraffin embedded tissue on glass slides were deparaffinized and hydrated. After washing in PBS, equilibration buffer and terminal deoxynucleotidyl transferase was added to all slides followed by incubation at 37°C for 1 hour. The slides were immersed in saline sodium citrate and counterstained, followed by several washes with distilled water. The numbers of TUNEL-positive cells (identified by brown nuclei) were counted microscopically in the entire field of each section at ×200 magnification.
Statistical analysis
Data were subjected to one-way analysis of variance (ANOVA) followed by Dunnett’s multiple range test using GraphPad Prism version 5.0 (GraphPad Software, San Diego, CA, USA). All data are expressed as mean ± standard deviation, and a p value < 0.05 was considered to reflect statistical significance.
RESULTS
Body weight
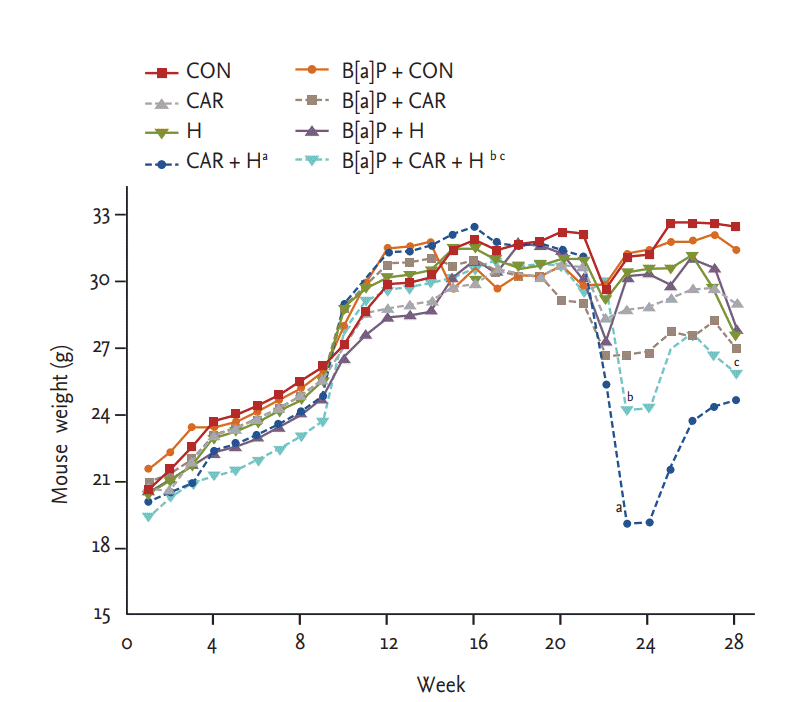
Over the experimental period, all animals were weighed periodically. All animals were weighed periodically. All tolerated oxygen exposure well; no mortality due to hyperoxia was apparent. Mice treated with both carboplatin and hyperoxia exhibited the smallest weight gains by 24 weeks in both the normal control and B[a]P groups (both p < 0.05). B[a]P reduced the body weight somewhat relative to that of normal controls, but the difference was not significant. The body weight reduction of B[a] P mice treated with both hyperoxia and carboplatin persisted the entire 28 weeks (p < 0.05) (Fig. 2).
Lung tumor numbers
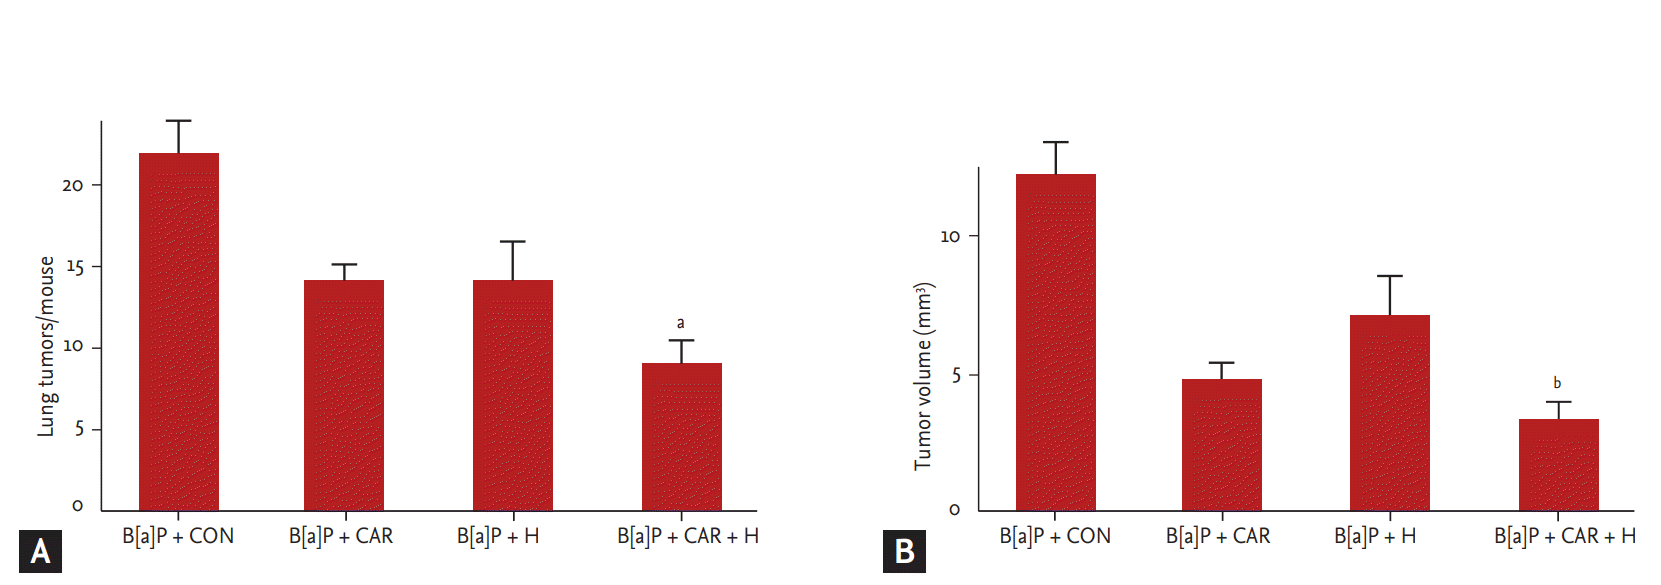
We measured the tumor number and volume at week 28 (Fig. 3). The marked increases in tumor number and volume in the B[a]P control group were significantly reduced by carboplatin and hyperoxia treatment. The tumor number decreased by 59% and the tumor volume by 72% (p < 0.05 and p < 0.01, respectively).
BAL analysis
We counted total inflammatory cell numbers in BAL fluid. Fig. 4A shows that cell numbers increased after carboplatin or hyperoxia treatment in normal controls, and lymphocyte numbers increased significantly after treatment with carboplatin and hyperoxia (p < 0.01). Fig. 4B shows that the total cell counts increased in all B[a]P groups compared with normal controls. Administration of carboplatin and hyperoxia to B[a]P-treated mice significantly reduced the cell counts compared with the B[a]P control group (p < 0.05). No significant differences in the numbers of inflammatory cells (lymphocytes and neutrophils) was evident among the B[a]P-treated groups.
Histopathological changes
Fig. 5 shows the histological profiles of lung sections from the control and experimental groups. Control lungs had a normal architecture and small uniform nuclei. The B[a]P control group exhibited a loss of architecture and alveolar damage, evidenced by hyperchromatic nuclei in cells of the alveolar walls. B[a]P groups treated with carboplatin or hyperoxia exhibited reduced levels of alveolar damage and hyperchromatic nuclei in alveolar cells. The carboplatin and hyperoxia treated group exhibited a reduced tumor burden with near-normal lung architecture.
Oxidative stress and DNA damage
To explore oxidative stress among the B[a]P groups, we measured the levels of several antioxidant enzymes in lung tissue. The SOD level was somewhat increased in the B[a]P + carboplatin group compared with the B[a]P control group, but the difference was not significant. The SOD level was decreased in the B[a]P + hyperoxia group and further so in the B[a]P + carboplatin + hyperoxia group, but the difference was not significant (Fig. 6A).
The GSH level was increased in the B[a]P + carboplatin group but decreased in both the B[a]P + hyperoxia group and the B[a]P + carboplatin + hyperoxia group compared with the B[a]P control group; however, the differences were not significant (Fig. 6B). Treatment with both carboplatin and hyperoxia significantly increased the catalase level (p < 0.05) compared with that in the B[a]P control group (Fig. 6C).
We assayed the level of 8-OHdG, a marker of oxidative damage, via ELISA to measure the extent of DNA damage. The 8-OHdG level was significantly higher in the B[a]P + carboplatin + hyperoxia group than in the B[a]P control group (p < 0.05) (Fig. 6D).
Apoptotic gene expression
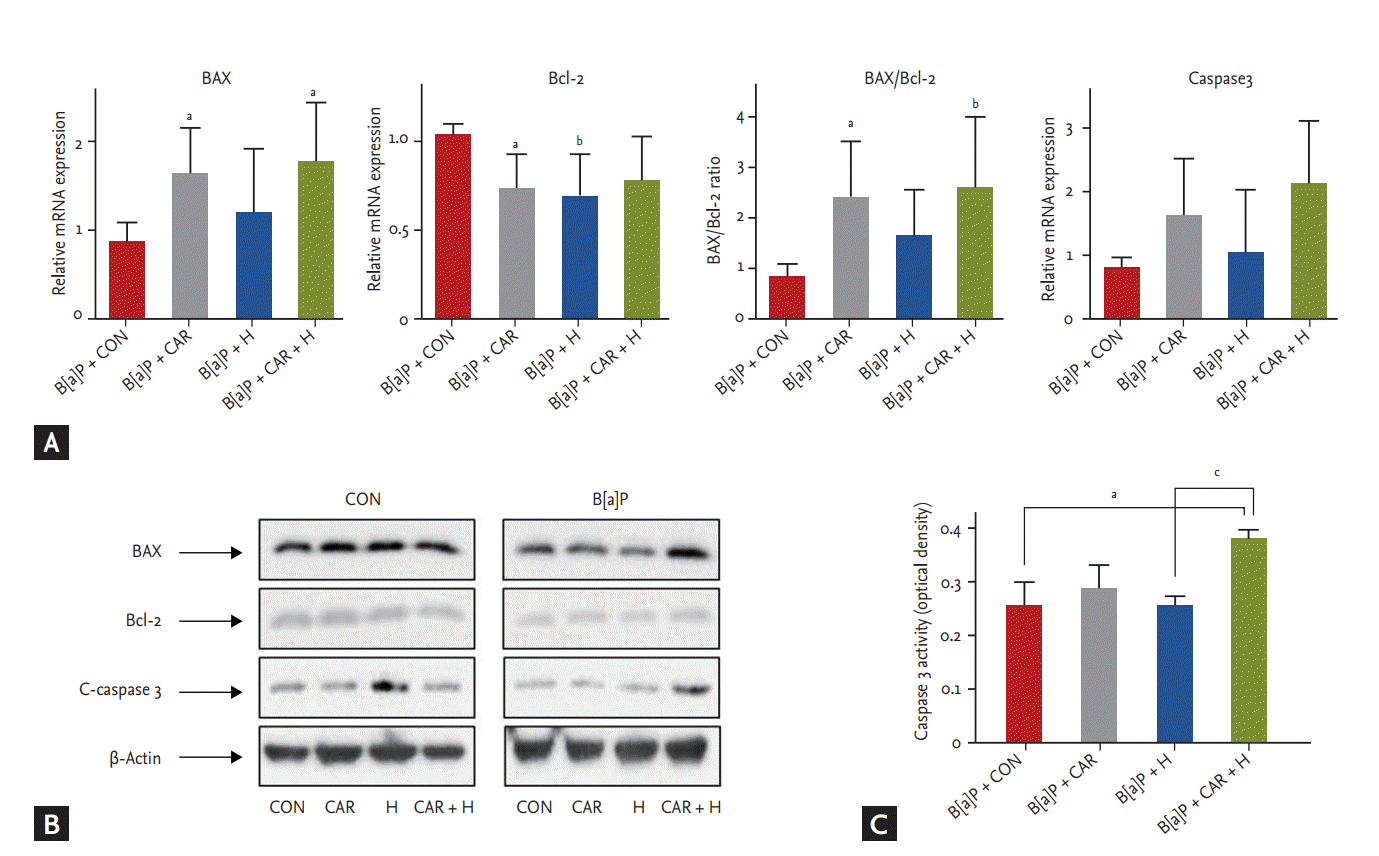
We measured the mRNA and protein expression levels of Bax, Bcl-2, and caspase 3 (Fig. 7). The Bax/Bcl-2 mRNA ratio increased significantly after B[a]P + carboplatin + hyperoxia treatment compared with the B[a]P control group (p < 0.01) (Fig. 7A). Although no significant between-group difference in the caspase 3 mRNA expression level was evident, its expression tended to increase steadily after treatment with carboplatin or hyperoxia. In the Western blot analysis, BAX and C-caspase 3 showed increased uptake in the B[a]P + CAR + H group compared to the other groups. (Fig. 7B). A significant increase in the level of caspase 3 activity was evident in the B[a]P + carboplatin + hyperoxia group compared with the B[a]P control group (p < 0.05) and the B[a]P + hyperoxia group (p < 0.05) (Fig. 7C).
Identification of apoptosis in lung sections
The TUNEL assay was used to detect cells undergoing apoptosis in lungs of B[a]P-treated mice treated with carboplatin or intermittent normobaric hyperoxia (Fig. 8). No TUNEL-positive cells were detected in B[a]P-treated control mice. TUNEL-positive cells (apoptotic nuclei, indicated by the arrow in Fig. 8) were evident in cancer tissue treated with carboplatin alone or hyperoxia alone. The combination of carboplatin and hyperoxia significantly increased the number of TUNEL-positive cells.
DISCUSSION
We found that intermittent normobaric hyperoxia with carboplatin exhibited a synergistic antitumor effect on B[a]P-induced lung cancers in mice. Hyperoxia exerts tumoricidal effects on various cancers, including mammary tumors in rats [8,9]. Two studies on mice injected with various tumor cell lines and then exposed to 70% oxygen for 3 weeks showed that the extents of lung tumors derived from mammary carcinoma MT-7 cells and lung tumor cell lines were reduced [10,11]. Most previous studies used hyperbaric oxygen to increase tissue oxygen levels. However, to prevent hyperbaric hyperoxia-induced lung injury [15], we employed only intermittent normobaric hyperoxia.
According to the “normobaric oxygen paradox,” erythropoietin (EPO; which exhibits many tissue-protecting effects) levels increase after normobaric hyperoxia, but an unexpected reduction in the EPO level was apparent after hyperbaric oxygen exposure (2.5 atm) [17]. Hyperbaric oxygenation may trigger more oxidative stress than expected based on the oxygen concentration alone; such stress may induce cytokine production [18].
It is likely that oxidative stress plays a major tumoricidal role. Reactive oxygen species (ROS) activity is elevated during hyperoxia [19]. Production of free oxygen radicals may exceed the endogenous antioxidant capacity, creating oxidative stress that in turn triggers apoptosis and cell death [20]. Free radicals seem to exert opposite effects on normal and tumor cells. When free radicals attack normal cells, DNA damage follows, but ROS are associated with highly beneficial growth inhibition of tumor cells.
The damaging effects of ROS are mitigated by several cellular antioxidant defenses. Common antioxidants include enzymes such as SOD, catalase, GSH-associated enzymes (such as glutathione reductase), and heme oxygenase [21]. SOD (a metalloprotein) is considered the first line of defense against free radicals, transforming the superoxide radical into oxygen and hydrogen peroxide (H2O2). H2O2 is next metabolized to innocuous oxygen and water by GSH and catalase [22]. We found that the addition of hyperoxia to carboplatin treatment reduced the SOD level compared with that of controls; however, it was not statistically significant. SOD activity is often reduced early in cancer development, rendering tumors more susceptible to the effects of increased ROS levels caused by hyperoxic exposure. However at late stages, SOD activity may increase to help fight against elevated ROS levels. Therefore this shift in SOD expression may have caused insignificant change in SOD levels, as in our study [22].
GSH plays a critical role in maintaining an appropriate balance between oxidant and antioxidant levels. GSH inactivates toxic or carcinogenic electrophiles [23]. Therefore, a decrease in the GSH level is an indicator of oxidative stress. However in our study, we could not find valid change in GSH levels among the groups. This may be due to the consequence of decrease in GSH level in lung tumors and increase in GSH level in normal lung tissue, causing insignificant changes in the final outcome. Further studies are needed.
The level of catalase activity under physiological conditions is low. Catalase has a lower affinity for H2O2 than does GSH, but catalase plays an important role in diseases associated with elevated H2O2levels [24]. Catalase decomposes H2O2 to water and oxygen without producing free radicals [25]. We found that addition of hyperoxia to carboplatin treatment substantially increased the catalase level in lung homogenates compared with the carboplatin treatment alone.
Excess free radicals oxidatively damage lipids, proteins, and DNA. The most commonly used marker of oxidatively modified DNA is 8-OHdG [26]; this adduct is an important marker of carcinogenesis, indicating the extents of G to T and A to C transversions [27]. The 8-OHdG level in mice treated with both hyperoxia and carboplatin was meaningfully higher than that in controls.
All of our results suggest that oxidative stress, and the effects thereof on DNA, were increased following exposure to hyperoxia or carboplatin. Furthermore, the oxidative stress level was significantly greater after hyperoxia + carboplatin treatment compared with either treatment alone.
Both a decrease in the GSH level and an increase in the ROS level enhance apoptosis [28]. Increased Bax expression indicates a greater susceptibility to apoptosis; increased Bcl-2 expression protects against apoptosis. The Bax/Bcl-2 (mRNA or protein) ratio is a measure of the susceptibility to apoptosis [29,30]. We found that the mRNA ratio was increased significantly in mice treated with carboplatin and hyperoxia. Western blotting also confirmed the increased expression of BAX and caspase 3. Caspase 3, an executioner caspase activated via both the extrinsic and intrinsic apoptotic pathways, is an important component of apoptosis [31]. The caspase 3 level was increased significantly after hyperoxia was added to carboplatin treatment. Programmed cell death was evident in tumor tissues after treatment with both hyperoxia and carboplatin, and the number of TUNEL-positive apoptotic cells was increased significantly. Thus, the combination of hyperoxia and carboplatin exerted a synergistic effect on apoptotic induction.
KEY MESSAGE
1. Intermittent normobaric hyperoxia with carboplatin displays a synergistic tumoricidal effect
in a mouse lung cancer model.
2. Addition of hyperoxia to chemotherapy enhanced oxidative stress, which is considered to induce cell death mainly via apoptosis.
3. Intermittent normobaric hyperoxia may be a useful adjuvant therapy for lung cancer.


 PDF Links
 PubReader
 ePub Link
 Full text via DOI
 Download Citation
 Print
Print


