 |
 |
| Korean J Intern Med > Volume 34(5); 2019 > Article |
|
Abstract
Background/Aims
Methods
Results
Acknowledgments
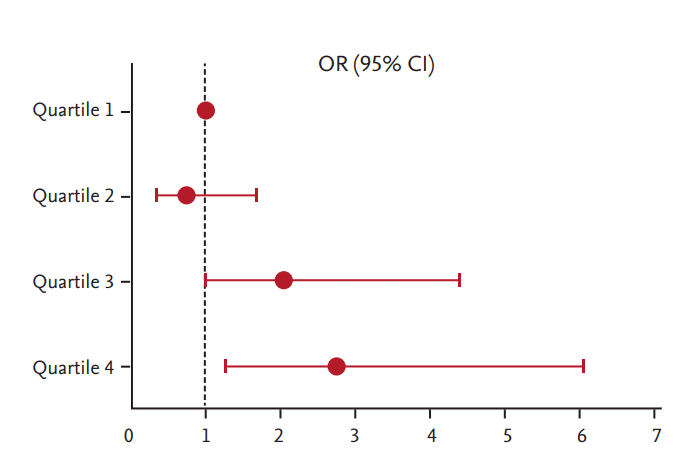
Figure 1.

Table 1.
Values are presented as mean ± SD or number (%). The p values represent differences between groups determined by a one-way analysis of variance for continuous variables and the chi-square test or the Fisher exact test for categorical variables.
DPP-4 I, dipeptidyl peptidase-4 inhibitor; HbA1c, glycated hemoglobin; HDL-C, high density lipoprotein cholesterol; LDL-C, low density lipoprotein cholesterol; ALT, alanine aminotransferase.
Table 2.
Values are presented as mean ± SD or number (%). The p values represent differences between groups determined by a one-way analysis of variance for continuous variables and the chi-square test or the Fisher exact test for categorical variables.
DPP-4 I, dipeptidyl peptidase-4 inhibitor; HbA1c, glycated hemoglobin; HDL-C, high density lipoprotein cholesterol; LDL-C, low density lipoprotein cholesterol; ALT, alanine aminotransferase.
Table 3.
Table 4.
Table 5.
| Variable | Quartile 1 (n = 112) | Quartile 2 (n = 113) | Quartile 3 (n = 113) | Quartile 4 (n = 113) | p for trend |
|---|---|---|---|---|---|
| Fasting glucagon-to-insulin ratio (n = 451) | |||||
| Model 1a | 1.00 (reference) | 0.451 (0.230–0.885) | 0.552 (0.289–1.055) | 1.080 (0.602–1.939) | 0.65 |
| Model 2b | 1.00 (reference) | 0.470 (0.239–0.927) | 0.582 (0.303–1.117) | 1.166 (0.642–2.119) | 0.49 |
| Model 3c | 1.00 (reference) | 0.468 (0.232–0.944) | 0.734 (0.366–1.474) | 1.539 (0.772–3.070) | 0.13 |
| Model 4d | 1.00 (reference) | 0.388 (0.184–0.818) | 0.566 (0.270–1.188) | 1.317 (0.631–2.749) | 0.33 |
| Postprandial glucagon-to-insulin ratio (n = 451) | |||||
| Model 1a | 1.00 (reference) | 0.799 (0.381–1.678) | 1.888 (0.981–3.633) | 2.248 (1.179–4.283) | < 0.01 |
| Model 2b | 1.00 (reference) | 0.874 (0.411–1.855) | 1.991 (1.029–3.856) | 2.391 (1.245–4.592) | < 0.01 |
| Model 3c | 1.00 (reference) | 0.902 (0.407–1.999) | 2.902 (1.394–6.042) | 3.681 (1.752–7.736) | < 0.01 |
| Model 4d | 1.00 (reference) | 0.739 (0.321–1.701) | 2.041 (0.946–4.405) | 2.730 (1.236–6.028) | < 0.01 |
Values are presented as odds ratios with the lowest quartile group of glucagon/insulin ratio as a reference. A p for trend < 0.05 was regarded as statistically significant.
HbA1c, glycated hemoglobin.


 PDF Links
 PubReader
 ePub Link
 Full text via DOI
 Download Citation
 Print
Print


