


INTRODUCTION
Hospitalized heart failure (HF) patients require more advanced medical care [1]. However, data on the clinical characteristics of these patients are scarce because studies in the past 30 years have focused on non-hospitalized HF patients. Hyponatremia is a common phenomenon that correlates with HF outcomes and has been identified as a prognostic factor in chronic HF patients in Western studies [23], although the prognostic value of hyponatremia in hospitalized HF patients remains to be established, particularly in Asian HF patients. In addition, the adherence to evidence-based therapy in hospitalized Asian HF patients is unknown.
The aim of the present multinational, multicenter study was to evaluate the prognostic value of hyponatremia and the adherence to evidence-based therapy in hospitalized Asian patients with systolic HF.
METHODS
Ethics statement
The present study was approved by the Institutional Review Board (IRB) or Ethics Committee of Seoul National University Bundang Hospital, Severance Hospital, Wonju Christian Hospital, National Taiwan University Hospital, Taipei Veterans General Hospital, Chang Gung Memorial Hospital, Fuwai Hospital, and Zhong Shan Hospital. Informed consent was waived by the IRB of each participating center that complied with the Declaration of Helsinki.
Study population
The study on the Clinical Outcomes in Relation with Serum Sodium Level in Asian Patients Hospitalized for Heart Failure (COAST) was a multinational, multicenter registry involving eight centers in South Korea, Taiwan, and China. The study population included all adult patients ≥ 18 years of age who were hospitalized for HF and left ventricular ejection fraction < 45% at admission since January 2009. HF was diagnosed with at least one of the pre-defined International Classification of Diseases 9 (ICD9)/ICD10 HF-related diseases, or with any disease corresponding to the codes. In total, 550 consecutive patients per region were scheduled to enroll for a sum of 1,650 patients. Index admission, discharge, and 1-year follow-up data were collected from each patient.
Patient demographic and baseline characteristics, underlying diseases, clinical presentation, causes of HF, treatment strategy (diuretics, nitrate, inotropes, anti-arrhythmics, anticoagulants, antiplatelet agents, blood transfusion), laboratory tests (serum sodium, potassium, creatinine, creatinine clearance, blood urea nitrogen), and outcomes during admission and after discharge were recorded. Data were collected at each site by trained study coordinators using a standardized case report form, and were entered into the COAST Registry database via a web-based electronic data capture system. Data collection and audits were performed by the COAST Registry Steering Committee.
Endpoints
The primary endpoint was the 12-month mortality from the index hospitalization for decompensated HF according to the serum sodium levels. Hyponatremia was defined as serum Na+ < 135 mmol/L. The secondary endpoints included the mortality rate at index-admission, 12-month rehospitalization rate, the composite of mortality and/or rehospitalization and 12-month mortality rate according to changes in serum sodium status during the hospital stay, and adherence to the evidence-based therapy according to serum sodium level.
Statistical analysis
Sample size calculation
Based on the EuroHeart Failure Survey study, the 12-month mortality rate among hospitalized HF patients was assumed to be 29.5% and 18.9% for hyponatremic and normonatremic patients, respectively [4]. Thus, a total of 1,650 patients were needed to detect a significant difference in 12-month mortality rate between the normonatremia and hyponatremia groups with a power of 0.80 and at a two-sided α level of 0.05.
Statistics
Data are presented as numbers and frequencies for categorical variables and as mean ± standard deviation (SD) for continuous variables. For comparison between groups, the chi-square test (or Fisher exact test when any expected cell count was < 5 for a 2 × 2 table) and McNemar tests were used for categorical variables, and the Mann-Whitney U tests were applied for continuous variables. The Kruskal-Wallis test and Wilcoxon ranksum test were used for comparisons of serum sodium with continuous measures, multilevel nominal measures, and dichotomous measures, respectively. A propensity score matching age, gender, region, left ventricle ejection fraction, systolic blood pressure (BP), serum potassium, serum creatinine, medical history, and basal metabolic index (BMI) was also performed between the normonatremia and hyponatremia groups. The variables were incorporated as predictors in a non-parsimonious logistic regression model with the presence of hyponatremia as the outcome. The propensity score was defined as the conditional probability of being a hyponatremic patient given the covariates listed above. Caliper matching was used to pair the hyponatremic patients to similar patients with normal sodium levels, as it was considered the most transparent method. This one-to-one match was performed without replacement. Multivariable models of 12-month mortality, in-hospital death, and length of hospital stay were developed to allow for assessing associations of these outcomes with other patient and clinical variables with consistent covariate adjustment. The following variables associated with 12-month mortality with p < 0.05 were included: age in decade, current smoking, BMI, diabetes mellitus, hypertension, glomerular filtration rate (GFR) mL/min/1.73 m2, coronary artery disease, stroke, chronic obstructive pulmonary disease (COPD), New York Heart Association (NYHA) Functional Class, hyponatremia, diastolic BP, serum potassium and use of angiotensin converting enzyme inhibitor (ACEi), angiotensin receptor blocker (ARB), β-blocker, calcium channel blocker (CCB), oral furosemide, spironolactone, or dobutamine. All of the data were analyzed using SAS version 9 (SAS Institute, Cary, NC, USA) by a professional statistician.
RESULTS
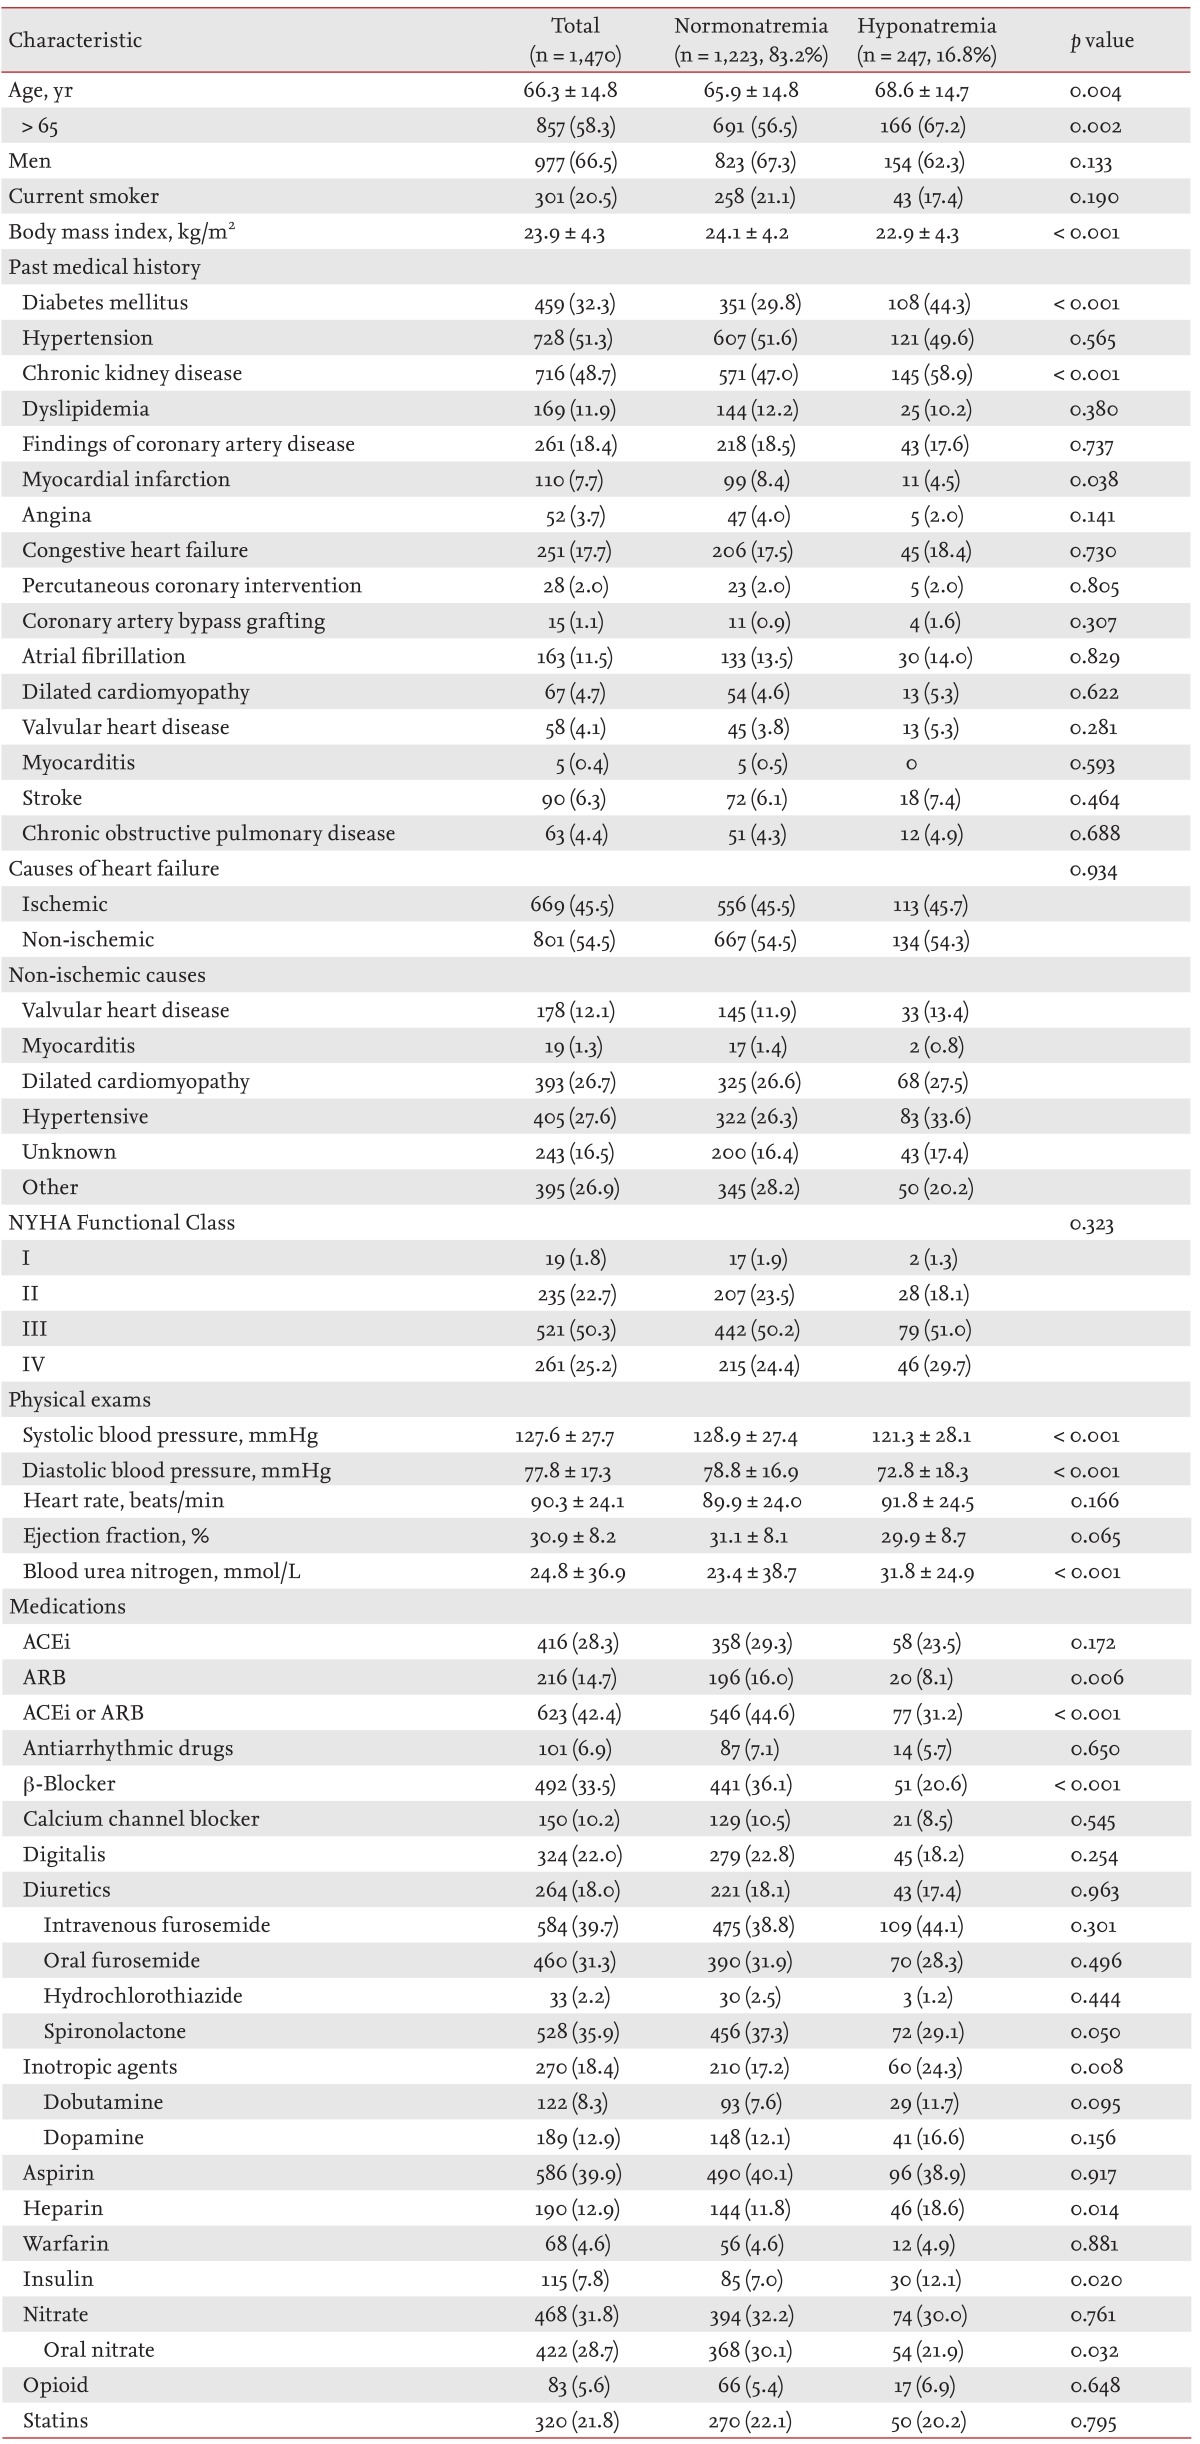
A total of 1,653 patients were initially assessed. In total, seven patients were not eligible due to violation of inclusion criteria, 17 patients had missing serum sodium levels, and 159 patients were lost to follow-up. Thus, 1,470 patients were available for the final analysis. The mean age was 66 years, and 67% of the patients were men, 32% had diabetes mellitus, 51% had hypertension, 49% had chronic kidney disease defined as GFR < 60 mL/min/1.73 m2, and 45% had ischemic cardiomyopathy as the cause for HF.
The mean admission sodium level was 138 ± 4.7 mmol/L and showed a unimodal distribution. Two hundred forty-seven patients (16.8%) had hyponatremia at hospital admission. Hyponatremic patients had more adverse baseline characteristics including older age (68.6 ± 14.7 years vs. 65.9 ± 14.8 years, p = 0.004), and a higher frequency of chronic kidney disease (58.9% vs. 47.0%, p < 0.001). They also had a lower frequency of myocardial infarction history (4.5% vs. 8.4%, p = 0.038), use of ACEi/ARBs (31.2 vs. 44.6%, p < 0.001), β-blocker (20.6% vs. 36.1%, p < 0.001), or spironolactone (29.1% vs. 37.3%, p = 0.050) (Table 1). In addition, on physical examination, hyponatremic patients had lower BP (systolic BP, 121.3 ± 28.1 mmHg vs. 129 ± 27.4 mmHg, p < 0.001; diastolic BP, 72.8 ± 18.3 mmHg vs. 78.8 ± 16.9 mmHg, p < 0.001). NYHA class did not differ between both groups (p = 0.323). The diuretic dose also did not differ between normonatremia and hyponatremia groups (intravenous furosemide: 34 ± 28.7 mg vs. 36.5 ± 34.3 mg, p = 0.569; oral furosemide: 30.6 ± 21.8 mg vs. 36.4 ± 30.7 mg, p = 0.287; thiazide 18 ± 9.8 mg vs. 13.8 ± 10.6 mg, p = 0.500; spironolactone 26.4 ± 16.3 mg vs. 26.3 ± 15.2 mg, p = 0.583).
Clinical outcomes
Two hundred forty-seven patients (16.8%) died in the first 12 months. The patients who died were older (71.9 ± 14.3 years vs. 65.2 ± 14.6 years, p < 0.001), had a lower BMI (22.2 ± 3.6 kg/m2 vs. 24.2 ± 4.3 kg/m2, p < 0.001), were less likely to be current smoker (13.8% vs. 21.8%, p = 0.004), and were more likely to have diabetes mellitus (40.8% vs. 30.6%, p = 0.002), hypertension (57.6% vs. 50.0%, p = 0.031), chronic kidney disease (20.4% vs.10.6%, p < 0.001), coronary artery disease (22.9% vs. 17.4%, p = 0.047), a previous history of stroke (9.8% vs. 5.6%, p = 0.015), COPD (6.9% vs. 3.9%, p = 0.037), and more advanced NYHA class (p < 0.001). They also had lower systolic BP (122.8 ± 28.9 mmHg vs. 128.6 ± 27.3 mmHg, p = 0.004), lower serum sodium level (136.7 ± 5.7 mmol/L vs. 138.6 ± 4.3 mmol/L), higher potassium level (4.4 ± 0.8 mmol/L vs. 4.3 ± 0.6 mmol/L, p = 0.017) and lower GFR (52.8 ± 29.1 mL/min/1.73 m2 vs. 65.9 ± 26.8 mL/min/1.73 m2) (Supplementary Table 1). Patients who died received less ACEi or ARB (30.0% vs. 44.9%, p < 0.001), β-blocker (25.9% vs. 35.0%, p = 0.007), CCB (6.9% vs. 10.9%, p = 0.026), or oral furosemide (26.3% vs. 32.3%, p = 0.028), but received more dobutamine (13.4% vs. 7.3%, p = 0.002).
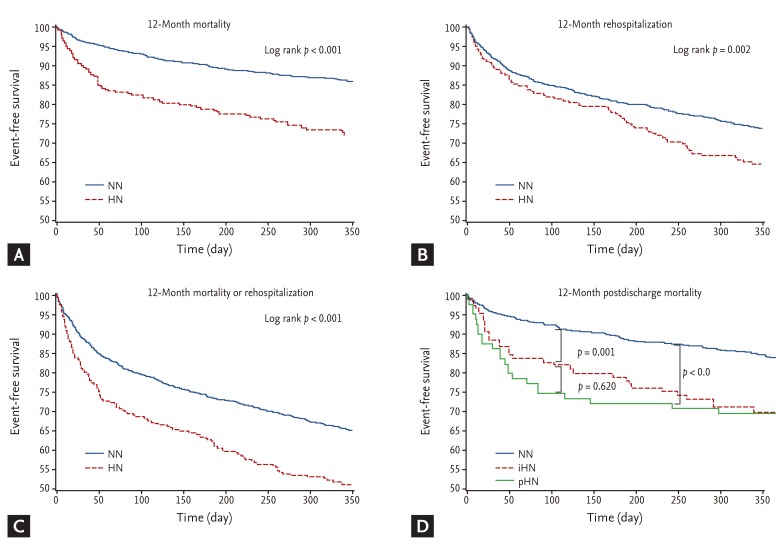
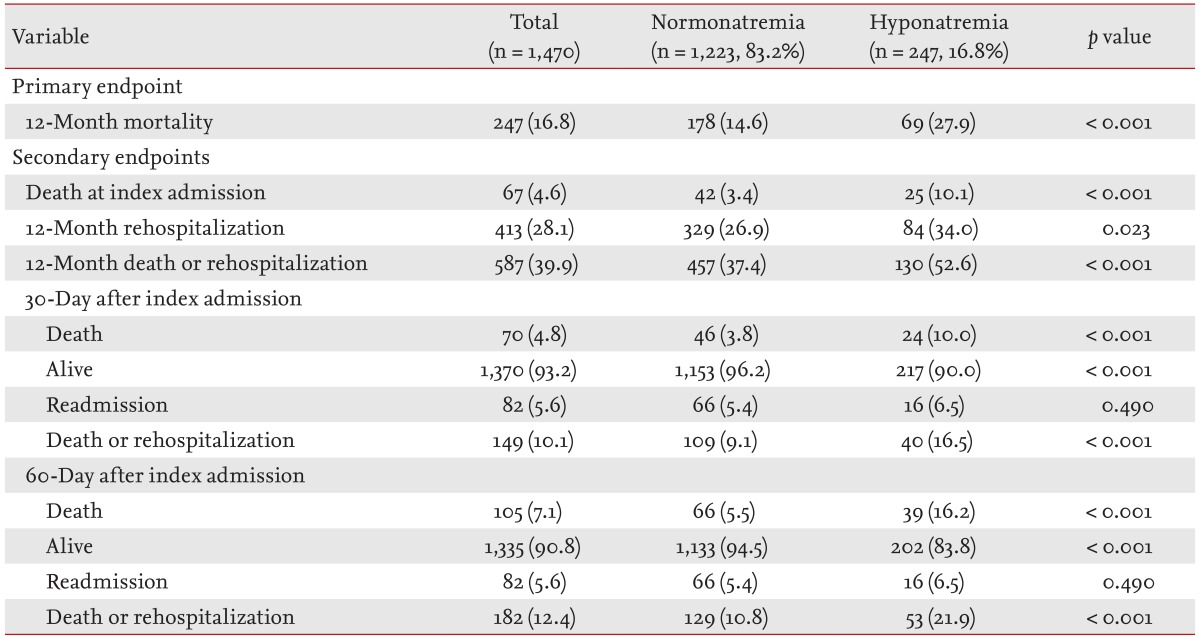
There was a "J-curve" relationship between the serum sodium level and 12-month mortality; patients with a serum sodium level of 140 mmol/L had the lowest 12-month mortality rate, and the mortality increased in both directions away from 140 mmol/L (Supplementary Fig. 1). The 12-month mortality rate was higher in the hyponatremia group than normonatremia group (27.9% vs. 14.6%, log-rank p < 0.001) (Fig. 1A). When analyzing the secondary endpoints, patients with hyponatremia had a higher 12-month rehospitalization rate (34.0% vs. 26.9%, log-rank p = 0.002) (Fig. 1B), and higher composite of 12-month death or rehospitalization (52.6% vs. 37.4%, log-rank p < 0.001) (Table 2, Fig. 1C).
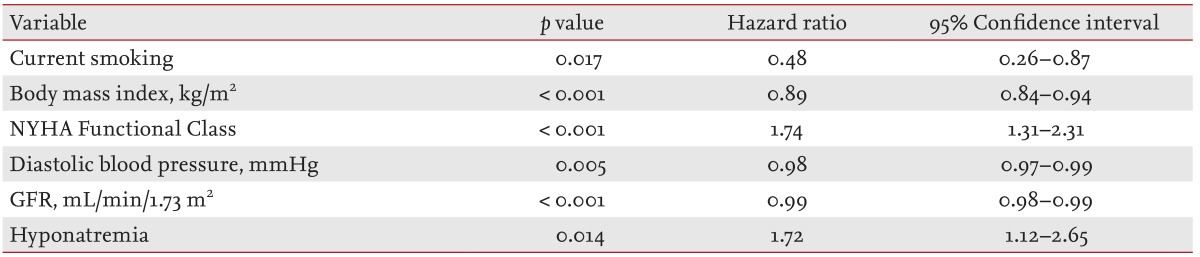
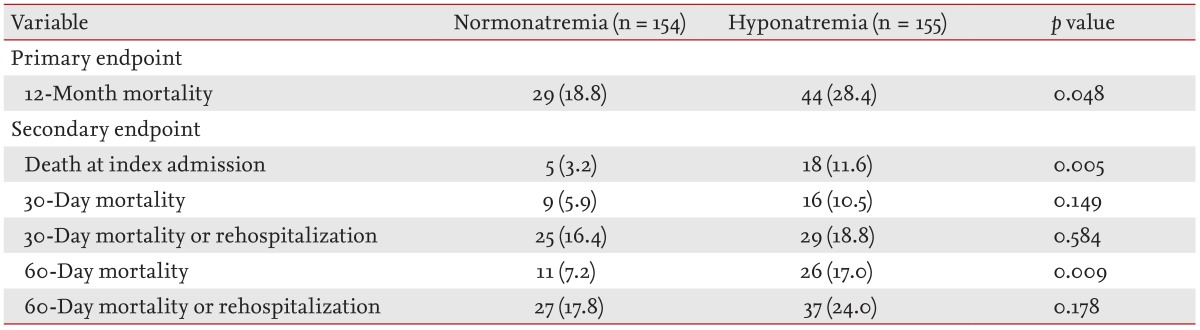
In the Cox proportional-hazards regression model, hyponatremia was an independent predictor of 12-month mortality with 72% increase in mortality (hazard ratio, 1.72; 95% confidence interval, 1.12 to 2.65), along with current smoking, BMI, GFR, NYHA Functional Class, and diastolic BP (Table 3). With regard to the relationship between 12-month mortality and clinical outcome, the mortality rate was lowest in patients with a serum sodium level of 140 mmol/L and increased with distance from 140 mmol/L. After propensity score matching for baseline characteristics, the data of 155 patients in each group were available. The primary endpoint was higher in the hyponatremia group than in the normonatremia group (28.4% vs. 18.8%, p = 0.048) (Table 4).
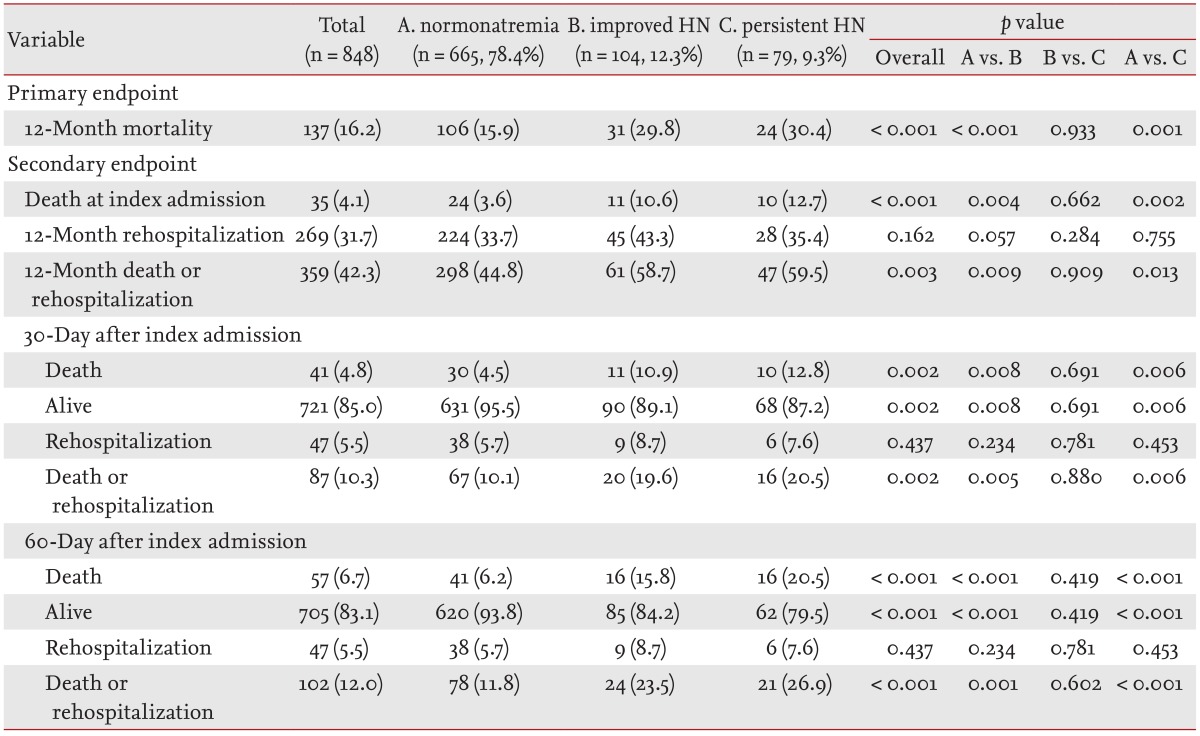
One hundred eighty-three patients with hyponatremia survived the discharge. Among those, 56.8% showed improvement of hyponatremia (improved HN) at the hospital discharge, whereas 43.2% showed persistent hyponatremia (persistent HN). Change in hyponatremia status was not associated with improvement in clinical outcome (Table 5, Fig. 1D).
HF management adherence to evidence-based guidelines regarding hyponatremia
By defining optimal medical treatment (OMT) as the combined use of ACEi/ARB, β-blocker, and/or aldosterone antagonists, the proportion of patients on OMT was only 12.8% in hyponatremia patients and 26.5% in normonatremia patients (p < 0.001) at index admission. At discharge, 33.5% of the hyponatremia patients and 44.2% of the normonatremia patients received OMT (p < 0.001), demonstrating that hyponatremic patients received less OMT compared to the normonatremic patients (Supplementary Table 2).
DISCUSSION
In the present multinational, multicenter study, we showed that hyponatremia at admission was common in hospitalized Asian HF patients and was an independent predictor of poor clinical outcomes. The correction of hyponatremia during hospital stay was not associated with improved outcomes, and adherence to OMT was lower in hyponatremia HF group compared to the normonatremia group. To the best of our knowledge, this is the first study to investigate the prognostic effect of hyponatremia and adherence to OMT in hospitalized HF-patients from three East-Asian countries.
Hyponatremia and its prognostic value
Hyponatremia was observed in 17% of the hospitalized HF patients. The rate was comparable that observed in other studies of acute decompensated HF [567]. Hyponatremic patients had unfavorable baseline characteristics, were less likely to receive OMT, and had worse clinical outcomes. The primary endpoint of 12-month mortality was 2-fold higher in the hyponatremia group than in the normonatremia group, and hyponatremia was associated with worse short-term, mid-term, and long-term outcomes. In the Organized Program to Initiate Lifesaving Treatment in Hospitalized Patients with Heart Failure (OPTIMIZE-HF) [8] and the Outcomes of a Prospective Trial of Intravenous Milrinone for Exacerbations of Chronic Heart Failure (OPTIME-CHF) [7], and sodium (per 3-mEq/L decrease from 140 mEq/L), there was an OR of 1.25, 1.18, and 1.10 for in-hospital mortality, 60-day mortality, and 60 to 90 day mortality, respectively. In our study, hyponatremia was associated with a 72% increased risk for 12-month mortality.
Hyponatremia develops slowly, paralleling the rate of progression of heart disease. The mechanistic explanation for the development of hyponatremia in HF patients is as follows: in HF patients, the low cardiac output and BP lead to (1) an increase in sympathetic tone; (2) activation of the renin-angiotensin-aldosterone system; and (3) non-osmotic release of vasopressin to preserve arterial blood volume and pressure [910]. Increased angiotensin II and aldosterone levels lead to decreased sodium and water delivery to the collecting duct, and result in impairment of free-water excretion and hyponatremia [9]. Furthermore, angiotensin II is a potent thirst stimulator and releases arginine vasopressin from neurohypophysis promoting free water intake and retention by increasing the number of aquaporin in the collecting duct [1112]. Finally, the concomitant use of diuretics in HF patients also contributes to hyponatremia. Because these neurohumoral changes are related to the severity of HF, hyponatremia identifies a group of HF patients in more advanced stages, explaining the worse clinical outcomes.
Treatment adherence of patients in Asian HF patients
The treatment strategy of hyponatremia in HF patients includes improvement of hemodynamics, fluid restriction, and the recent use of vasopressin receptor antagonists [5131415]. ACEi and ARBs reduce the afterload and improve the hemodynamics [1617], cardiac output, neurohumoral parameters [18], serum sodium levels, and survival [161719].
The American College of Cardiology/American Heart Association guideline recommends prescription of ACEi/ARB and β-blockers in all patients and aldosterone antagonists in selected HF patients [20]. The proportion of HF patients on OMT was only 26.5% at the index hospital admission, which reflects a low adherence to recommended treatment guidelines in "real world practice" in Asian HF-patients. The proportion of patients on OMT significantly increased to 44.2% at hospital discharge, which was lower than the rate observed in the OPTIMIZE-HF registry where > 80% of patients received ACEi/ARBs and β-blockers. It is important to note that more than half of the eligible Asian patients remained untreated with evidence-based therapies at hospital discharge. Furthermore, the underuse was more pronounced in hyponatremic patients. It is not clear whether the low adherence to OMT in hyponatremic patient can account for poorer clinical outcomes in hyponatremic patients, or whether OMT was withheld from hyponatremic patients because they had unfavorable clinical presentation. Hyponatremic HF patients are more susceptible to the hypotensive and azotemic effects of ACEi, possibly because they are more dependent on neurohormones to sustain BP. Therefore the initiation or up-titration of ACEi is particularly difficult in these patients [17]. However, hyponatremia identifies a high-risk population that may benefit from intensive medical treatment, and every effort should be made to ensure that all eligible patients receive evidence-based therapy.
Correction of hyponatremia
It is not clear, whether hyponatremia is a marker or mediator. In the present study, the improvement of hyponatremia was observed in 57% of hyponatremic patients during hospital stay. However, the postdischarge clinical outcomes of patients with improved hyponatremia did not differ from those with persistent hyponatremia. This result was similar to that of Lee et al. [21], who also showed that the improvement of hyponatremia during hospitalization was not associated with a lower incidence of composite endpoint of death or rehospitalization. These results indicate that short-term improvement of hyponatremia cannot be associated with improved prognosis. The post hoc analysis of the Efficacy of Vasopressin Antagonism in Heart Failure Outcome Study with Tolvaptan (EVEREST) trial demonstrated that correction of hyponatremia with tolvaptan improved outcomes [15]. Whether long-term improvement of hyponatremia is associated with better outcomes needs to be evaluated in further studies.
Limitations
There were several limitations in this study. Most importantly, the COAST study was not a prospective, randomized trial. Although we tried to adjust for significant clinical variables and performed propensity score matching for the analysis, unmeasured confounding factors may have biased the study result. Second, the COAST hospitals included nine self-selected centers in three nations. Therefore, the patients' management in each site may not be entirely representative of national care patterns of the participating nations and especially, each site or location may have a different socioeconomic background, medical resources, and trend for treatment.
In conclusion, in the present multinational, multicenter analysis, hyponatremia is common in a representative population of hospitalized HF-patients and serum sodium levels on admission is an important predictor of clinical outcomes, irrespective of whether hyponatremia improves during hospital stay. Furthermore, the adherence to evidence-based HF treatment is low in hospitalized Asian HF patients, and this observation suggests that additional strategies are needed to encourage physicians to prescribe the necessary medications in eligible HF patients.
KEY MESSAGE
1. Hyponatremia is common in among hospitalized Asian heart failure (HF) patients from South Korea, China, and Taiwan, and is associated with a 72% increased risk of 12-month mortality.
2. Hyponatremia is an important predictor of clinical outcomes, irrespective of whether hyponatremia improves during hospital stay.
3. The adherence to evidence-based HF treatment is low in hospitalized Asian HF patients, especially in those with hyponatremia.
 PDF Links
 PubReader
 ePub Link
 Full text via DOI
 Download Citation
 Print
Print


