INTRODUCTION
Endotracheal tube volume loss is observed during mechanical ventilation [1,2]. This is frequently caused by the accumulation of secretions and biofilm formation on the internal surface of the tube. These inevitable processes may worsen clinical outcomes through increased airway resistance, increased breathing work, delayed ventilator weaning, and ventilator-associated pneumonia [3-5]. Partial obstruction may be underestimated or unrecognized because of its insidious nature and lack of proper detection methods.
Endotracheal tube obstruction causes an increase in airway pressure or a decrease in tidal volume in volume-controlled or pressure-controlled ventilation modes in mechanically ventilated patients, respectively. However, these changes are usually detected once obstruction has reached a significant level [6-8]. Acoustic reflection methods and pressure oscillation analyses have been proposed as alternative methods [9,10], and although they have potential, these methods require specialized equipment. Changes in expiratory time constants, which can be calculated from flow-volume curves, are another good indicator for detecting a partial obstruction [7,8,11]. Expiratory time constants are higher in obstructed compared to unobstructed tubes. Although changes in expiratory flow occur earlier than peak airway pressure or tidal volume changes, obstruction that does not change expiratory flow could occur.
Sound signals from endotracheal tubes contain various frequencies that can be easily recorded and analyzed non-invasively. We hypothesized that those sounds change with the degree of endotracheal tube obstruction. We conducted this study to identify whether endotracheal tube sound could be used to detect an obstruction using an in vitro model.
METHODS
Experimental setup
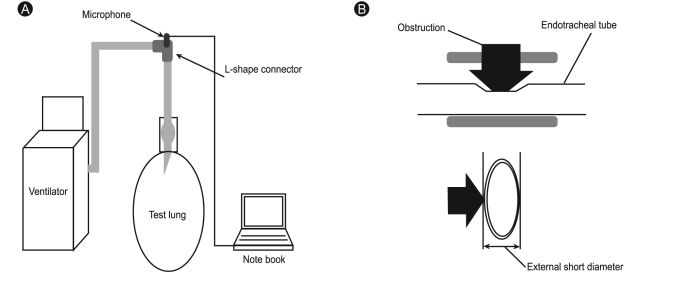
An experimental model was built to simulate mechanical endotracheal tube ventilation using a ventilator (Servo-I, MAQUET, Rastatt, Germany) with an internal diameter (ID) of 5.0-8.0 mm, a Murphy-tipped endotracheal tube (Euromedical Industries, Kedah, Malaysia), and a rubber test lung (volume, 2 L). The distal end of the endotracheal tube was connected to the rubber lung, and the proximal end was connected to the ventilator circuit. An L-shape connector was inserted between the ventilator circuit and the endotracheal tube, with a small microphone (STG Stethoscope, Stethographics Inc., Boston, MA, USA) located inside the artificial respiratory system (Fig. 1A). When the test lung was ventilated, airflow through the endotracheal tube made sounds, which were recorded using the microphone connected to a computer.
Ventilator settings
We used the pressure-controlled mode of ventilation. Positive end-expiratory pressure (PEEP) was 5 cmH2O, over-PEEP pressure was 20 cmH2O, respiratory rate was 15, the ratio of inspiration to expiration was 1:2, and the O2 fraction was 0.21.
Obstruction model
An artificial obstruction was created using focal, 8-mm-long, extrinsic, non-concentric compression of an ID 8.0 endotracheal tube (Fig. 1B). The degree of obstruction was assessed by semi-quantitative methods, from grade 0 (defined as unobstructed but with the obstructing device attached to the endotracheal tube, 11 mm external short diameter) to grade 4 (5 mm external short diameter). The location of the obstruction was changed from proximal to distal along the endotracheal tube. Proximal, mid, and distal were defined as the highest point, just above the cuff tube, and just above the endotracheal tube balloon, respectively.
Sound recording and analysis
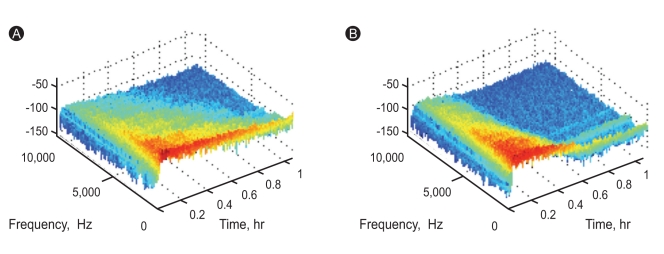
The sounds were recorded at 22,050 Hz and 16 bits, analyzed according to previously described methods [12], and saved in wave file format on a computer. The duration of recording for each sound was 3 minutes, and each sound file contained 45 inspirations and expirations. Among the recorded inspiratory and expiratory sounds, we selected 45 expiratory sounds for data analysis. Unwanted noises were rare among original endotracheal tube sounds; hence, the recorded sounds were not filtered (Fig. 2). We calculated the signal energy [W ├Ś s] of each expiratory sound according to Parseval's theorem [13,14] after fast Fourier transformation.
Statistical analysis
Energy values are expressed as means and 95% confidence intervals (CI). The Student's t test was used to compare the means. A p value < 0.05 was considered statistically significant. We used MATLAB software (MathWorks, Natick, MA, USA) for plotting, fast Fourier transformation, and sound analysis. SPSS version 17.0 (SPSS Inc., Chicago, IL, USA) was used for statistical analysis.
RESULTS
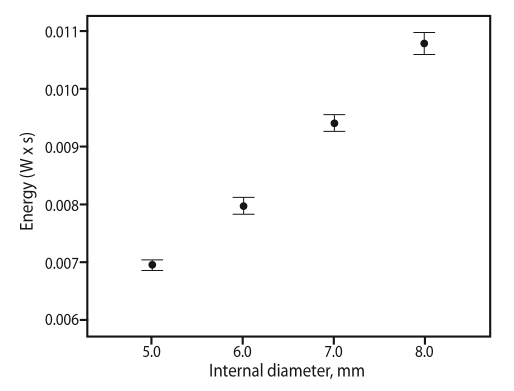
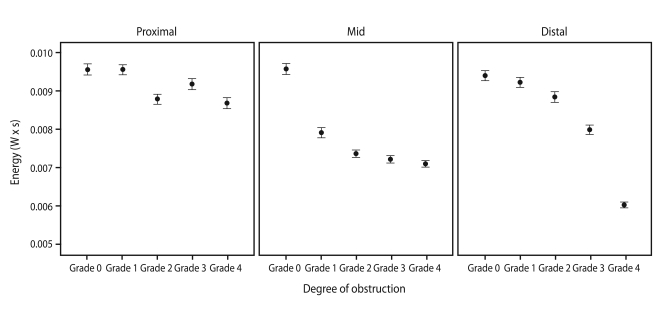
A positive correlation was found between expiratory sound energy and the ID of the endotracheal tube (Fig. 3): the narrower the tube, the lower the sound energy (p < 0.001). Similar results were observed in the obstruction model (Fig. 4). As the degree of obstruction was increased (narrowed ID), the expiratory sound energy decreased, regardless of obstruction location. The rate of energy decline differed depending on the location of the obstruction (Fig. 4), decreasing at an increasing rate from the proximal to the distal area of the tube. The ╬▓ values for proximal, mid, and distal obstruction were -2.13 ├Ś 10-4 (CI, -2.58 ├Ś 10-4 to -1.69 ├Ś 10-4; p < 0.001), -5.66 ├Ś 10-4 (CI, -6.18 ├Ś 10-4 to -5.13 ├Ś 10-4; p < 0.001), and -8.01 ├Ś 10-4 (CI, -8.60 ├Ś 10-4 to -7.42 ├Ś 10-4; p < 0.001) respectively, and the rate of decline was statistically significant (p for interaction < 0.001).
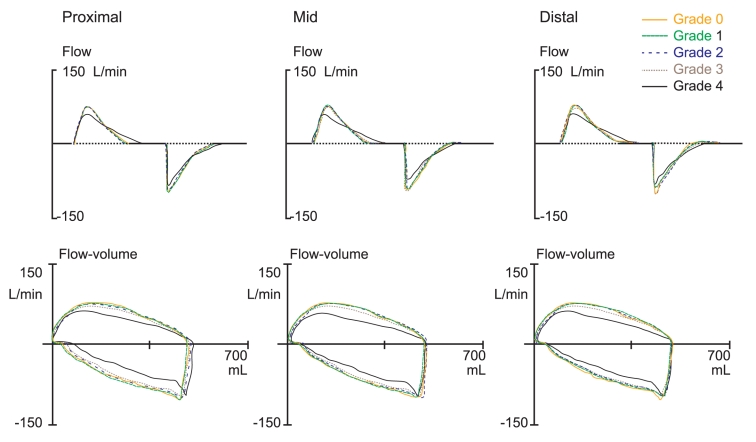
Time-flow and flow-volume curves changed as the endotracheal tube was obstructed, but obvious flow change was observed only under a grade 4 obstruction (Fig. 5). Less than a grade 4 obstruction resulted in no change in flow.
DISCUSSION
This study is the first description of the changes in the sound of an endotracheal tube, using an airway-obstruction model. The sound made by an endotracheal tube can easily be recorded without disconnecting ventilation, and rarely contains random noises. The aim of this study was to evaluate the feasibility of using such sounds to detect a partial obstruction. When air flows through an endotracheal tube, sound energy can be measured and quantified, which can be used as a comparative parameter. Our results showed a correlation between sound energy and the ID and degree of obstruction.
In the obstruction model, comparison of time-flow and flow-volume curves obtained from the mechanical ventilator for grade 0-3 obstructions showed little change in flow, indicating that these levels of obstruction were not significantly different from a grade 0 obstruction (Fig. 5). Significant changes in flow were only observed for grade 3-4 obstructions. However, changes in sound energy were observed during early obstruction (Fig. 4), suggesting that changes in sound energy are an earlier event compared to changes in flow during endotracheal tube obstruction.
The sound energy clearly decreased with an increased degree of obstruction. Expiratory airf low was generated by elastic recoil in the test lung, which was the same force regardless of the degree of obstruction. When the obstruction was increased, laminar flow changed to turbulent flow, and the loss of energy was delivered to the microphone. As the distance of the microphone from the location of the obstruction was increased, the rate of energy loss decreased rapidly (Fig. 4). This finding was also observed in a previous study using a large airway-obstruction model [15].
Several previous studies have used sound for airway management. Acoustic reflectometry has been used to identify esophageal intubation [16,17] and endotracheal tube volume loss [1,2]. Although this method acquires endotracheal tube images in a few seconds, the tubes must be disconnected from the ventilator during measurement, and the patients cannot be supported by mechanical ventilation with oxygen during that time. This procedure could be harmful to critically ill patients and requires specialized equipment.
Our study has several limitations. We compared recorded sound energy, and thus the quantity not the quality of sound. The energy was recorded differently in various situations depending on factors such as hardware settings of the recording system. To minimize this variation, we recorded all sounds from the same place in 1 day under the same recording system settings. We did not observe any differences in frequency. The model used extrinsic and non-concentric semi-quantitative obstructions, which do not represent real luminal narrowing. In practice, endotracheal tube obstruction is mostly caused by the accumulation of biomaterial inside the tube, which may change sound quality in the clinical setting.
Some other considerations are essential before applying these results to clinical practice. Most of all, many noises are prominent in real-world intensive care units. Different machines such as hemodialysis devices, intra-aortic balloon pumps, and suction apparatuses are used, and many other sounds are generated from these machines. Thus, noise-canceling technologies and algorithms are needed. Second, patients who require endotracheal intubation and mechanical ventilation usually have diseased lungs, such as acute respiratory distress syndrome or chronic obstructive pulmonary disease, and these conditions could also affect the recorded sounds. Third, a qualitative sound analysis is needed.
In conclusion, endotracheal tube sounds can be recorded with minimal random noises in vivo, and can be used to detect endotracheal tube obstruction by measuring sound energy. Further studies are needed to evaluate its clinical application.


 PDF Links
 PubReader
 ePub Link
 Full text via DOI
 Download Citation
 Print
Print


