


INTRODUCTION
Obesity is a serious health problem worldwide with increasing prevalence, which has reached 40% in the United States and has been consistently rising in Asia [1]. Obesity is strongly associated with metabolic abnormalities, such as high blood pressure, dyslipidemia, high blood sugar levels, insulin resistance, and increased inflammation [2ŌĆō4], as well as with increased risk for cardiovascular and all-cause mortality [5,6]. In addition, obesity is associated with development of chronic kidney disease (CKD). A high body mass index (BMI) is strongly related to decrease in estimated glomerular filtration rate (eGFR) and progression to end-stage CKD [7,8]. Several mechanisms have been proposed to promote renal dysfunction in people with obesity, such as glomerular hyperfiltration, inflammation, and endothelial dysfunction [9,10]. CKD is a major public burden with rising global prevalence, imposing the need to identify and mitigate its associated risk factors.
The World Health Organization defines obesity as ŌĆ£an excessive fat accumulation [11].ŌĆØ Although BMI is a simple and useful tool, it tends to be affected by muscle mass. In addition, the BMI does not address regional adiposity. Thus, the waist-to-hip ratio (WHR), a measure of central obesity, may be a better tool for assessing obesity.
Obesity might be a representative modifiable risk factor for incident CKD. However, many studies have looked at obesityŌĆÖs impact on outcomes in CKD patients, thereŌĆÖs little research on how obesity in the general population can lead to CKD. In this study, we evaluated both BMI and WHR as risk factors for the development of incident CKD in the general population from the Korean Genome and Epidemiology Study (KoGES), which is a community-based prospective cohort study [12]. Moreover, to determine whether reducing obesity is beneficial for preventing renal dysfunction, we also compared renal function between individuals with maintained obesity and those with reduced obesity.
METHODS
Study population
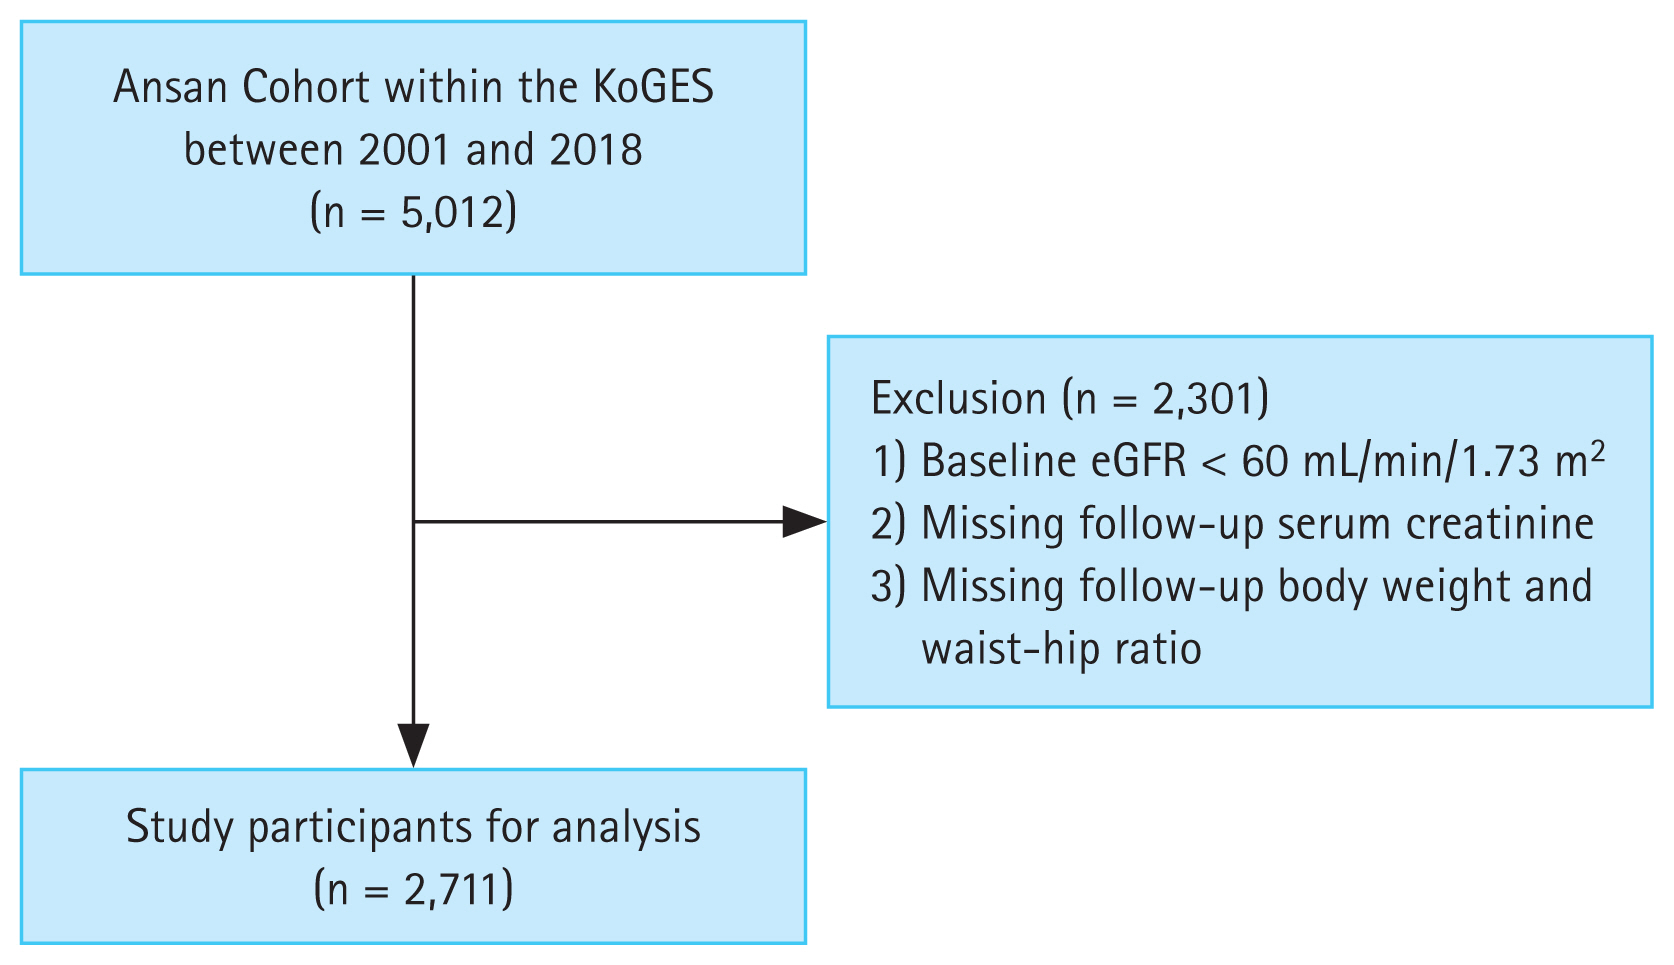
The KoGES is a large, prospective, community-based cohort study funded by the government. The detailed profile and methods concerning the development of KoGES have been previously described [12]. The present study included KoGES participants who were residents of Ansan, Korea. We excluded participants with an eGFR < 60 mL/min/1.73 m2 and those with missing follow-up data on serum creatinine levels and body weight.
All study participants voluntarily enrolled the KoGES after providing informed consent. This study was performed in accordance with the Declaration of Helsinki and was approved by the Institutional Review Board of Chonnam National University Hospital (CNUH-EXP-2022-094).
Anthropometric and laboratory data
All participants underwent comprehensive health examinations and filled out questionnaires on health and lifestyle at the time of enrollment. Serial health examinations and surveys were performed biennially from 2001 to 2018.
The following demographic and socioeconomic data were collected from the KoGES database: age, sex, alcohol intake, smoking status, and medical history. Diabetes mellitus (DM) and hypertension (HTN) were diagnosed based on the responses to the past medical history in the administered questionnaire. Information on alcohol intake and smoking status were obtained through questionnaires. Anthropometric parameters, including height, weight, waist circumference, and hip circumference, were measured by skilled study workers following standard methods. Blood pressure was measured after resting for more than 5 minutes in a sitting position.
Blood and urine samples were obtained after an 8-hour fasting and transported to a central laboratory (Seoul Clinical Laboratories, Seoul, Korea). The following biochemical data were determined: concentrations of blood urea nitrogen, creatinine, albumin, glucose, total cholesterol, triglyceride, low-density lipoprotein (LDL) cholesterol, high-density lipoprotein (HDL) cholesterol, glycated hemoglobin (HbA1c), hemoglobin, and C-reactive protein (CRP). Serum creatinine levels were measured using an isotope dilution mass spectrometry-traceable method. The eGFR was calculated using the CKD-EPI equation [13]. Proteinuria was measured categorically, and we defined proteinuria by classifying the ŌĆśnegativeŌĆÖ and ŌĆśtraceŌĆÖ group as group without proteinuria, and ŌĆś1 positiveŌĆÖ to ŌĆś4 positiveŌĆÖ as group with proteinuria. Insulin resistance was determined by the homeostasis model assessment of insulin resistance (HOMA-IR): Fasting glucose (mg/dL) ├Ś fasting insulin (╬╝IU/mL) / 405.
Definitions of obesity, obesity reduction, and study outcomes
Obesity was defined both by the BMI and WHR. BMI was calculated by dividing the weight (kg) by the squared height (m2) and categorized as normal weight (BMI 18.5ŌĆō22.9 kg/m2), overweight (BMI 23ŌĆō24.9 kg/m2), or obesity (BMI Ōēź 25 kg/m2) according to the International Association for the Study of Obesity, International Obesity Task Force (2000), and Committee of Clinical Practice Guidelines and Korean Society for the Study of Obesity Guidelines [14]. WHR was calculated by dividing waist circumference by hip circumference. Obesity was defined as an WHR Ōēź 0.9 for men and Ōēź 0.85 for women [15].
The study outcome was incident CKD rate during the follow-up period, which was defined as a composite eGFR of < 60 mL/min/1.73 m2 for at least two consecutive measurements.
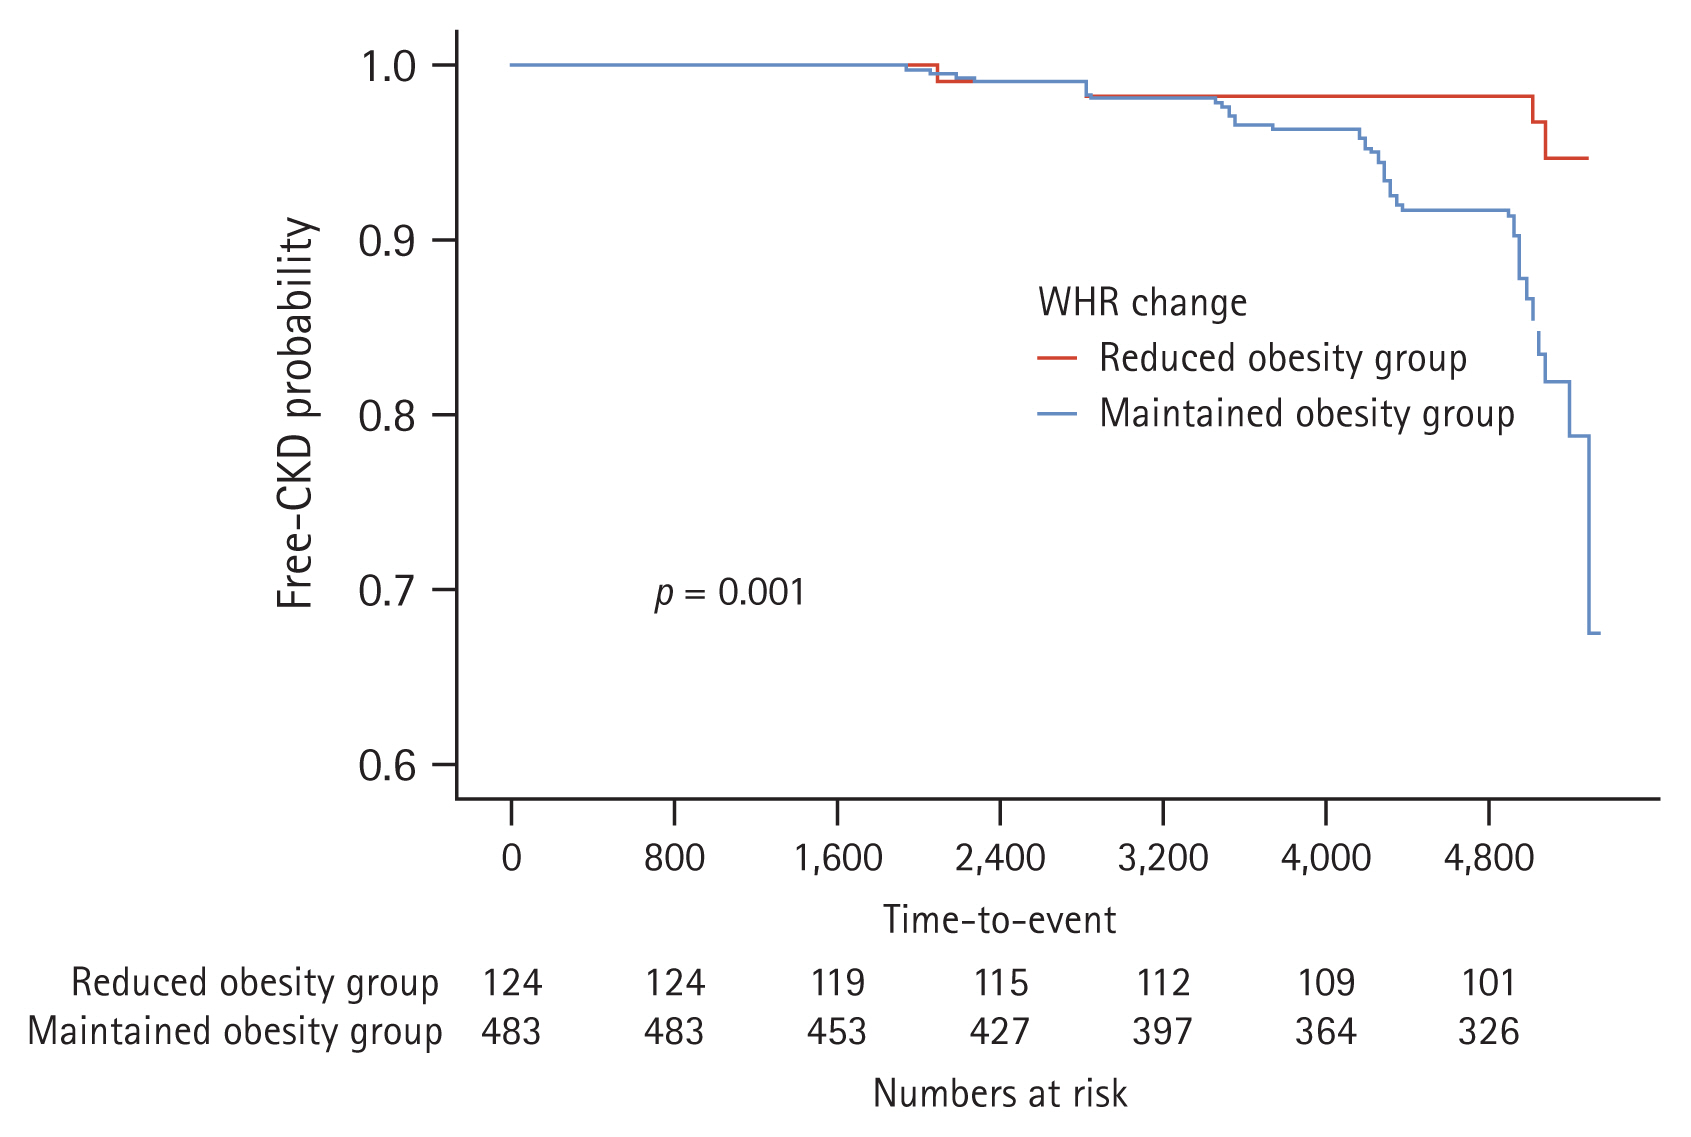
To evaluate the effect of obesity reduction on CKD development, we analyzed the changes in WHR from baseline to year 4. For this purpose, participants with an WHR Ōēź 0.9 for men and Ōēź 0.85 for women at both baseline and year 4 were defined as the maintained obesity group, while those with an WHR Ōēź 0.9 for men and Ōēź 0.85 for women at baseline and WHR < 0.9 for men and < 0.85 for women at year 4 were defined as the reduced obesity group. To determine the relationship between early WHR changes and subsequent CKD development, we only analyzed adverse renal events that occurred 4 years after the WHR assessment period.
Statistical analysis
Statistical analyses were performed using R version 4.2.2 (R Foundation for Statistical Computing, Vienna, Austria). Continuous variables were summarized as mean ┬▒ standard deviation, and categorical variables as number (percentage). All data were tested for normality before analysis. A t-test or MannŌĆōWhitneyŌĆÖs U test was conducted to compare continuous variables, and the chi-square test was used to compare categorical variables. To analyze the changes in participantsŌĆÖ metabolic profile parameters during the follow-up period, we compared time-averaged values of fasting glucose, HbA1c, the HOMA-IR, CRP, and lipid profiles, which were analyzed as an average of the parameters examined at every follow-up visit.
Multivariable Cox regression models using cubic spline curves were used to determine the nonlinear association between the BMI or WHR and the risk of incident CKD. KaplanŌĆōMeier survival curves with log-rank tests and univariable Cox proportional hazards models were used to examine the effect of BMI or WHR on incident CKD. Multivariable Cox proportional hazards regression analysis was employed to identify independent risk factors for incident CKD. Hazard ratios (HRs) and 95% confidence intervals (CIs) were calculated to estimate the risk of incident CKD. We examined the assumption of the proportional hazard in the Cox model using cox.zph() in R. Age- and sex-adjusted HRs were first calculated (model 1), and the results were further adjusted for HTN, DM, alcohol consumption, and smoking (model 2), and further for LDL cholesterol, hemoglobin, CRP, and baseline eGFR (model 3). For all analyses, a p value < 0.05 was considered to indicate statistical significance.
RESULTS
Baseline characteristics of the study population
Of the 5,012 participants screened, 2,711 (age range: 40ŌĆō69 yr) were included in the final analysis (Fig. 1). The baseline characteristics of the total study population according to their BMI are presented in Table 1. Participants in the obesity group were predominantly older, had lower income, higher incidence of DM and HTN, higher HbA1c and triglyceride levels, and lower HDL cholesterol levels than those in the normal weight group.
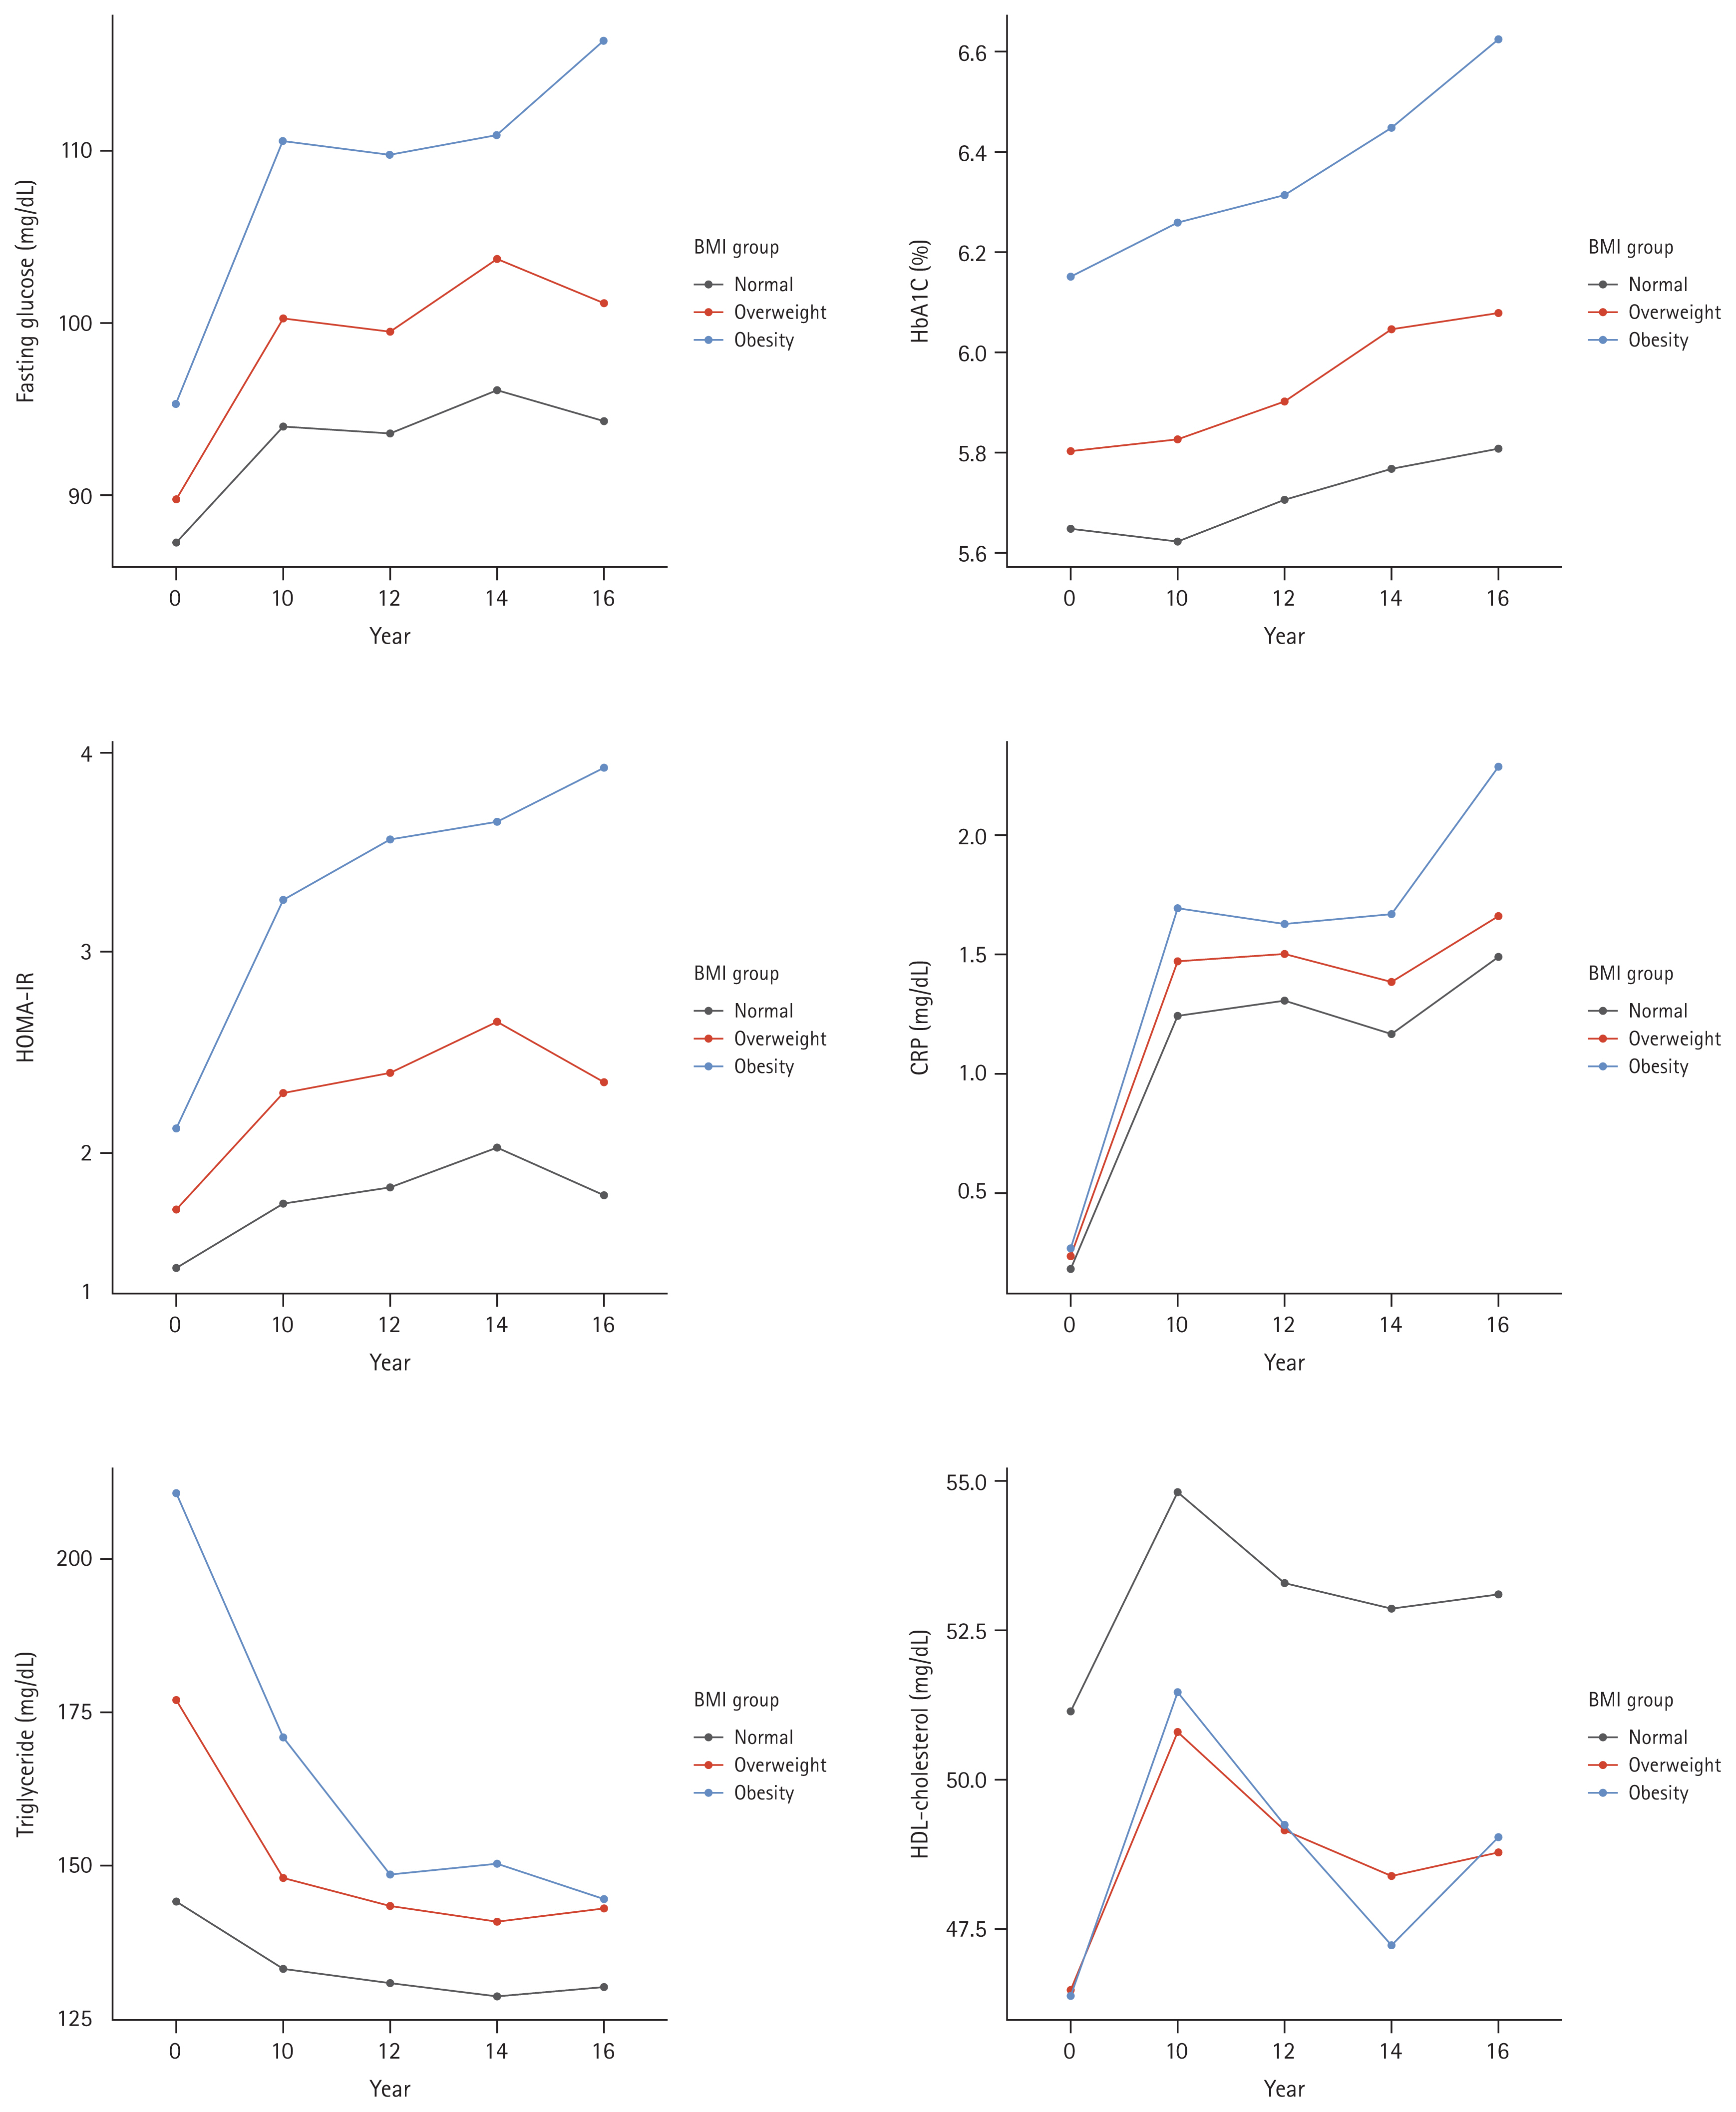
Changes in metabolic profile parameters during follow-up
During the follow-up period, the obesity group had persistently lower levels of HDL-cholesterol, and higher levels of fasting glucose, HbA1c, HOMA-IR, CRP, and triglycerides (Fig. 2).
Risk of incident CKD
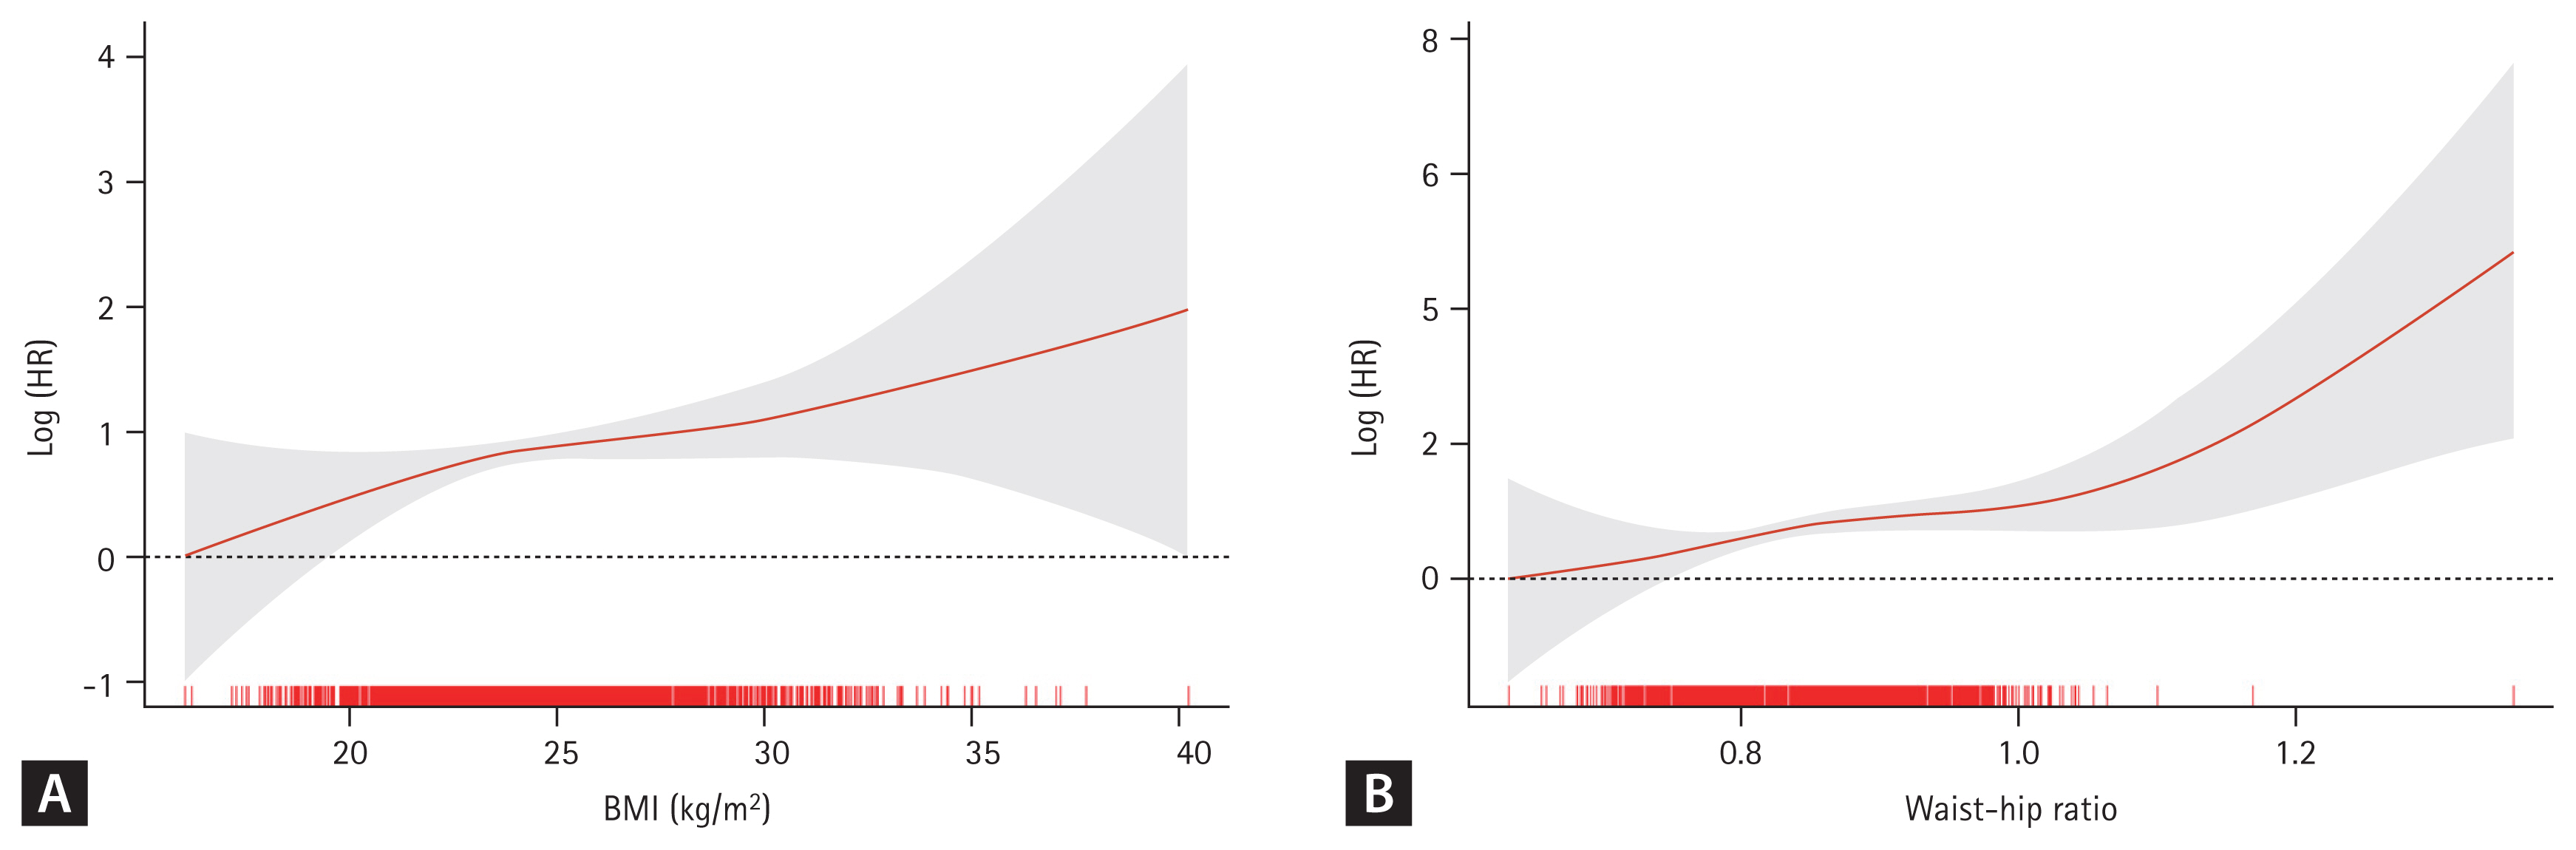
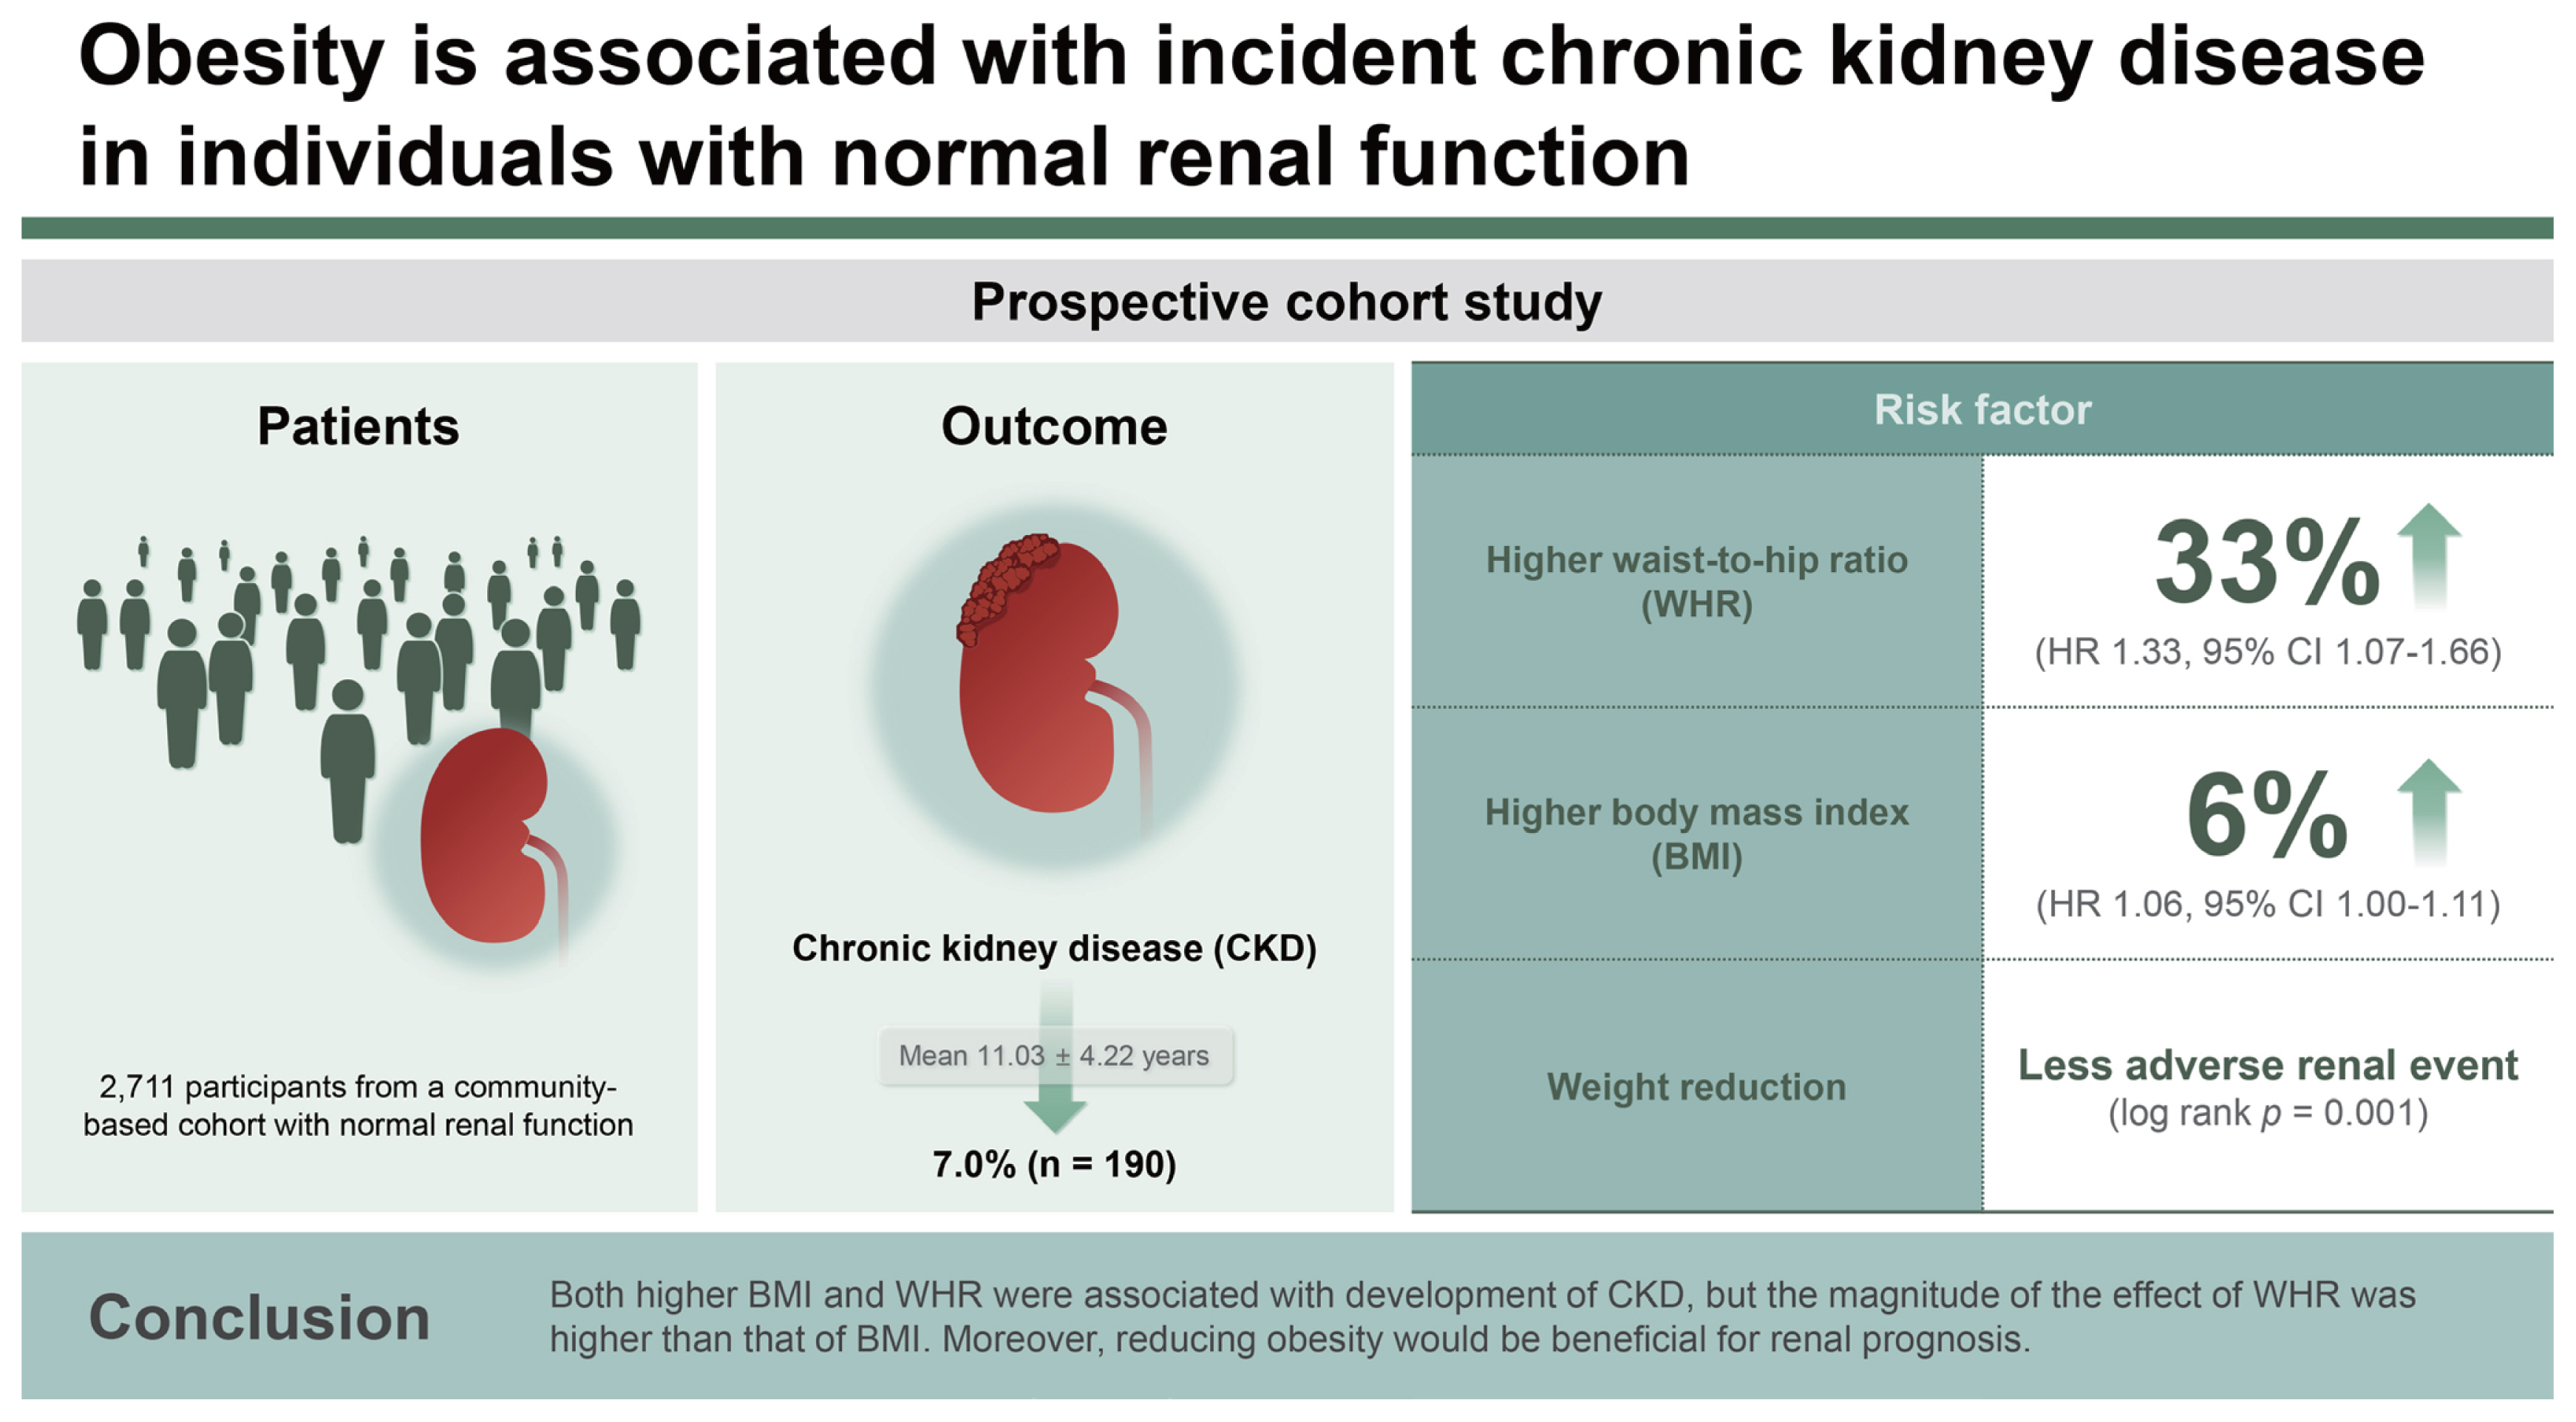
During a mean follow-up of 11.03 ┬▒ 4.22 years, incident CKD occurred in 190 (7.0%) participants. In the fully adjusted Cox proportional hazards model (Table 2), BMI and WHR exhibited a positive correlation with the risk for incident CKD (Fig. 3). The risk for incident CKD increased with higher BMI (HR, 1.06; 95% CI, 1.00ŌĆō1.11; p = 0.033) and higher WHR (HR, 1.33; 95% CI, 1.07ŌĆō1.66; p = 0.009).
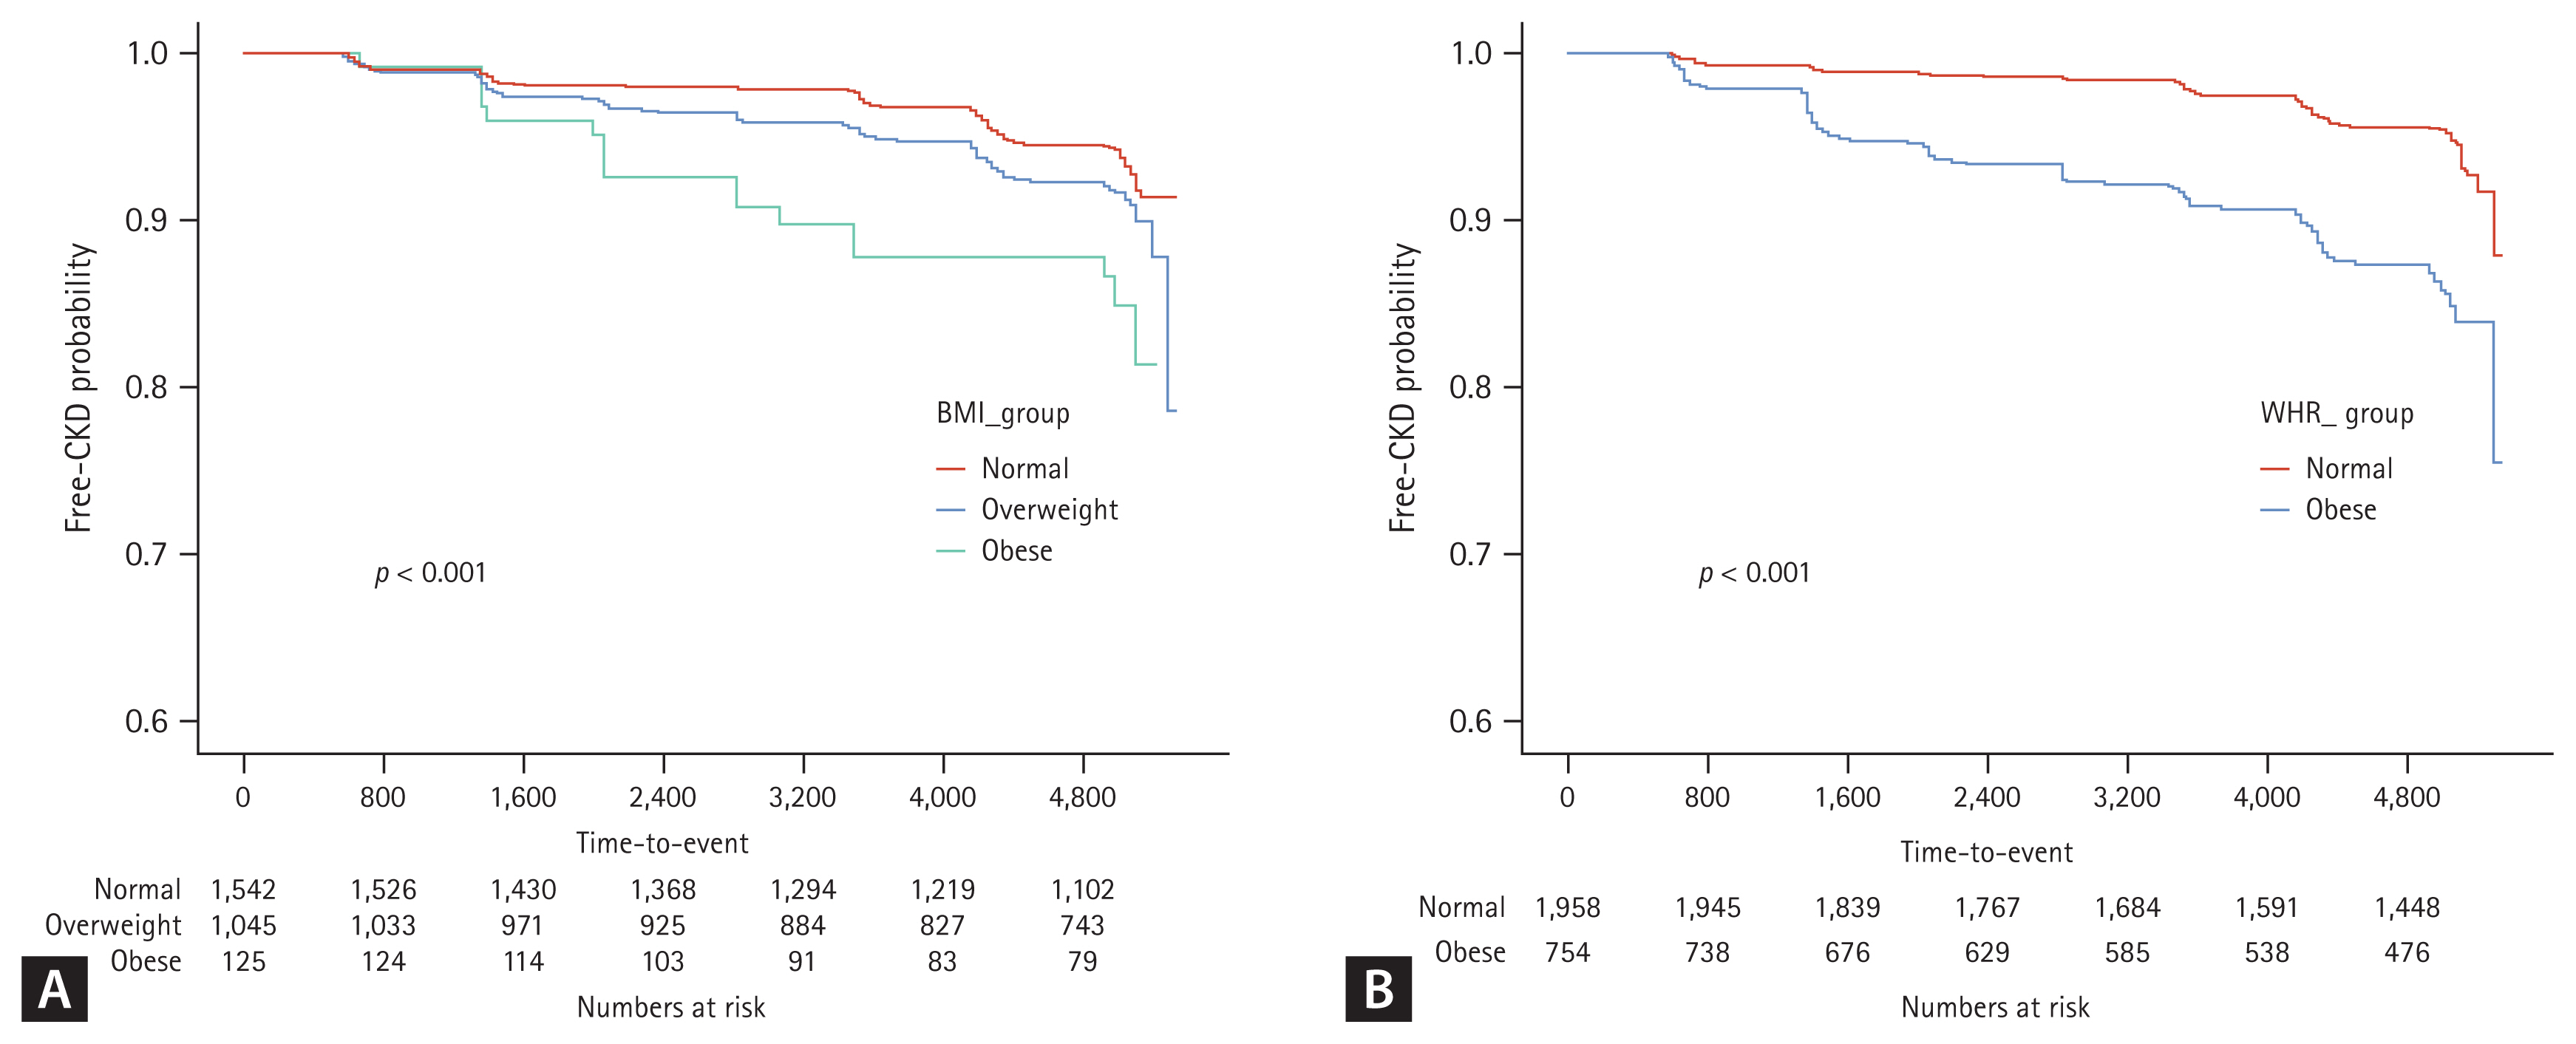
In the KaplanŌĆōMeier analysis for free-of-CKD probability (Fig. 4), the cumulative incidence of CKD development was significantly high (p < 0.001) in both obesity groups classified by BMI and WHR.
In the analysis of the effects of obesity reduction on incident CKD (Fig. 5), the KaplanŌĆōMeier curves showed that the rate of cumulative adverse renal events was significantly in the maintained obesity group than in the reduced obesity group (p = 0.001).
Subgroup analyses
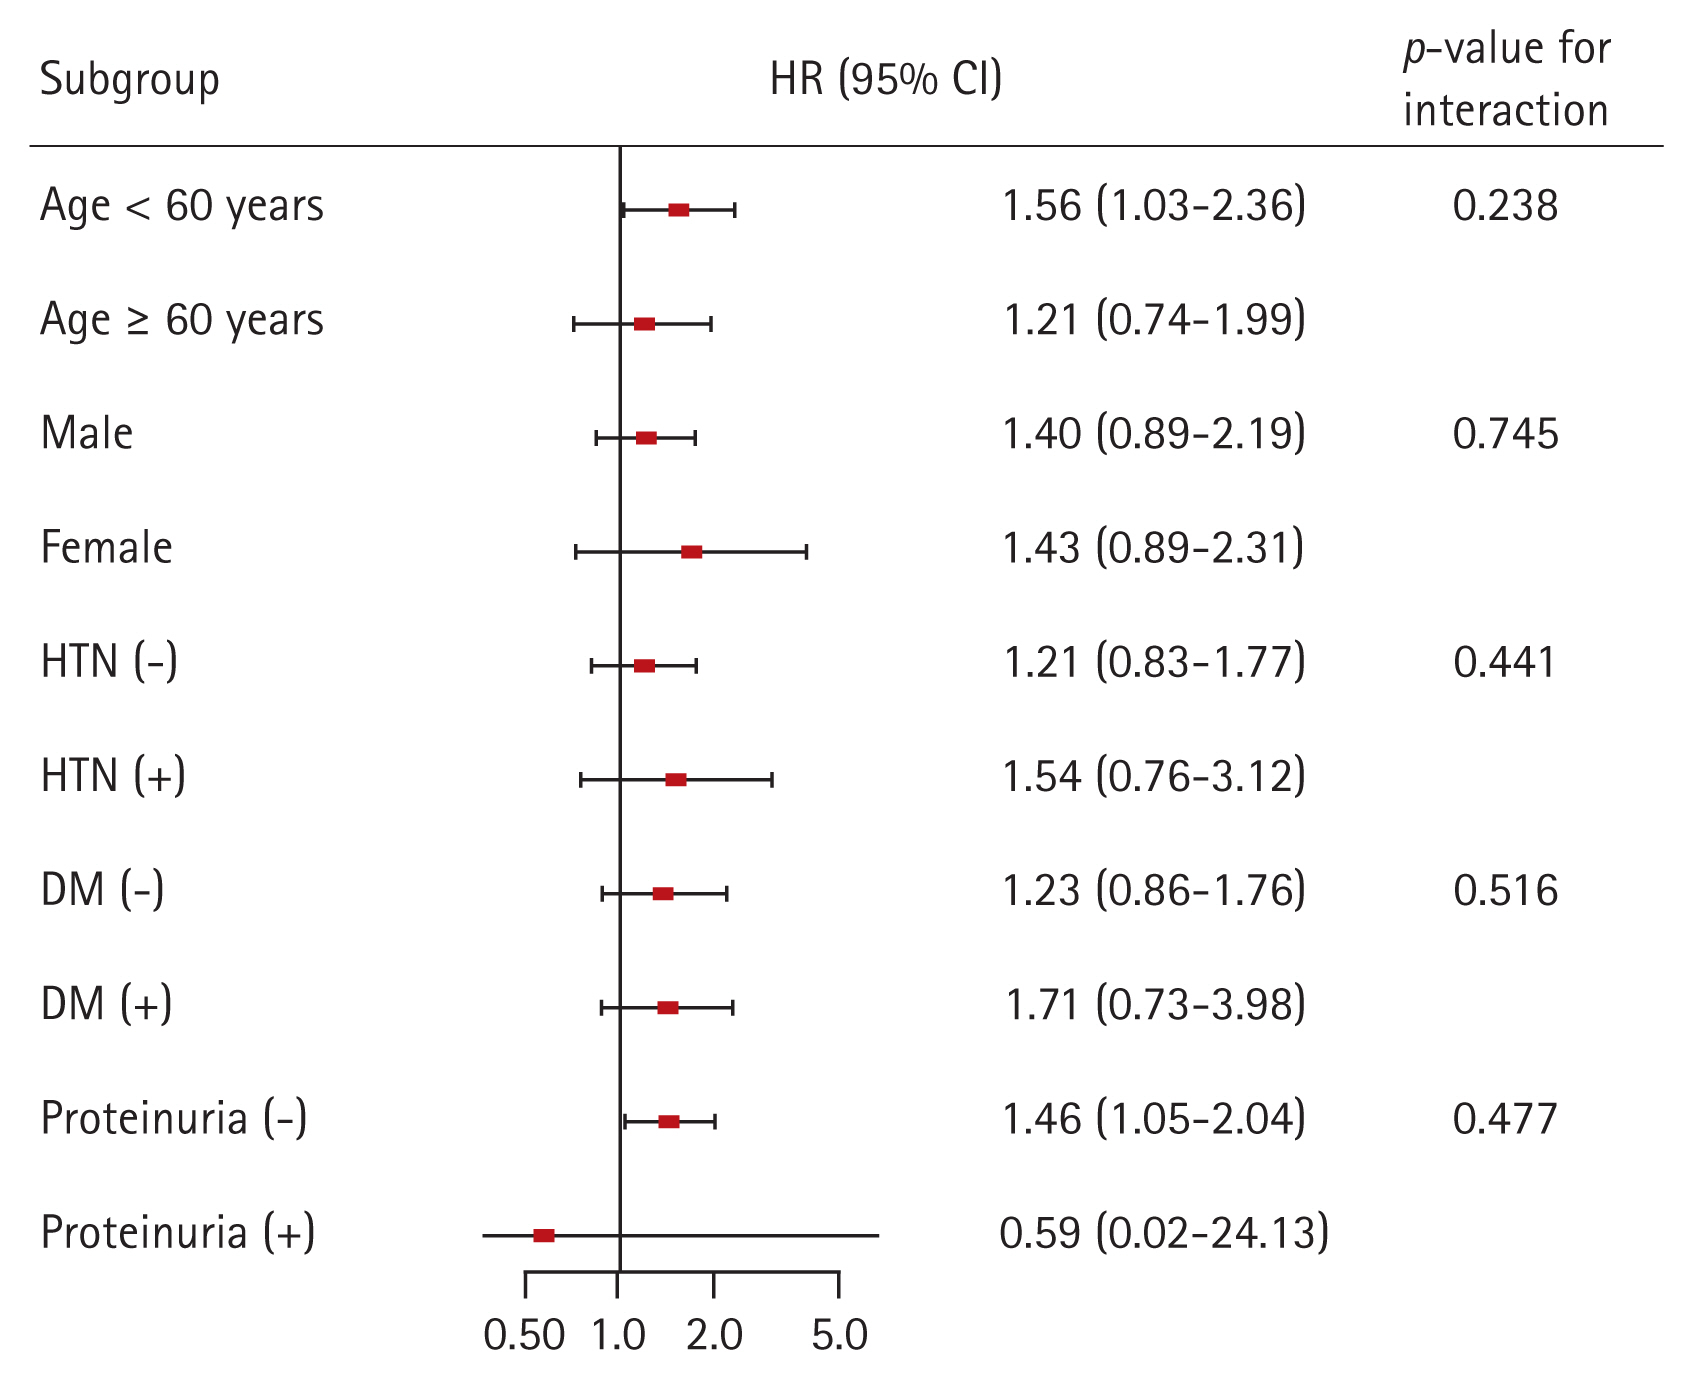
Finally, we conducted subgroup analyses to evaluate whether the association between obesity and the risk for incident CKD is modified by some factors (Fig. 6). We classified the degree of obesity according to the individualŌĆÖs WHR. The subgroups were stratified by age (< 60 or Ōēź 60 yr), sex, HTN, DM, and proteinuria. Multivariable Cox regression analysis revealed that p for interaction was > 0.05 for all subgroups, suggesting that the association of obesity with increased risk for incident CKD is not modified by these factors.
An additional subgroup analysis was performed to examine whether the effect of obesity reduction on the risk for incident CKD is modified by some factors (Supplementary Fig. 1). In the multivariable Cox regression analysis, p for interaction was > 0.05 for all subgroups, suggesting that the association of obesity reduction with decreased risk for incident CKD is not modified by these factors.
DISCUSSION
In this study, we found that obesity has an effect on CKD development in a population with normal renal function. Higher BMI and WHR significantly increased the risk for incident CKD in the multivariable analyses. Moreover, reducing obesity was beneficial for renal prognosis. These findings suggest that maintaining an appropriate weight is important for preserving renal function in a population with normal renal function. In addition, longitudinal changes in the metabolic profile showed that the obesity group had consistently poor metabolic profile. Moreover, our subgroup analyses suggest that obesity had an effect on development of CKD regardless of age, sex, HTN, and DM. This result reinforces the importance of obesity management in the general population.
Previous large surveys in a multiracial population documented that high BMI is strongly associated with the risk for CKD [8]. Another study showed that high BMI was a risk factor for CKD in Japanese men, but not in Japanese women [16]. Although BMI is the most useful index for obesity, it cannot distinguish between weight from muscle and fat, and between central and peripheral obesity. A previous study showed that WHR was more independently predictive of coronary heart disease than waist circumference or BMI in a general population cohort [17]. Elsayed et al. demonstrated that WHR but not BMI was a risk factor for incident CKD [18]. In the current study, both BMI and WHR were independent risk factors for incident CKD, but the magnitude of the effect of WHR was higher than that of BMI. BMI only provides body mass volume based on height, whereas WHR provides information about body shape and fat distribution, such as central obesity, which is the true meaning of obesity.
This study also showed that renal prognosis was better in individuals with reduced than in those with maintained obesity. Obesity is a well-known risk factor for cardiovascular disease, DM, stroke, and all-cause mortality [5,6,19,20]. HTN and DM are established risk factors for CKD, and a recent study showed that dyslipidemia is independently associated with incident CKD in the general population [21,22]. Obesity would affect renal function by causing these diseases. However, as mentioned in the studies above, obesity itself is a risk factor for CKD. The current study also revealed that obesity was independently associated with incident CKD after adjustment for HTN, DM, and LDL cholesterol. The mechanisms by which obesity directly affects renal function are unclear. One possible explanation is glomerular hyperfiltration/HTN. Bosma et al. [23] revealed that as BMI increases, effective renal plasma flow decreases and filtration fraction (the ratio of GFR and effective renal plasma flow) increases. The only way to explain GFR maintenance despite decreased renal plasma flow is glomerular hyperfiltration. Animal data also showed that obesity was associated with increased arterial pressure, glomerular hyperfiltration, and structural kidney damage, such as increased mesangial matrix and thickening of the glomerular and tubular basement membranes [24,25]. In fact, adipocytes produce a variety of factors that may affect renal microcirculation, such as angiotensinogen, leptin, and asymmetric dimethyl arginine, which is the most important endogenous inhibitor of nitric oxide synthase [9]. Adipocyte secretory products also directly stimulate aldosterone secretion that may be responsible for obesity-related HTN [26,27]. A previous study showed that weight reduction decreases plasma renin activity and aldosterone levels, and improves high blood pressure [28]. Although it has not yet been investigated whether these mechanisms observed in experiments also apply to healthy human, efforts to improve obesity, a modifiable factor, would be valuable for protecting renal function.
This study has several limitations. First, a causal relationship between obesity and CKD development could not fully be established due to the observational study design. Second, in the evaluation of the effect of obesity reduction, the sample size was small because only the obesity group at baseline was included. Further studies with larger sample sizes are needed.
However, our study also has certain strengths. Namely, both BMI and WHR were used to measure obesity and their influence on CKD development was compared. In addition, to assess the significance of obesity reduction, we categorized obesity reduction using the baseline and 4-year WHR. With these strengths, this study demonstrated that obesity, particularly the group with high WHR, was an independent risk factor for CKD development, suggesting that reducing obesity is beneficial for renal prognosis.
In conclusion, High BMI and high WHR were associated with incident CKD. Efforts to reduce fat tissue and obesity, such as weight loss, exercise, and diet control, can protect renal function in the healthy population.
KEY MESSAGES
1. Higher BMI and WHR significantly increased the risk for incident CKD, and the magnitude of the effect of WHR was higher than that of BMI.
2. Renal prognosis was better in individuals with reduced obesity than in those with maintained obesity.
3. Obesity has an effect on CKD development in a population with normal renal function, and this finding suggest that maintaining an appropriate weight is important for preserving renal function.
 PDF Links
 PubReader
 ePub Link
 Full text via DOI
 Download Citation
 Supplement figure 1
 Print
Print


