 |
 |
|
|
|
Abstract
Background/Aims
Methods
Results
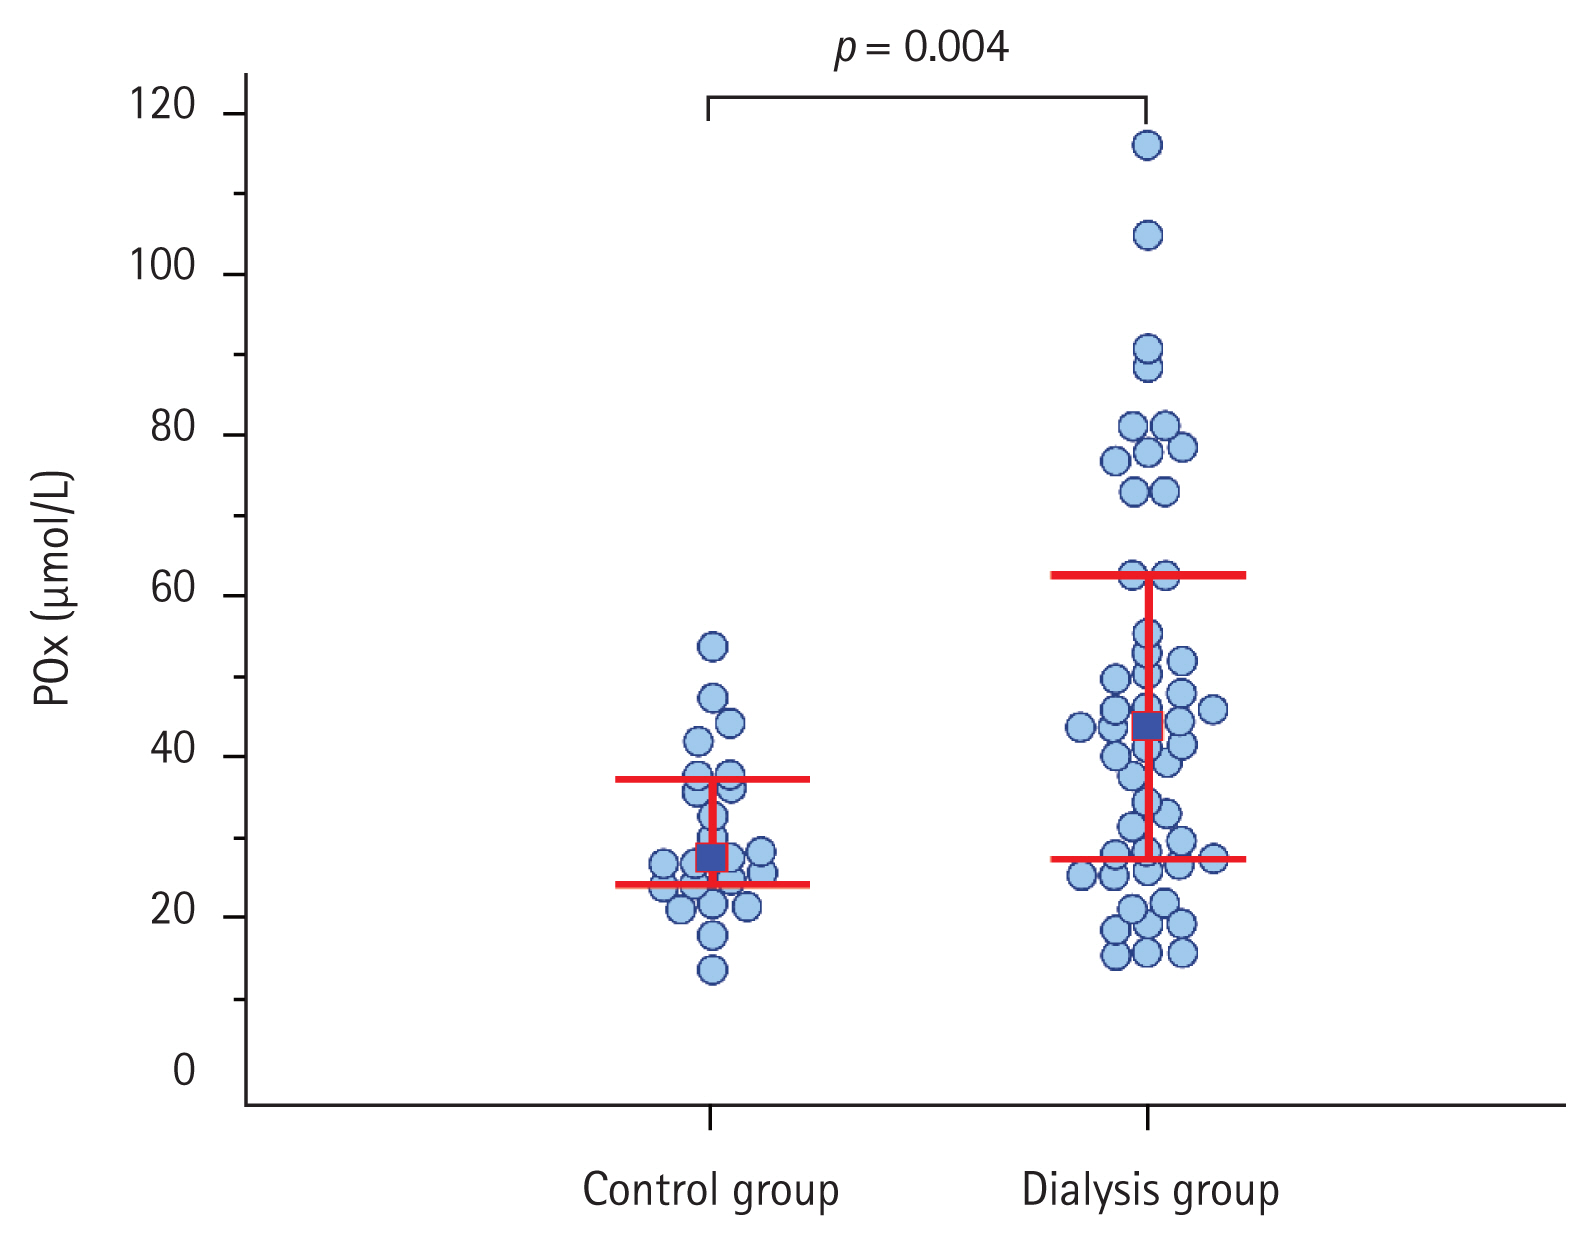
Figure┬Ā1

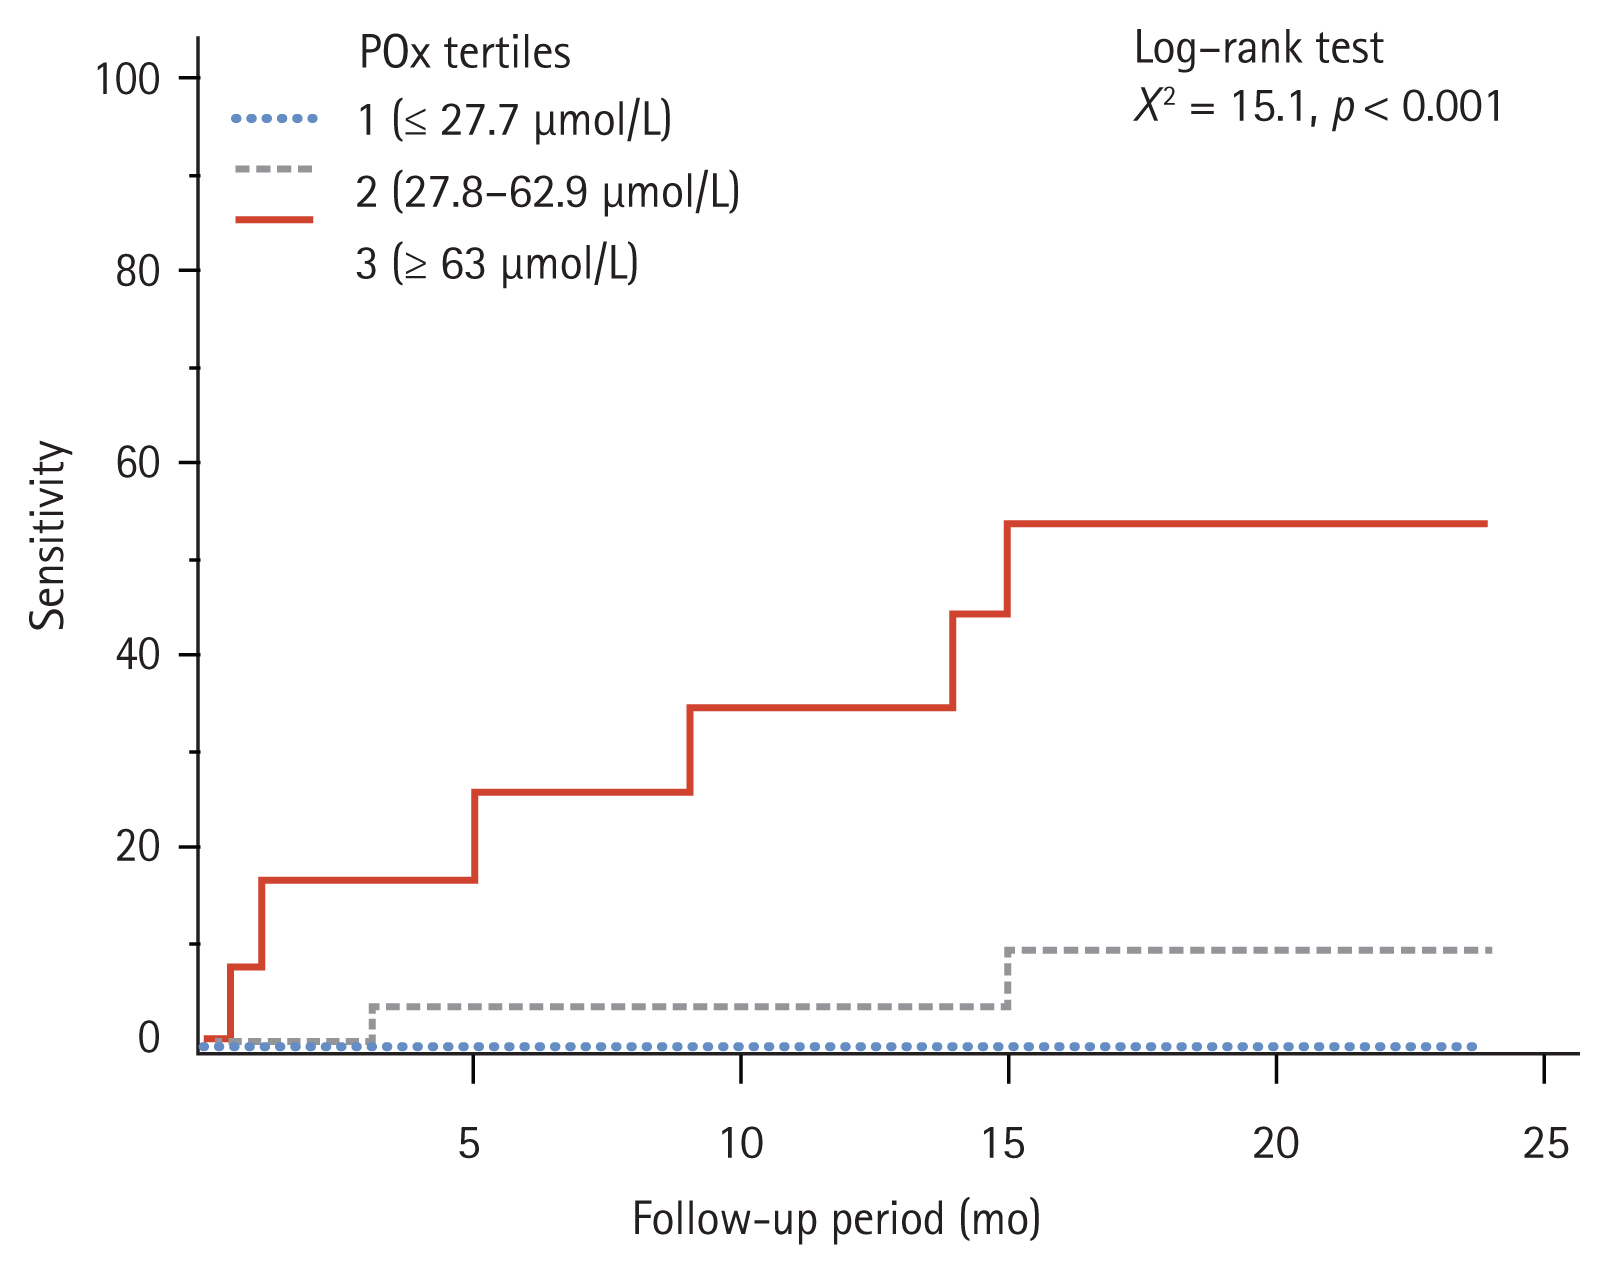
Figure┬Ā2

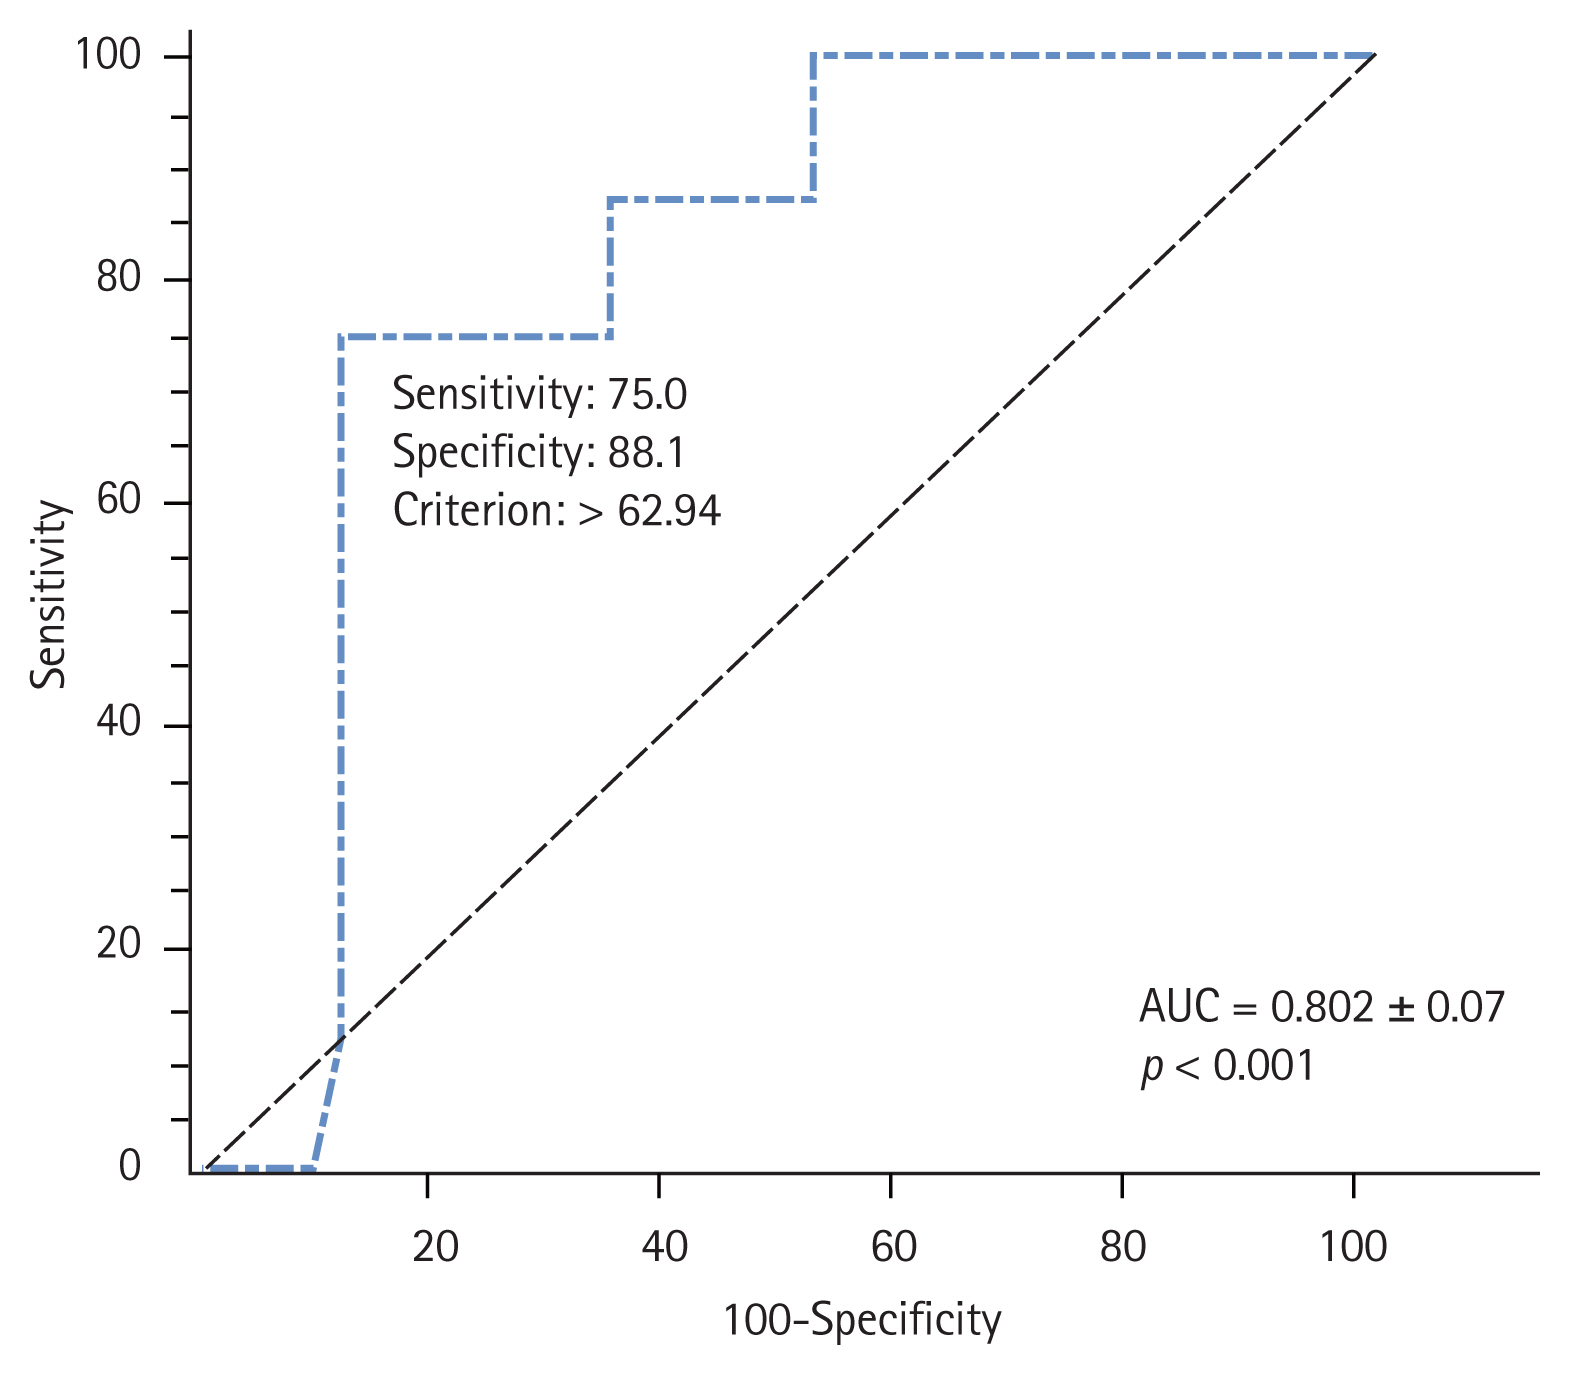
Figure┬Ā3

Table┬Ā1
Values are presented as number (%), mean ┬▒ standard deviation, or median (interquartile range). The values are compared between the groups using the chi-square tests, the StudentŌĆÖs t test and the Mann-Whitney U test as appropriate.
ESRD, end-stage renal disease; RRF, renal residual function; iPTH, intact parathyroid hormone; LDL-C, low-density lipoprotein cholesterol; VLDL-C, very-low-density lipoprotein cholesterol; HDL-C, high-density lipoprotein cholesterol; AIP, atherogenic index of plasma; CRP, C-reactive protein; TNF-╬▒, tumor necrosis factor-alpha; MCP-1, monocyte chemoattractant protein-1.
Table┬Ā2
| Variable | POx concentration in the ESRD patients | p value | ||
|---|---|---|---|---|
| Tertile 1 (Ōēż 27.7 ╬╝mol/L) (n = 13) | Tertile 2 (27.8ŌĆō62.9 ╬╝mol/L) (n = 25) | Tertile 3 (Ōēź 63 ╬╝mol/L) (n = 12) | ||
| Lipid profile parameters | ||||
| ŌĆāTotal cholesterol, mmol/L | 5.2 (4.2ŌĆō5.7) | 5.07 (4.4ŌĆō5.5) | 6.6 (5.9ŌĆō6.9) | 0.052 |
| ŌĆāTriglycerides, mmol/L | 1.28 (0.87ŌĆō2.02)c | 1.42 (1.08ŌĆō1.84)c | 2.8 (1.9ŌĆō3.1)a,b | 0.002 |
| ŌĆāLDL-C, mmol/L | 3.1 (1.7ŌĆō3.8) | 2.7 (2.2ŌĆō3.3) | 3.5 (2.4ŌĆō3.7) | 0.196 |
| ŌĆāVLDL-C, mmol/L | 0.51 (0.35ŌĆō0.69)c | 0.64 (0.43ŌĆō0.88)c | 0.94 (0.63ŌĆō1.2)a,b | 0.022 |
| ŌĆāHDL-C, mmol/L | 1.44 (1.12ŌĆō1.66)c | 1.31 (1.2ŌĆō1.61)c | 1.01 (0.97ŌĆō1.14)a,b | 0.007 |
| ŌĆāAIP | 2.9 (2.1ŌĆō3.3)c | 3.1 (2.2ŌĆō4.0)c | 4.1 (3.7ŌĆō4.4)a,b | 0.026 |
| Pro-inflammatory markers | ||||
| ŌĆāCRP, mg/L | 7.6 (4.1ŌĆō11.4) | 11.6 (4.8ŌĆō15.1) | 11.7 (8.4ŌĆō14.9) | 0.355 |
| ŌĆāInterleukin 6, pg/mL | 1.1 (0ŌĆō5.8)c | 1.9 (0.5ŌĆō4.7)c | 15.9 (8.8ŌĆō21.1)a,b | 0.006 |
| ŌĆāTNF-╬▒, pg/mL | 2.1 (1.1ŌĆō4.3)b | 0.16 (0ŌĆō0.8)a,c | 1.8 (0.5ŌĆō2.8)b | < 0.001 |
| ŌĆāMCP-1, pg/mL | 254 (219.6ŌĆō300)b,c | 331.2 (289.5ŌĆō361.5)a,c | 402 (300ŌĆō503.8)a,b | 0.001 |
Values are presented as median (interquartile range) and compared between the groups using the Kruskal-Wallis test.
POx, plasma oxalic acid; ESRD, end-stage renal disease; LDL-C, low-density lipoprotein cholesterol; VLDL-C, very-low-density lipoprotein cholesterol; HDL-C, high-density lipoprotein cholesterol; AIP, atherogenic index of plasma; CRP, C-reactive protein; TNF-╬▒, tumor necrosis factor-alpha; MCP-1, monocyte chemoattractant protein-1.
Table┬Ā3
Model 1 was adjusted for age, sex, and dialysis modality; Model 2 was additionally adjusted for cardiovascular disease risk factors, including diabetic status, systolic blood pressure, body mass index, serum uric acid, and variables that were statistically significant in the univariate analysis (hemoglobin, triglycerides, interleukin-6).


 PDF Links
 PubReader
 ePub Link
 Full text via DOI
 Download Citation
 Supplement 1
 Print
Print


