


INTRODUCTION
Accumulation of adipose tissue, especially in the visceral cavity, plays an essential role in the development of several cardiovascular diseases (CVDs), including metabolic syndrome, hypertension [1], dyslipidemia, insulin resistance, as well as type 2 diabetes [2,3]. Specifically, visceral fat tissue is recognized as an independent risk factor for cardiovascular complications [4]. The amount of visceral fat has been reported to be associated with inflammatory-mediated cytokines such as plasminogen activator inhibitor-1, tumor necrosis factor-α, and interleukin-6 [5]. Moreover, visceral fat increases due to stimulated lipid uptake and esterification in visceral fat during the aging process [6].
Given its clinical significance, research has been directed towards quantifying fat amounts in various areas. Epicardial adipose tissue (EAT), a deposit of visceral fat located between the heart and the pericardium, is primarily composed of white adipose tissue with small amounts of brown adipose tissue [7]. EAT plays a multifaceted role for the heart, including providing mechanical protection for the coronary artery [8,9], contributing to myocardium energy through a high metabolism rate of free fatty acid [10], and performing thermogenic functions [11]. Additionally, EAT produces active biomarkers [12] that can influence heart morphology and function, and also releases micro-ribonucleic acids to the vascular wall, exerting paracrine effects [7].
Due to its proximity to the cardiovascular system, EAT might more be susceptible to pronounced inflammatory responses compared to typical visceral fats. Adipokines released from EAT can locally affect inflammation in the nearby coronary vessel wall and stimulate atherosclerosis progression through outside-to-inside signaling [13,14]. Furthermore, EAT has also been reported to be associated with coronary atherosclerosis and subclinical coronary artery disease [15-17]. Although research has suggested EAT’s involvement in metabolic risk factors and coronary calcification [18-20], the precise contribution of epicardial fat to CVD remains uncertain. Some studies demonstrated that anti-atherosclerotic cytokines, such as adiponectin, secreted from EAT promote cardioprotection [21,22]. Additionally, other studies highlight that pericardial fat, not EAT, is strongly associated with cardiometabolic risk and coronary atherosclerosis [23,24].
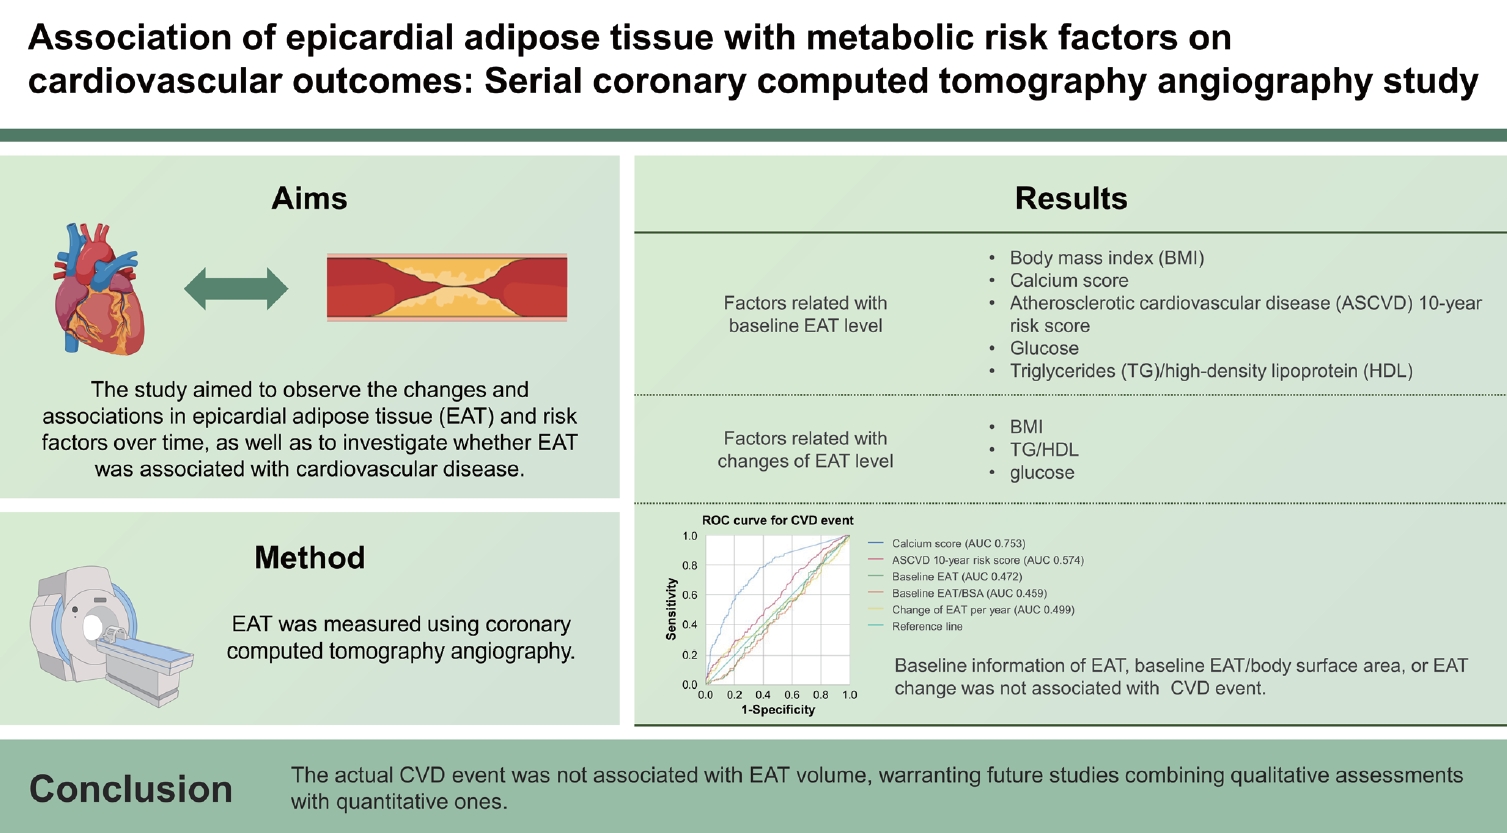
Coronary computed tomography angiography (CCTA) is a sensitive imaging modality that allows the accurate measurement of EAT volume with high spatial resolution [25]. However, many investigations focus solely on the cross-sectional view of EAT rather than the longitudinal changes, which can be measured using CCTA. Thus, our study aims to investigate EAT volume and its serial changes, in conjunction with other conventional risk factors, to determine its association with CVD events.
METHODS
Study population
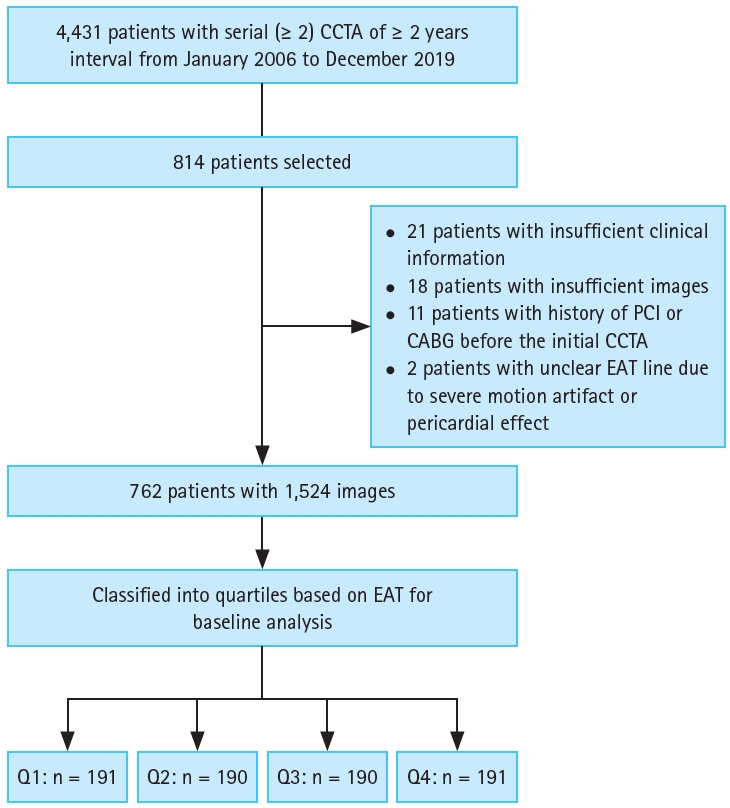
The analysis included participants who had undergone CCTA at least twice, with intervals of 2 years or more, between January 2006 and December 2019 at Seoul National University Hospital (SNUH) and SNUH Gangnam Center. During this period, a total of 4,431 participants were extracted from the SNUH Patients Research Environment, which serves as a clinical data warehouse. Of the total participants, 814 individuals with analyzable images were selected for further analysis, while 52 were excluded for the following reasons: inadequate clinical information (n = 21), insufficient image quality (n = 18), history of percutaneous coronary intervention (PCI) or coronary artery bypass grafting (CABG) (n = 11), and indistinct EAT delineation due to severe motion artifacts or pericardial effects (n = 2). Ultimately, a total of 762 participants were included in the study (Fig. 1).
CCTA scan protocol and evaluation
Baseline and follow-up CCTA images were retrieved from the Picture Archiving and Communication System of SNUH, stored in the Digital Imaging and Communications in Medicine format. These images were then downloaded and transferred to the Department of Radiology at Seoul National University Bundang Hospital, which served as the core lab for EAT volume measurements. Additionally, CCTA images were separately analyzed by two experienced radiology researchers using a dedicated workstation (SyngoVia; Siemens Healthcare, Erlangen, Germany). If discrepancies exceeding 10% of EAT volume were detected, a third measurement was performed. The analysis was conducted independently, without interference from the other researchers involved. All CCTA images were measured at the same cardiac cycle to ensure consistency, as the volume of EAT could vary between systolic and diastolic periods. Experienced researchers manually marked an epicardial line on CCTA images, setting thresholds at -190 Hounsfield unit (HU; lower) and -30 HU (upper). This marking was conducted on axial scans of 0.9 mm thickness, spanning carina to heart base. Moreover, EAT measurements, highlighted in purple, were semi-automated. Researchers checked and adjusted the outlined area for accuracy. Cases with unclear EAT lines caused by severe motion artifacts or pronounced pericardial effects (pericardial effusion exceeding 10 mm) were excluded. Additionally, images with insufficient scan range -starting below the carina level or not reaching the heart base-were also excluded, as they could impact EAT volume measurements. The EAT volume was computed by summing EAT measurements from each scanned image, as determined through the aforementioned methodology. To counter the influence of height and weight variations, EAT was normalized by dividing it by the body surface area (BSA) for further analysis. The annual EAT change was computed as (follow-up EAT - baseline EAT) / baseline EAT × 100 / year. For participants who underwent CCTA imaging more than three times within the study period, the initial and final CCTA images were chosen for analysis. A written signed informed consent was obtained from each patient and the research was carried out with approval from Institutional Review Board of SNUH (IRB no H-2022-174-1107).
Clinical data acquisition
Clinical data collection for these participants was manually secured through Electronic Medical Records (EMR). Utilizing EMR at SNUH, various clinical details were gathered, including information from CCTA and laboratory data such as complete blood count (CBC) and medication history. This comprehensive data compilation was aimed at assessing each participant’s cardiovascular risk. Additional medical records were collected, encompassing sex, age, body mass index (BMI), BSA, systolic blood pressure, diastolic blood pressure, pulse rate, and lifestyle information such as smoking and drinking histories. Medical conditions, including diagnosed hypertension and diabetes, were also included. Moreover, participants’ cardiovascular family histories, comprising coronary artery disease, angina, and stroke, were gathered. Cases of hypertension and diabetes were restricted to those diagnosed or under medication while also excluding individuals with a family history of hypertension and diabetes. Smoking history was categorized as never smoked, ex-smoker, or current smoker while drinking history was classified as none, social drinker, or heavy drinker. Measurements for CBC, glycated hemoglobin (HbA1c), total cholesterol, triglyceride (TG), high-density lipoprotein (HDL), and low-density lipoprotein (LDL) were obtained. Data points obtained within a month prior to the timing of the two CCTA scans were chosen. In instances where this data was not available, the previous data was employed using the principle of last observation carried forward. In cases where no data was present, those instances were treated as missing values.
Lastly, a review was conducted to determine whether coronary artery disease had manifested during the follow-up period. CVD events and new cases of coronary artery disease were identified based on the presence of 50% stenosis in the CCTA findings at the follow-up assessment or if coronary artery lesions exhibited progression during the follow-up period and necessitated either PCI or CABG.
Statistical analysis
Data are presented as mean ± standard deviation, or a number with percentages, or as an odds ratio (OR) with a 95% confidence interval (CI). The Agatston score for calcium was categorized as follows: 0 HU, 0.1–100 HU, 100.1–400 HU, and > 400 HU [26]. The atherosclerotic cardiovascular disease (ASCVD) 10-year risk score percentages were classified into the following categories: 0–5%, 5–7.5%, 7.5–20%, and > 20% [27].
To analyze the relationship between EAT (divided into quartiles) and risk factors, t-tests and Mann–Whitney U-tests were employed. The association between changes in EAT and risk factors over time was examined using simple regression models, receiver operating characteristic curve (ROC) curve analysis, and Pearson’s chi-square test. Statistical significance was determined as p < 0.05. All analyses were performed using the SPSS software package (version 26.0; IBM Corp., Armonk, NY, USA).
RESULTS
Baseline analysis
A total of 762 participants (age 58.7 ± 6.6 yr, 91.5% males) were included (Table 1). The interval duration between the two computed tomography (CT) scans was 2,237 ± 984 days. Participants were grouped into quartiles according to the baseline EAT volume, < 84.00 mL, 84.00–107.77 mL, 107.77–135.39 mL, and > 135.39 mL, respectively. Approximately, 42.7% of the participants were obese with a BMI of 24.5 ± 2.6 kg/m2, and the prevalence of hypertension and diabetes mellitus was 42.3% (p < 0.001) and 17.8% (p = 0.033), respectively. A significant difference was observed between Q1 and Q4 for hypertension (28.8% vs. 51.8%, respectively) and diabetes (11.5% vs. 19.9%, respectively). Height, weight, and BMI exhibited a positive association with EAT volume at baseline. The association between smoking and EAT displayed no significance (p = 0.302), while for alcohol consumption (p = 0.012), heavy drinkers were prevalent in Q4.
Classical risk indicators, such as coronary calcium score (p = 0.013) and the ASCVD 10-year risk score, exhibited a significant correlation with EAT. From laboratory results, HbA1c, glucose, TGs, HDL, and TG/HDL were associated with EAT (all p < 0.001), while total cholesterol (p = 0.294) and LDL (p = 0.569) were not. Among these, except for HDL, which demonstrated a negative association, HbA1c, glucose, and TGs, TG/HDL exhibited a positive association with EAT volume.
EAT characteristics at baseline and follow-up
At baseline, the average EAT was 113.1 ± 39.2 mL, with EAT/BSA at 62.1 ± 19.7 mL/m2 (Table 2). During follow-up, both EAT and EAT/BSA increased to 124.6 ± 44.9 mL and 68.6 ± 22.5 mL/m2, respectively. Weight and BMI displayed no significant change between the baseline and follow-up measurement (weight: from 70.1 ± 9.3 kg to 69.8 ± 9.5 kg; BMI: from 24.5 ± 2.6 kg/m2 to 24.5 ± 2.5 kg/m2). Unlike weight, BMI, and BSA remained relatively unchanged (BSA: from 1.8 ± 0.2 m2 to 1.8 ± 0.1 m2). Furthermore, all groups exhibited an increased mean EAT and EAT/BSA at follow-up. Significant differences in BSA were observed among each quartile at both baseline and follow-up, except for between Q2 and Q3 in both instances.
Groups with initially low EAT levels exhibited a pronounced yearly increase in EAT. Specifically, Q1 demonstrated a change of 2.7 ± 4.5% per year, while Q4 displayed a change of 1.3 ± 2.9% per year. Upon comparison among the groups, statistically significant differences were observed solely in EAT changes between Q1 and Q3/4. The p-value for the comparison between Q1 and Q3 was 0.012, and between Q1 and Q4, the value was 0.003.
Association between the changes in EAT and risk factors over time
The participant population was divided according to the EAT change per year; +5%/yr and -5%/yr were selected arbitrarily as criteria for clinical and statistical importance. Clinical characteristics of participants according to EAT change per year were compared (Table 3). EAT increased in parallel with BMI, TG/HDL, and glucose over time (all p < 0.001). Other risk factors did not exhibit a significant difference. Moreover, BMI, TG/HDL, and glucose were considered significant risk factors, and LDL, calcium score, and ASCVD 10-year risk score were selected as comparative risk factors for simple regression analysis. The association and correlation coefficients (R2) between EAT change per year and BMI, TG/HDL, glucose, LDL, calcium score, and ASCVD 10-year risk score are illustrated by scatter plots (Fig. 2). Although BMI, TG/HDL, and glucose demonstrated significant association with EAT change, R2 of the single parameter was very low.
Association with CVD event
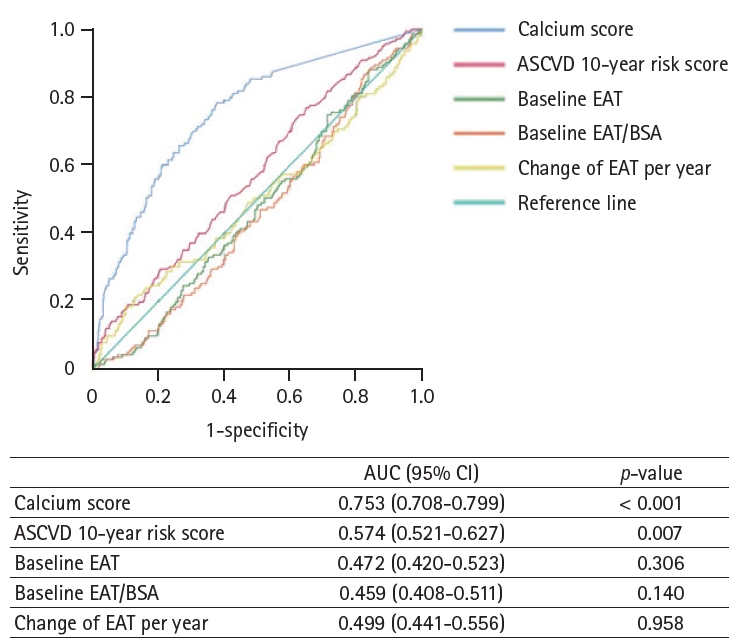
We analyzed the association between baseline EAT, follow-up EAT, EAT/BSA, and CVD events stratified by statin use. However, no statistically significant relationship was observed between changes in EAT and the occurrence of CVD events based on statin use (Table 4). To compare the risk-predicting power of EAT, the association between CVD event and calcium score, ASCVD 10-year risk score, baseline EAT, baseline EAT/BSA, and change of EAT per year was plotted as ROC curve (Fig. 3). Only the calcium score and ASCVD 10-year risk score demonstrated significant predictability (area under the curve: 0.753 vs. 0.574, p < 0.001 for calcium score and p = 0.007 for ASCVD 10-year risk score, respectively). Neither baseline EAT nor EAT change over time displayed any significant predictability of CVD events. According to the baseline characteristics, an increase in EAT quartile was associated with an increase in calcium score. Subsequently, we conducted multiple regression analyses based on the change in calcium score, confirming that HbA1c, weight, baseline TG, and age were independent predictors of calcium score change (β > 0, all p < 0.05) (Supplementary Table 1).
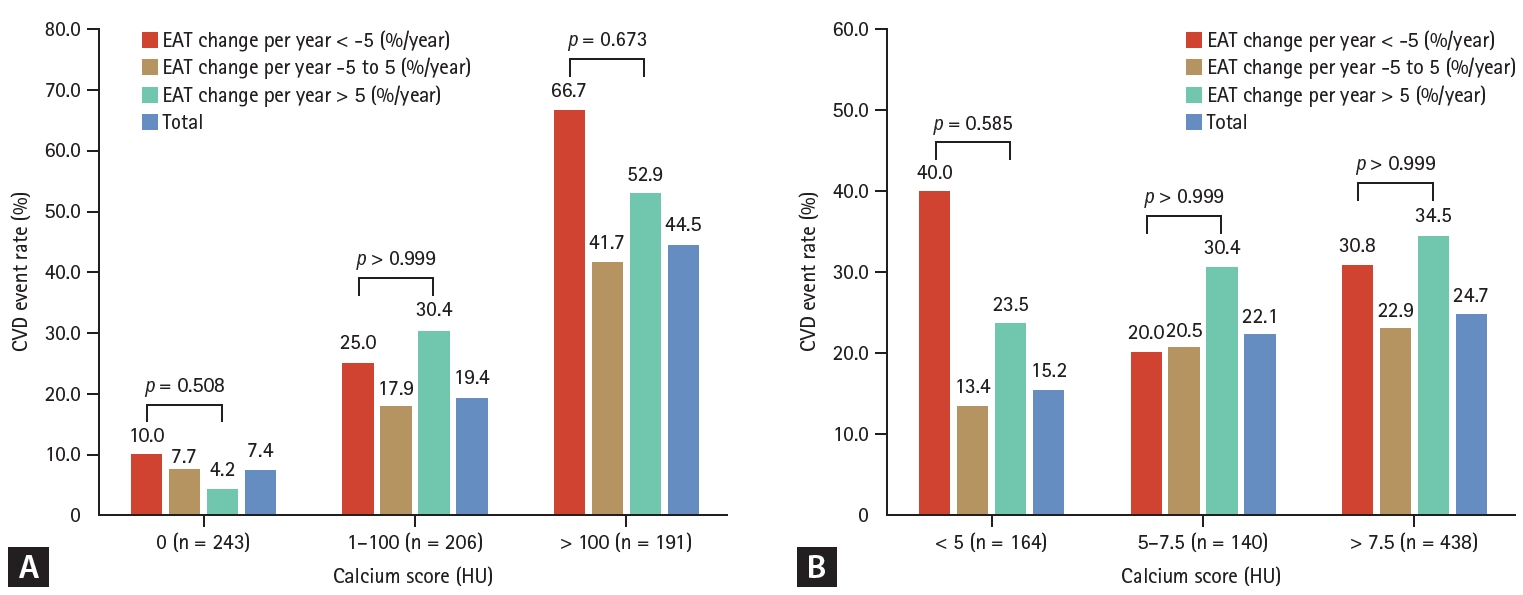
Lastly, to determine if adding EAT to an existing risk prediction engine has additional effects, the CVD event rate was re-analyzed by dividing the change of EAT into three groups according to calcium score and ASCVD 10-year risk score (Fig. 4). The re-analyzed group with the lowest calcium score displayed a p value of 0.508, followed by > 0.999 and 0.673 for the intermediate and highest groups, respectively. Similarly, for the ASCVD 10-year risk score, the lowest, intermediate, and highest re-analyzed groups had p values of 0.585, > 0.999, and > 0.999, respectively. In summary, no additive effect of EAT change per year on top of the conventional risk prediction markers was observed in any group.
DISCUSSION
The current investigation validated the precise measurement of EAT volume and its sequential changes through CCTA. Notably, the study demonstrated the association with other conventional clinical parameters. The key conclusion can be summarized as follows: 1) Individuals with unfavorable risk factors displayed a larger EAT volume in comparison to their counterparts. 2) Variations in BMI, TG/HDL ratio, and glucose levels were associated with annual changes in EAT. In contrast, no evident connection was observed between LDL levels, calcium score, ASCVD 10-year risk score, and the aforementioned changes. 3) No established link existed between CVD and parameters related to EAT, emphasizing the necessity for future research integrating in-depth assessments of EAT’s qualitative attributes. 4) The calcium score emerged as a predictive factor for CVD events, and HbA1c, weight, baseline TG, and age exhibited positive correlations with both EAT quartile and calcium score changes.
At baseline analysis, BMI, calcium score, and ASCVD 10-year risk score demonstrated a positive association with EAT volume. Among the laboratory results, HbA1c, glucose, TGs, and TG/HDL displayed a positive association with EAT volume, while HDL exhibited a negative association, and LDL displayed no correlation. Participants with unfavorable metabolic risk factors were classified into the high EAT quartiles. In this study, we conducted a detailed re-analysis. EAT was normalized by dividing it by BSA, thus minimizing variations related to height and weight. According to quartiles, EAT/BSA demonstrated a positive correlation with EAT volumes. In the follow-up phase, the patterns persisted, with those in the low EAT quartiles still displaying the lowest EAT levels. However, when assessing EAT change as a percentage per year relative to baseline, all groups exhibited positive mean changes. Remarkably, the groups with the highest EAT had the smallest increase. In EAT change analysis, risk factors like BMI, TG/HDL, and glucose decreased in groups exceeding 5% EAT loss but increased in those with over 5% EAT gain. Simple regression analysis confirmed these patterns. However, LDL, calcium score, and ASCVD 10-year risk score exhibited no such associations. Additionally, BMI, TG/HDL, and glucose emerged as meaningful indicators of EAT change, hinting at their role in reflecting the impact of insulin resistance on EAT volume. The lack of correlation with LDL suggests additional mechanisms influencing EAT changes. This influence emphasizes the connection between EAT and medical conditions such as diabetes, obesity, and elevated TG levels, suggesting an increased likelihood of metabolic syndrome. The potential role of EAT in predicting metabolic syndrome is noteworthy, especially in patients undergoing CCTA for health screening. Therefore, the measurement of EAT in CCTA could function as an additional benefit for evaluating the risk of developing the metabolic syndrome.
In this study, classical risk indicators, calcium score, and ASCVD 10-year risk score exhibited significant associations with CVD events, with the calcium score demonstrating the most notable link, followed by the ASCVD 10-year risk score. Notably, traits related to EAT, such as baseline EAT, baseline EAT/BSA, and annual EAT change, displayed no connection to CVD events. However, changes in calcium scores demonstrated positive correlations with HbA1c, weight, baseline TG, and age. Recognizing these factors as substantial contributors to CVD events, it can be inferred that conventional risk factors—HbA1c, weight, baseline TG, and age—play a more significant role in CVD through changes in calcium rather than EAT volume. Previous research indicated a link between visceral fat and obesity, underscoring its involvement in CVD and metabolic disorders like hypertension, abnormal lipid levels, insulin resistance, and type 2 diabetes [2]. Some studies link EAT to metabolic risk factors, CVD, and coronary calcification [18,19], but the exact association of EAT with CVD remains uncertain. In our study, the relationship between EAT change and CVD events underwent further examination by categorizing participants into three groups based on calcium score and ASCVD 10-year risk score. Within each group, participants were once more subdivided based on EAT change per year using criteria of ± 5% per year. However, none of the groups exhibited significant outcomes concerning CVD events, and the CVD ratio displayed no discernible trend when compared to EAT change. A recent study suggested no such correlation between perivascular adipose tissue and calcified plaque volume [28]. Other studies also reported that epicardial and pericardial fat lack association with coronary artery calcification [29,30]. Therefore, deep perspectives are needed to examine the relationship between the histologic quality and density of components as well as the natural course of EAT rather than the quantitative volume.
EAT measurement in many studies often uses CCTA, which is considered the standard method, but the recent focus is on EAT’s cross-sectional view due to ongoing controversies. The longitudinal perspective of EAT and its relation to CVD needs further exploration. This study examines EAT changes and risk factors over time, investigating their correlation and whether EAT directly links to CVD, contrasting with classical indicators like calcium score and ASCVD 10-year risk score.
This study had certain limitations. First, the fact that this study collected data from two centers in South Korea may render the analysis underpowered to demonstrate a significant association between EAT and CVD, posing a risk of type 2 error. For a total of 762 participants, the power of three EAT-related variables for predicting CVD, baseline EAT, baseline EAT/BSA, and change of EAT per year were 0.05, 0.13, and 0.18, respectively. Had the retrospective study included data from multiple centers and a large population, along with high-quality data, the study might have yielded more meaningful results.
Although the results should be interpreted with caution, it is worth noting that our study had the largest sample size among research conducted with a paired set. Second, the participants of this study do not represent the general population. The majority of the individuals who visited SNUH or SNUH Gangnam Center for examinations resided mostly in the urban area. Additionally, the fact that over 90% of the participants were male could introduce some limitations in the interpretation despite the lack of statistical significance. Third, the criteria of -5% and 5%/year for a change of EAT were defined arbitrarily in this study for analysis. Considering the distribution of participants, it was determined that only those with more than 5% change had clinically significant changes. The participants who demonstrated less than 5% of EAT change were few, which might have led to statistically insignificant results. Fourth, when the population was grouped according to calcium score and ASCVD 10- year risk score, the number of people was not divided by tertile or quartile but based on clinical cutoff criteria. Due to a shortage of participants in the greatest criterion, (> 400 HU and > 20%), they were combined with the following group: 100–400 HU and 7.5–20%. Lastly, as a retrospective study, the intervals between baseline and follow-up examination varied among participants. Moreover, obtaining accurate statistical data on variables like BMI, TG/HDL, LDL, calcium score, etc., at fixed time intervals poses a significant challenge. The prolonged time gap between the two CT scans, coupled with limited time-based adjustments, necessitated the consideration of aging, even when focusing on patients for health screenings.
In conclusion, some metabolic risks, e.g., BMI, TG/HDL, and glucose, were associated with volume and EAT change per year. However, classical CVD risks, e.g., LDL, calcium score, ASCVD 10-year risk score, did not demonstrate an association. The actual CVD event was not associated with EAT volume, warranting future studies combining qualitative assessments with quantitative ones. As some risk factors such as TG/HDL and glucose related to insulin resistance were associated with EAT, future studies with extended observation periods focused on insulin resistance are needed.
KEY MESSAGE
1. Participants with worse risk factors demonstrated more volume of EAT than others.
2. BMI, TG/HDL, and glucose were associated with the change of EAT per year, compared to LDL, calcium score, and ASCVD 10-year risk score, which were not.
3. CVD was not associated with factors related to EAT, warranting future studies with qualitative assessments of EAT.

 PDF Links
 PubReader
 ePub Link
 Full text via DOI
 Download Citation
 Supplement table 1
 Print
Print


