


INTRODUCTION
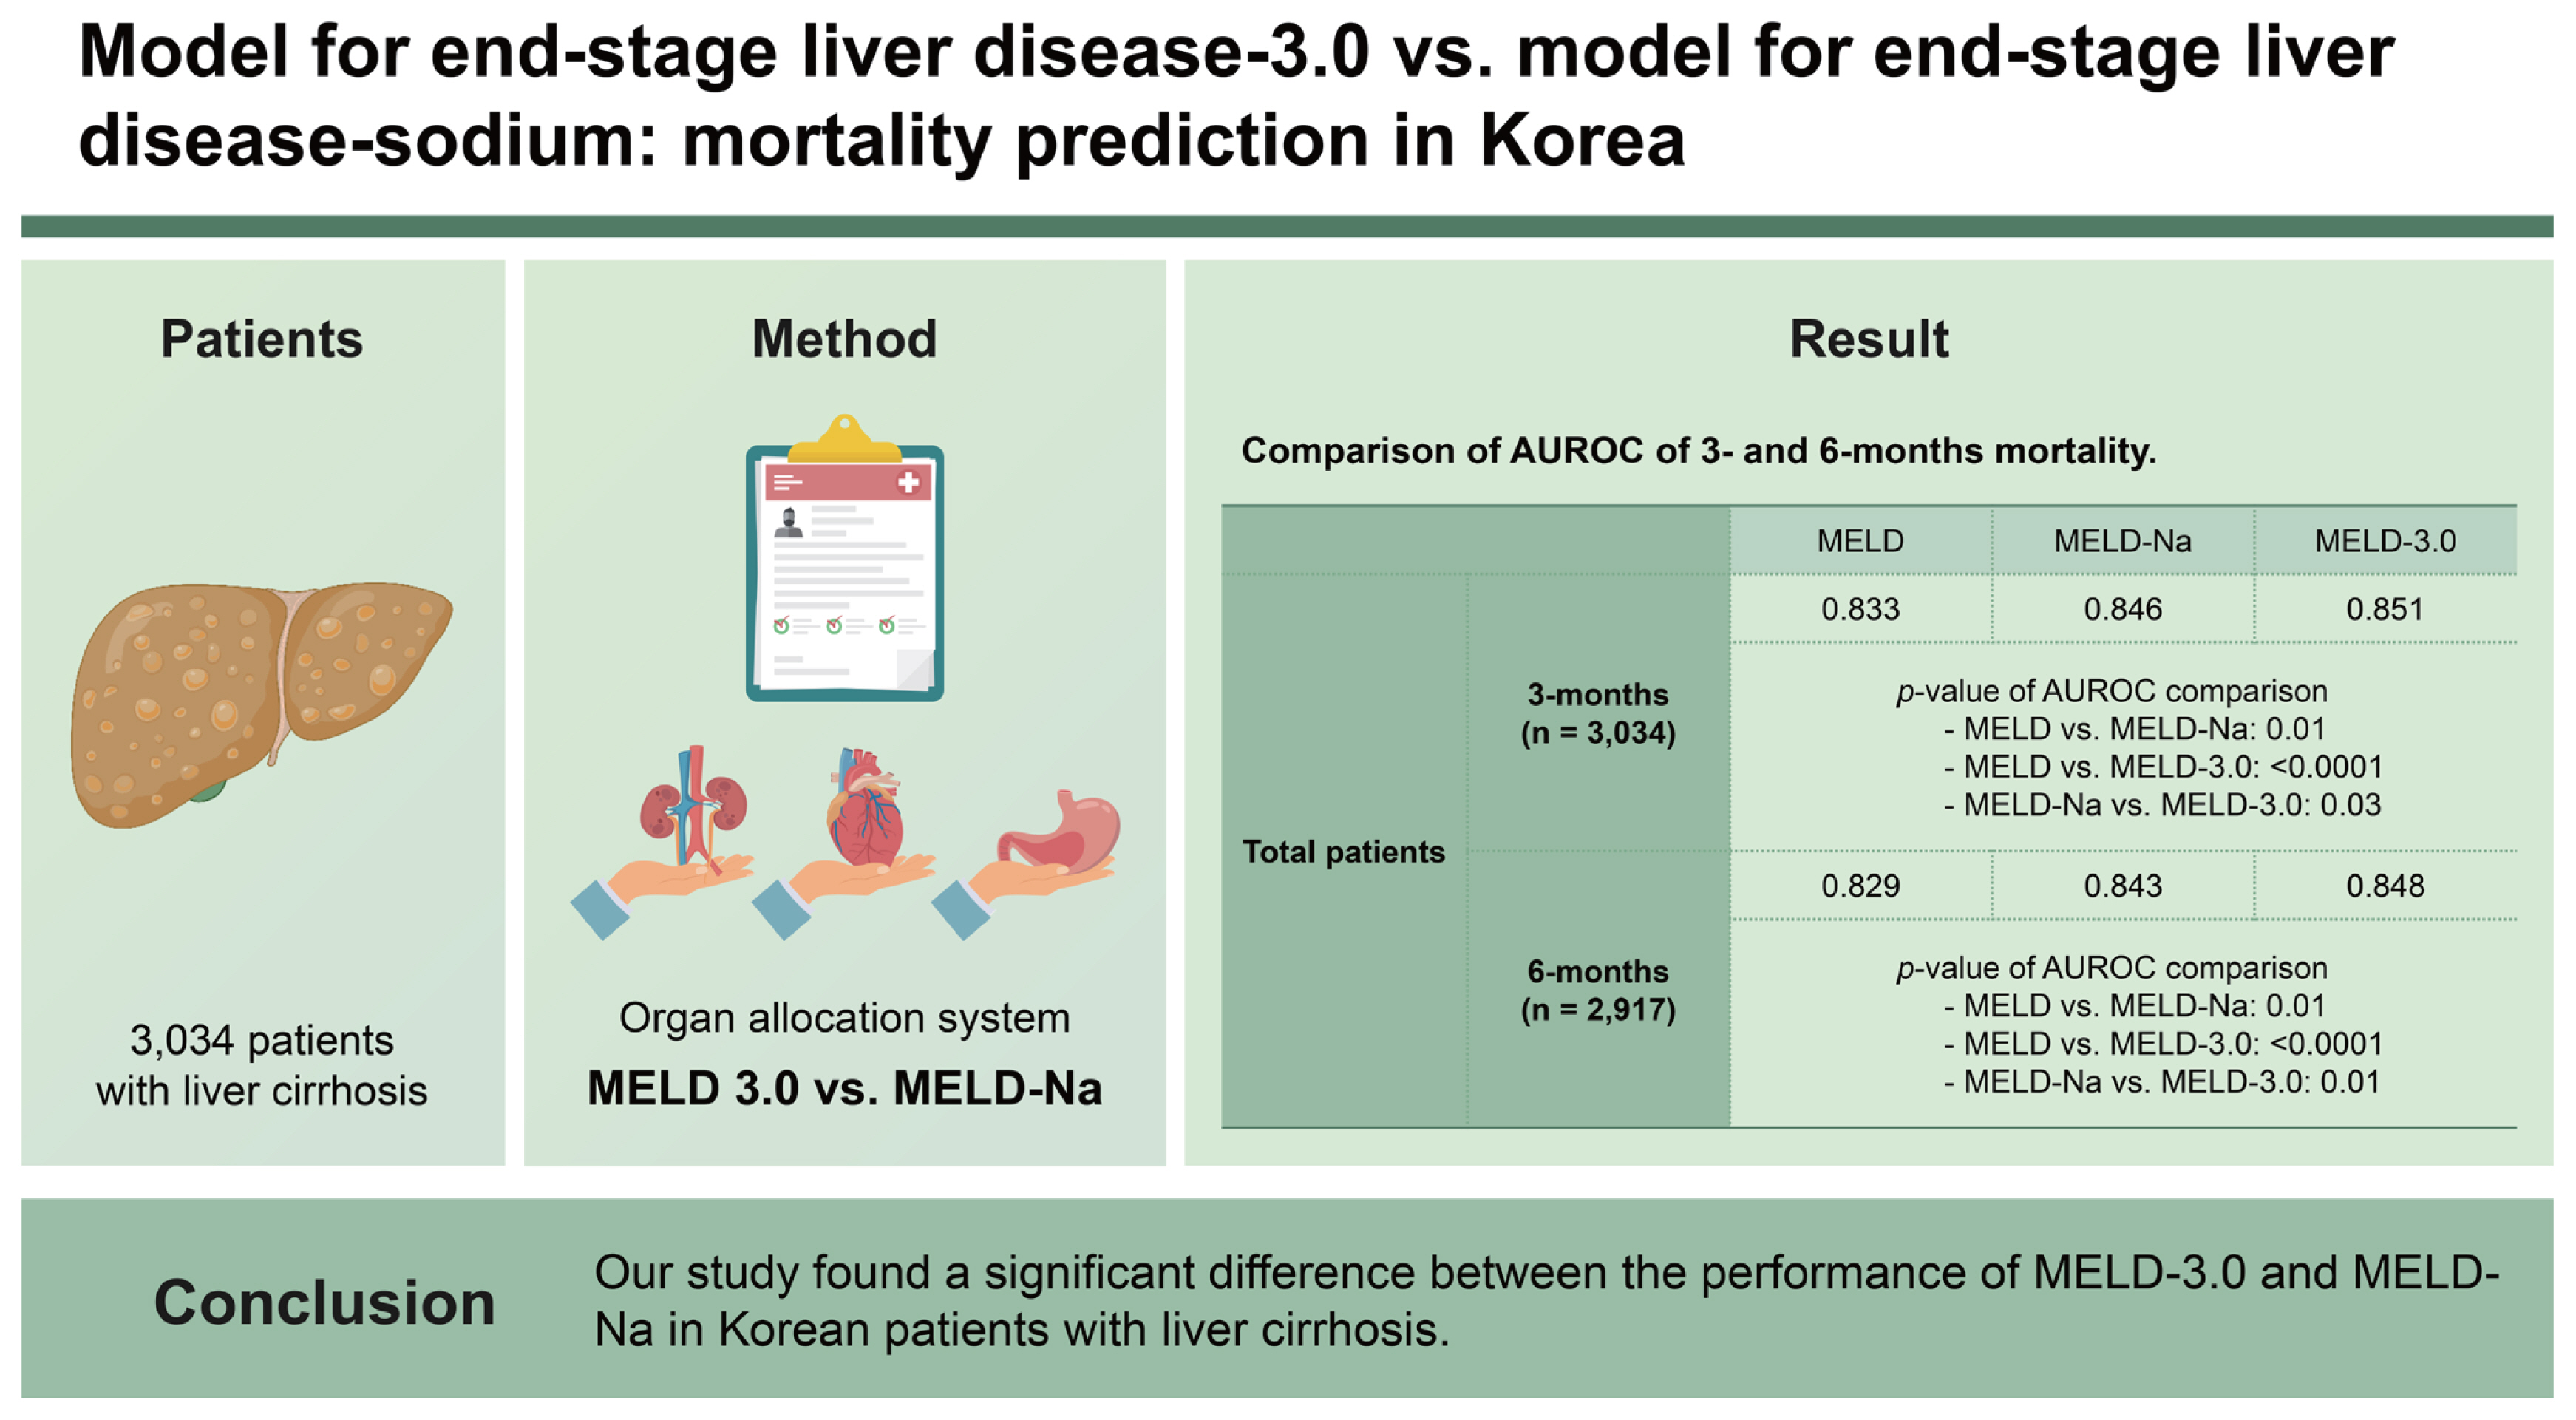
The model for end-stage liver disease (MELD) is an indicator that can predict short-term mortality in patients with liver cirrhosis (LC) and is used to assign priority to liver transplantation in patients with LC in the United States [1,2]. It is still used for liver transplantation in LC patients in Korea. The MELD score is calculated using the serum concentration of total bilirubin, the international normalized ratio (INR) of prothrombin time, and creatinine as variables [1]. However, there have been demands for the inclusion of serum sodium concentration to calculate the MELD score, because hyponatremia reflects the vasodilation state in patients with LC [3,4]. MELD-Na, which includes the serum sodium concentration, is more effective than MELD in predicting mortality rates [5ŌĆō7]. In January 2016, the Organ Procurement and Transplantation Network included the serum sodium level as a factor in the calculation of the MELD score.
Recent discussions have raised concerns regarding the accuracy of the MELD-Na score in predicting mortality. First, there has been a shift in the etiology of LC with a decrease in chronic viral hepatitis due to advances in treatment and an increase in non-alcoholic fatty liver disease (NAFLD) due to the increase in chronic diseases and life expectancy. In addition, easy access to alcohol in modern society has led to an increased incidence of alcoholic liver disease [8]. Second, there is a sex discrepancy in using serum creatinine levels as an indicator of kidney function, with women having lower levels than men for the same function, resulting in an underestimation of mortality risk [9].
As a result, an updated MELD-3.0 was introduced in 2021 to improve mortality prediction [10]. Our goal was to investigate whether MELD 3.0 could better predict mortality compared to MELD-Na in Korean patients with LC.
METHODS
Patients diagnosed with LC and admitted to Konkuk University Hospital between January 2011 and December 2021 were enrolled and retrospectively reviewed. This study was conducted after obtaining ethical approval from the Konkuk University Hospital Internal Review Board (approval number: KUH1010647). To ensure the accuracy of our study, we excluded patients under the age of 18 years, those who had already received liver transplants, and those with exception points (e.g., hepatocellular carcinoma or KlatskinŌĆÖs tumor) at the time of registration. In addition, patients without medical records at 3 and 6 months after their initial admission were excluded. A cohort was finally created to obtain 3- and 6-months mortality rates, and the baseline characteristics of the patients in the cohort were analyzed. In addition, criticism was raised that women were at a disadvantage compared to men in the existing MELD score; therefore, the mortality of men and women was also analyzed using the same MELD score. The MELD, MELD-Na, and MELD-3.0 scores were calculated based on the clinical, laboratory, and radiologic results on the first day of admission. The 3- and 6-months mortality were the primary outcomes of the study, and we compared the predictive values using the MELD, MELD-Na, and MELD-3.0 scores. In addition, considering that MELD-3.0 has a sex variable and reflects a recently changing etiology, a subgroup according to sex and etiology was created. Each subgroup included male, female, hepatitis B virus (HBV) + hepatitis C virus (HCV), and alcoholic patients with LC, and we obtained and compared the results for mortality prediction using MELD, MELD-Na, and MELD-3.0 scores.
Calculation of the MELD, MELD-Na, and MELD-3.0
MELD = 9.57 ├Ś log e(creatinine) + 3.78 ├Ś log e(bilirubin) + 11.20 ├Ś log e(INR) + 6.4
MELD-Na = MELD + [1.32 ├Ś (137 ŌłÆ Na)] ŌłÆ [0.033 ├Ś MELD ├Ś (137 ŌłÆ Na)]
When calculating MELD score, creatinine (mg/dL), bilirubin (mg/dL), and INR values < 1.0 were set to 1.0, and creatinine values were set to 4.0 mg/dL if a patientŌĆÖs serum creatinine was Ōēź 4 mg/dL or the patient received two or more dialysis treatments within the prior week. MELD-Na was obtained by adding the variable Na to the MELD score. The lower and upper bounds of serum sodium concentration (Na) were 125 and 137 mmol/L, respectively.
For the calculation of MELD-3.0, the following formula was used [10]:
MELD-3.0 = 11.14 ├Ś log e(creatinine) + 4.56 ├Ś log e (bilirubin) + 9.09 ├Ś log e(INR) + 0.82 ├Ś (137 ŌłÆ Na) + 1.85 ├Ś (3.5 ŌłÆ albumin) ŌłÆ [0.24 ├Ś (137 ŌłÆ Na) ├Ś log e(bilirubin)] ŌłÆ [1.83 ├Ś (3.5 ŌłÆ albumin) ├Ś log e(creatinine)] + 1.33 (if female) + 6
When calculating the MELD-3.0 score, creatinine (mg/dL), bilirubin (mg/dL), and INR values < 1.0 were set to 1.0 as in the standard MELD calculation. However, creatinine values were set to 3.0 mg/dL if serum creatinine was Ōēź 3 mg/dL or the patient received two or more dialysis treatments within the prior week. In the case of serum sodium, the lower and upper bounds were 125 mmol/L and 137 mmol/L, respectively, similar to that in MELD-Na. The definite difference between MELD-3.0 and MELD-Na is that serum albumin and sex were added as variables and included a factor to indicate the interaction between serum sodium and bilirubin, and serum albumin and creatinine. In the case of albumin, the lower and upper bounds were 1.5 g/dL mmol/L to 3.5 g/dL, respectively. Furthermore, in the case of sex, the formula included the addition of 1.33 points for female patients.
Statistical analysis
The Wilcoxon rank-sum test and chi-squared test were used to compare baseline characteristics in patients. A comparison of the mortality between men and women in the same MELD was obtained by the chi-squared test or FisherŌĆÖs exact test. The R software version 4.2.1 (R Foundation for Statistical Computing, Vienna, Austria) was used. MELD, MELD-Na, and MELD-3.0 scores were calculated, and their predictive values for 3- and 6-months mortality were assessed using the area under the receiver operating curve (AUROC). A comparison of AUROCs was performed using the Delong test in MedCalc version 12.7.2 (MedCalc Software, Mariakerke, Belgium). p < 0.05 indicated statistical significance.
RESULTS
Baseline characteristics
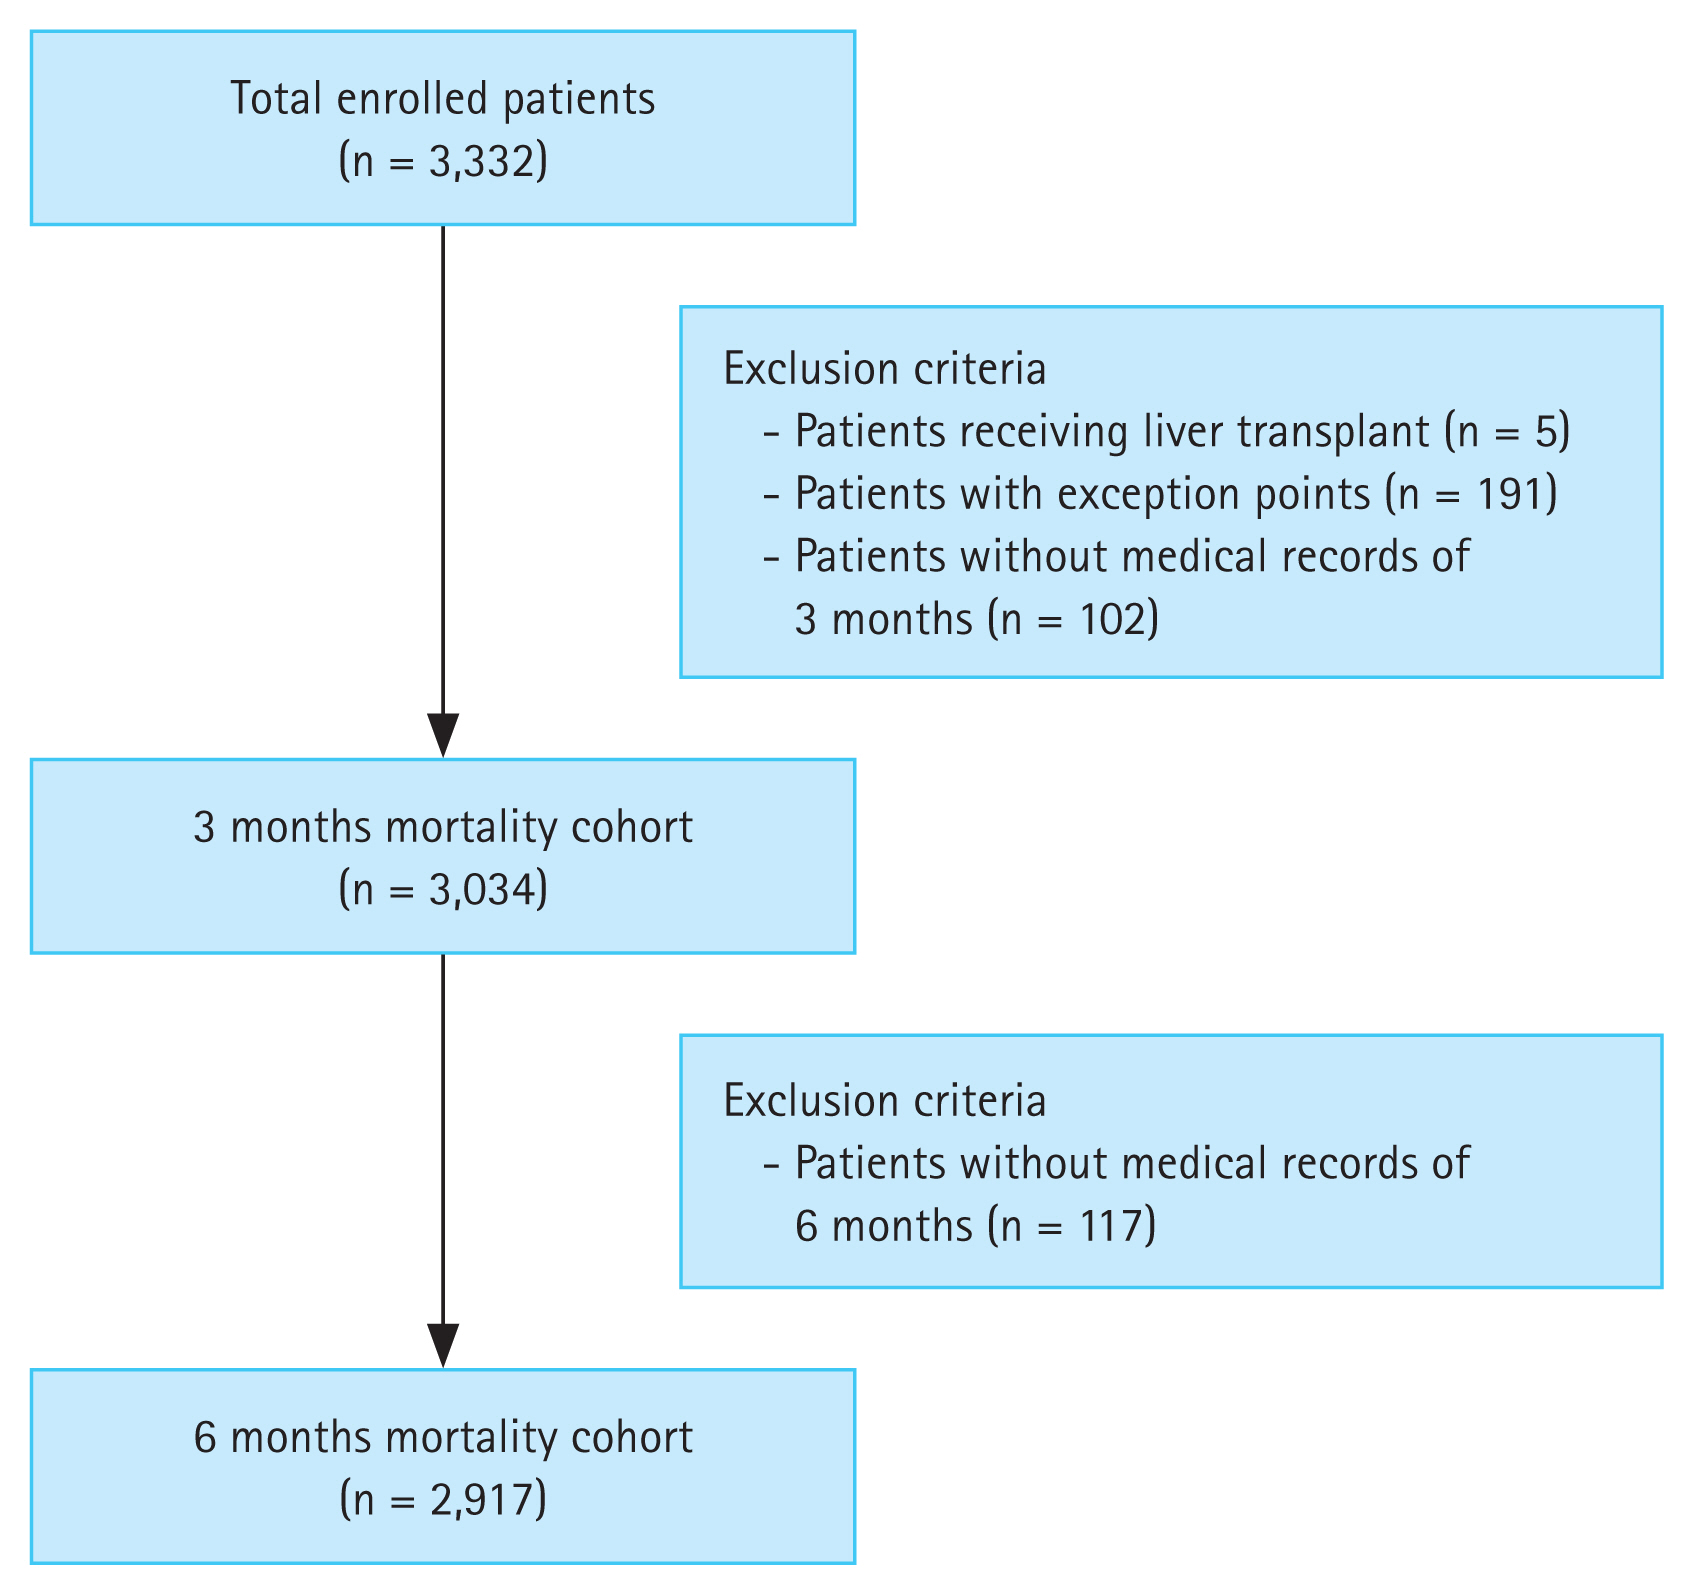
A total of 3,332 patients were enrolled in this study. After applying the exclusion criteria, 3,034 and 2,917 patients were included in the cohorts to obtain 3- and 6-months mortality, respectively. A flow diagram of the inclusion of participants is shown in Figure 1. Among the enrolled patients, 8 underwent liver transplantation. Five patients were excluded from the cohort because they had already received liver transplantation at the time of enrollment, and three patients had received liver transplantation after 6 months. Therefore, all were considered to have survived at 3 and 6 months.
The baseline characteristics of the patients are shown in Table 1, with a majority of male participants (n = 2,060, 67.9%) and a median age of 57.0 years (interquartile range [IQR]: 49.0ŌĆō66.0 yr). The most common etiology of cirrhosis was alcohol consumption (n = 1,586, 52.3%), followed by HBV (n = 779, 25.7%) and HCV (n = 247, 8.2%). The other common causes included autoimmune hepatitis (n = 80, 2.7%), primary biliary cirrhosis (n = 46, 1.4%), and NAFLD/nonalcoholic steatohepatitis (NASH) (n = 40, 1.3%). In this cohort, 1,007 (33.1%) patients had diabetes, and laboratory tests revealed median values of 1.7 mg/dL (IQR: 0.9ŌĆō3.7 mg/dL), 3.1 g/dL (IQR: 2.6ŌĆō3.6 g/dL), 0.8 mg/dL (IQR: 0.7ŌĆō1.1 mg/dL), 136.0 mEq/L (IQR: 132.0ŌĆō139.0 mEq/L), and 1.3 (IQR: 1.1ŌĆō1.5) for bilirubin, albumin, creatinine, sodium, and INR, respectively. The median Child-Turcotte-Pugh (CTP) score was 8.0 (IQR: 6.0ŌĆō10.0) and there were 1,059 (34.9%), 1,203 (39.7%), and 772 (25.4%) patients with CTP class A, B, and C, respectively. The median MELD scores were 12.4 (IQR: 8.8ŌĆō17.7), 14.3 (IQR: 9.8ŌĆō21.5), and 14.8 (IQR: 9.8ŌĆō21.8) for MELD, MELD-Na, and MELD-3.0, respectively. The baseline characteristics of patients who died within 3 and 6 months were shown in Table 1 and 2. It was confirmed that the proportion of men in the 6-month deceased group was significantly higher than that in the survivor group (p = 0.022). Regarding the etiology, the ratio of alcohol consumption was higher in both the 3- and 6-month deceased groups than in the survivor group, which made a significant difference (p = 0.001, p < 0.001). The CTP and MELD scores in the deceased group were high, and the variables constituting them were aggravated.
The baseline characteristics of the enrolled male and female patients are presented in Table 3, with women having a higher median age than men (56.0 vs. 61.0, p < 0.001). Alcohol consumption was high in both sexes, but the ratio was higher in men (61.2% vs. 33.3%), which made a significant difference to the etiology (p < 0.001). Also, there were significant differences in the serum total bilirubin (p = 0.028), albumin (p < 0.001), creatinine (p < 0.001), and sodium (p < 0.001) levels. There were no significant differences in the CTP (p = 0.257) and MELD (p = 0.116) scores, but there were significant differences in the MELD-Na (p = 0.027) and MELD-3.0 (p = 0.001) scores.
Clinical course of patients
The clinical courses of patients who died within 3 and 6 months of initial admission are shown in Table 4. Of the 3,034 patients, 339 (11.2%) died within 3 months; and among the 2,917 patients, 421 (14.4%) died within 6 months. The proportion of deaths was similar in both cohorts. The most common cause of death was hepatic failure in the 3- (n = 128, 37.8%) and 6- (n = 143, 34.0%) months cohorts. This was followed by variceal hemorrhage in the 3- (n = 79, 23.3%) and 6- (n = 101, 23.9%) months cohort. Other causes of mortality included hepatorenal syndrome, spontaneous bacterial peritonitis, and hepatic encephalopathy.
Comparison of mortality according to sex in the same MELD
A comparison of male and female mortality rates in the same MELD is shown in Table 5. The MELD-Na score was classified into five categories (6ŌĆō9, 10ŌĆō19, 20ŌĆō29, 30ŌĆō39, and Ōēź 40), and the mortality of male and female patients in each category was analyzed. There was no significant difference in mortality. However, the mortality rates increased as the MELD-Na score increased, and male mortality was higher in the MELD-Na score range of 20ŌĆō29 (22.5% vs. 18.9%) and 30ŌĆō39 (48.1% vs. 42.9%).
AUROC values and comparison
Three-months mortality
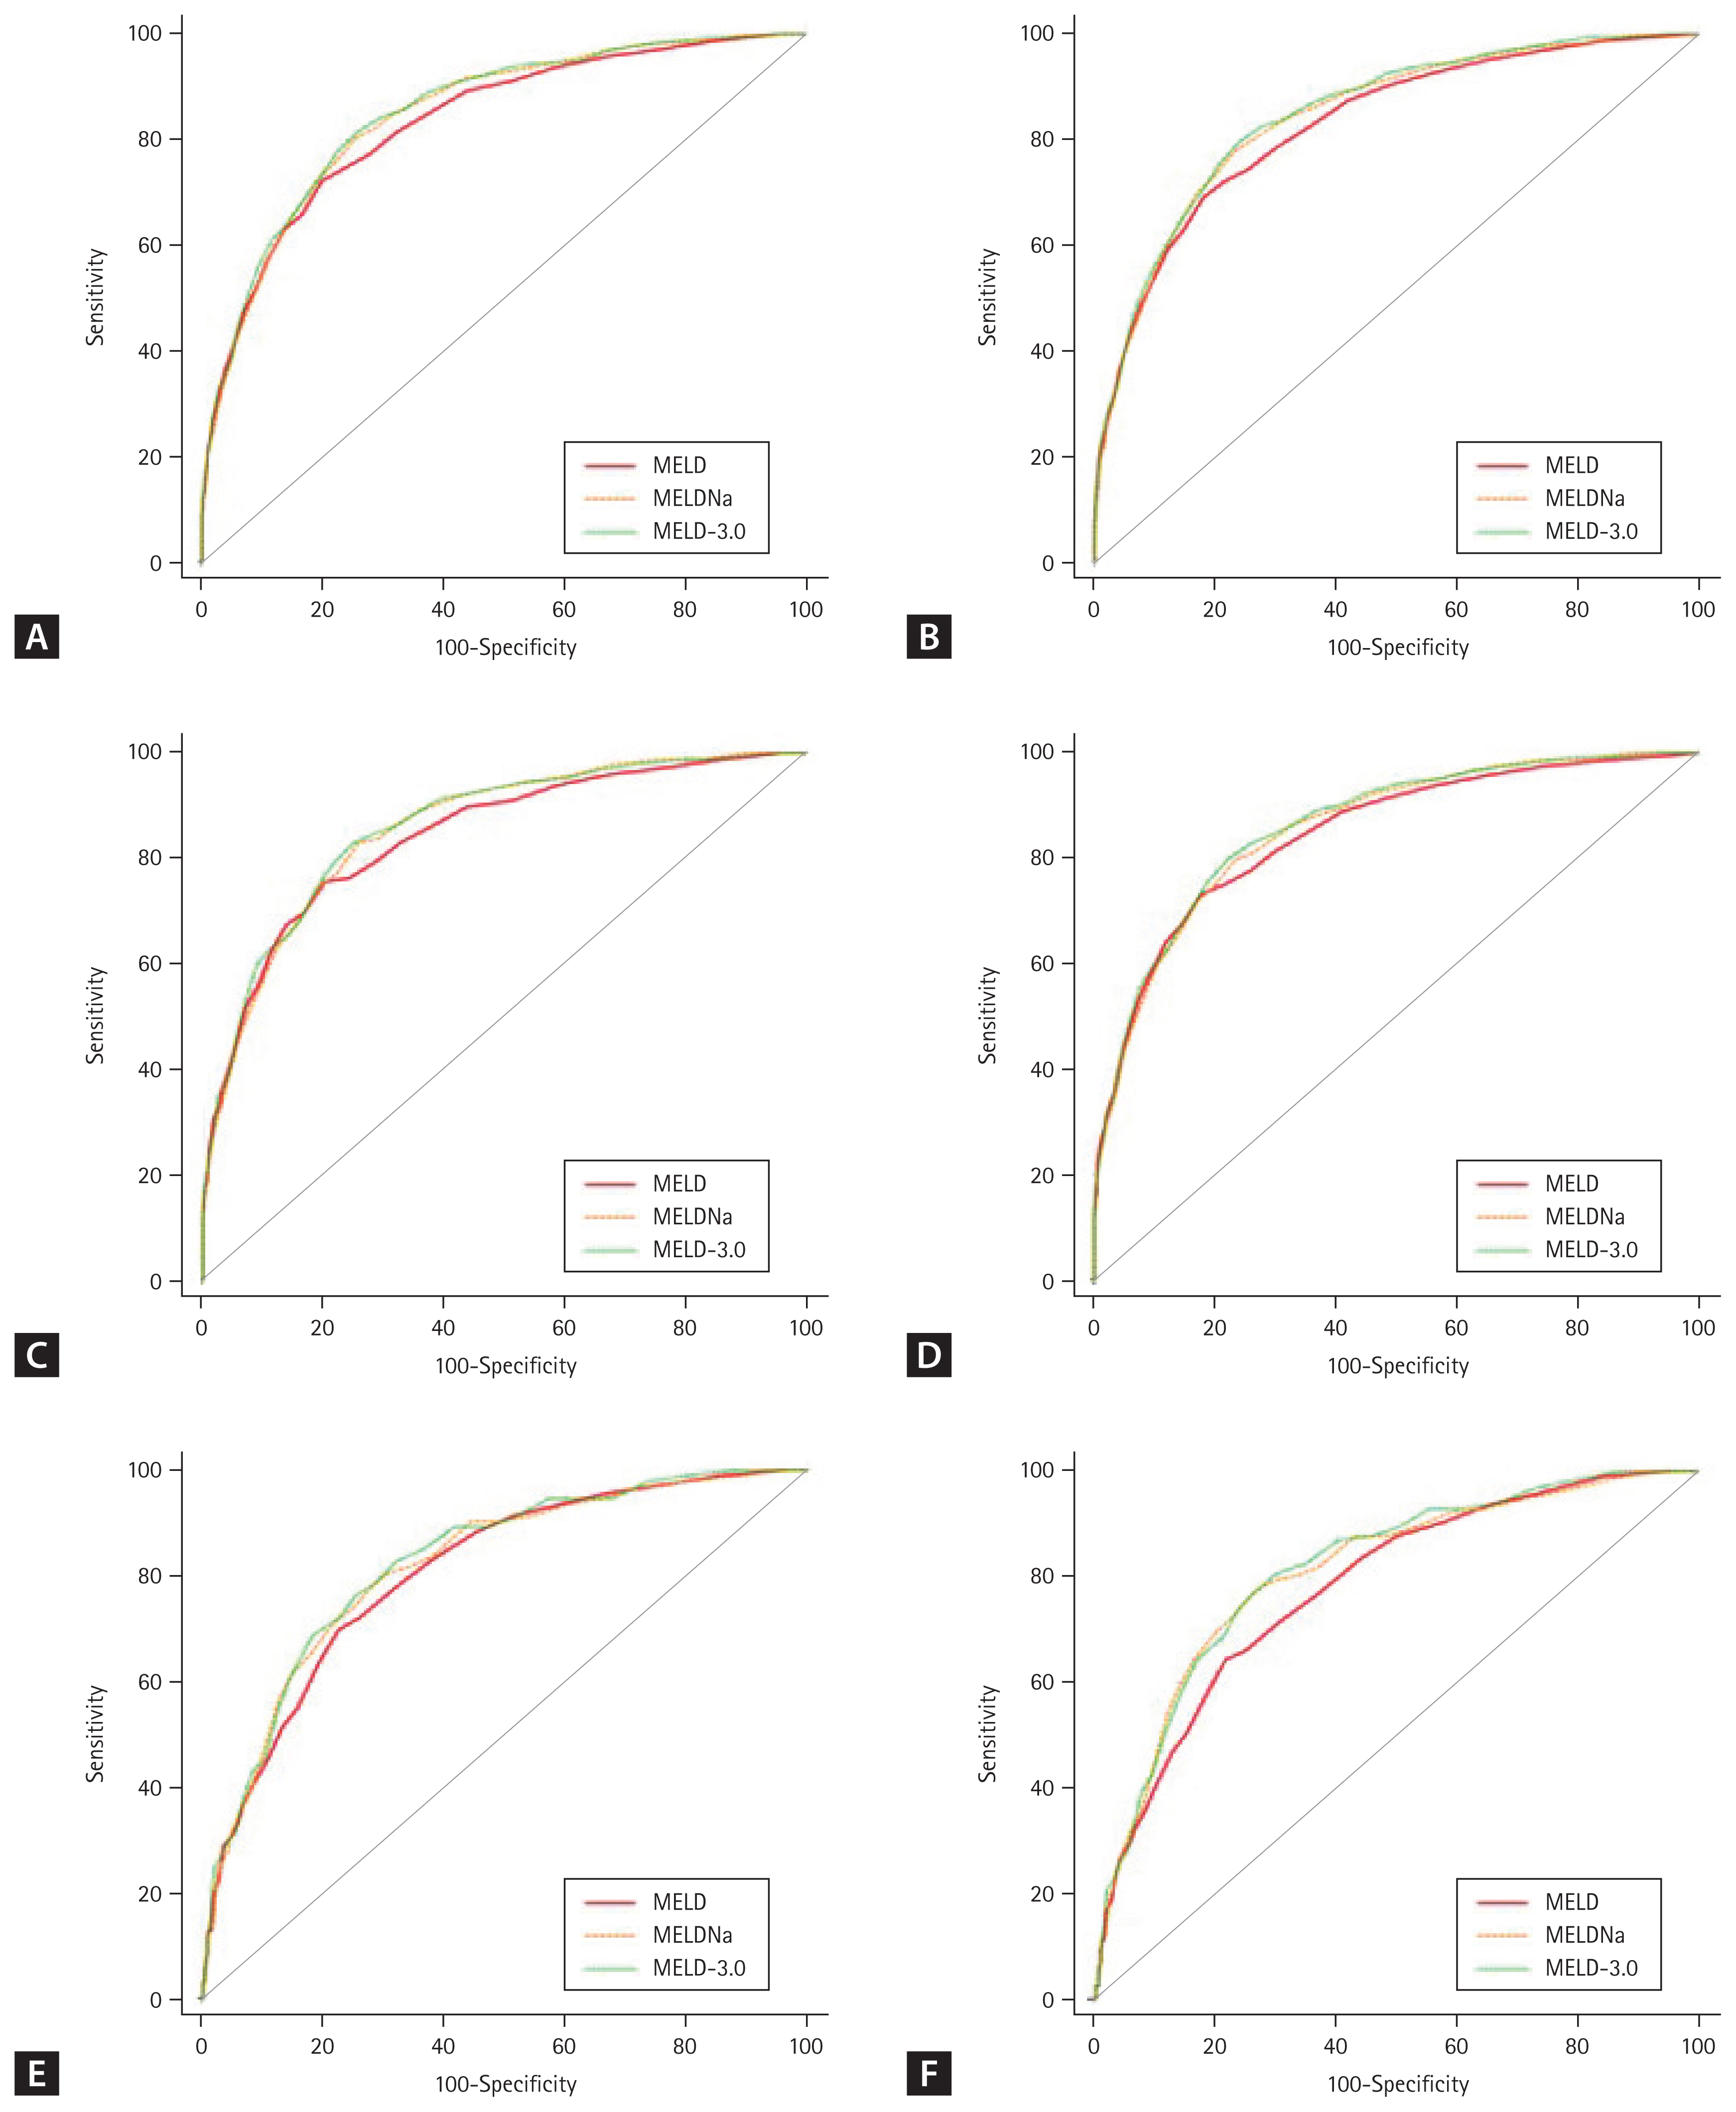
The ROC and AUROC values of the MELD, MELD-Na, and MELD-3.0 scores for 3-months mortality are shown in Figure 2A and Table 6. The AUROC of the MELD, MELD-Na, and MELD-3.0 score was 0.833, 0.846, and 0.851, respectively. The difference between the AUROC values was small, but significant differences were observed in the 3-months mortality prediction among the MELD, MELD-Na, and MELD-3.0 scores. MELD-Na was confirmed to be better than MELD (p = 0.01), and MELD-3.0 was better than MELD-Na (p = 0.03) and MELD (p < 0.0001) in predicting mortality. This means that the mortality prediction in the ascending order of superiority is MELD, MELD-Na, and MELD-3.0.
Since sex was included as a variable in MELD-3.0, we created a subgroup of men and women, and obtained the AUROCs for their 3-months mortality. The ROCs for the male subgroup are shown in Figure 2C, and those for the female subgroup are presented in Figure 2E. In the male subgroup, the mortality prediction in the ascending order of superiority was MELD, MELD-Na, and MELD-3.0. However, in the female subgroup, it was confirmed that there was no significant difference between the mortality prediction of MELD and MELD-Na (p = 0.314). However, the 3-months mortality prediction of MELD-3.0 was significantly different from that of MELD (p = 0.04) and MELD-Na (p = 0.02).
Six-months mortality
The ROCs and AUROC values of the MELD, MELD-Na, and MELD-3.0 scores for 6-months mortality are shown in Figure 2B and Table 6. Similar to the 3-months mortality prediction, we observed a significant difference in the AUROC values. This means that mortality prediction superiority follows the order of MELD, MELD-Na, and MELD-3.0. In the male subgroup, no significant difference was observed between MELD and MELD-Na (p = 0.11), and MELD-3.0 was superior to MELD and MELD-Na in predicting mortality (p = 0.002 and p = 0.002, respectively). In the female subgroup, there was a significant difference between both MELD-Na and MELD-3.0 and MELD (p = 0.02 and p = 0.0003, respectively), but there was no significant difference between MELD-Na and MELD-3.0 (p = 0.09).
Comparison of mortality prediction in subgroups according to etiology
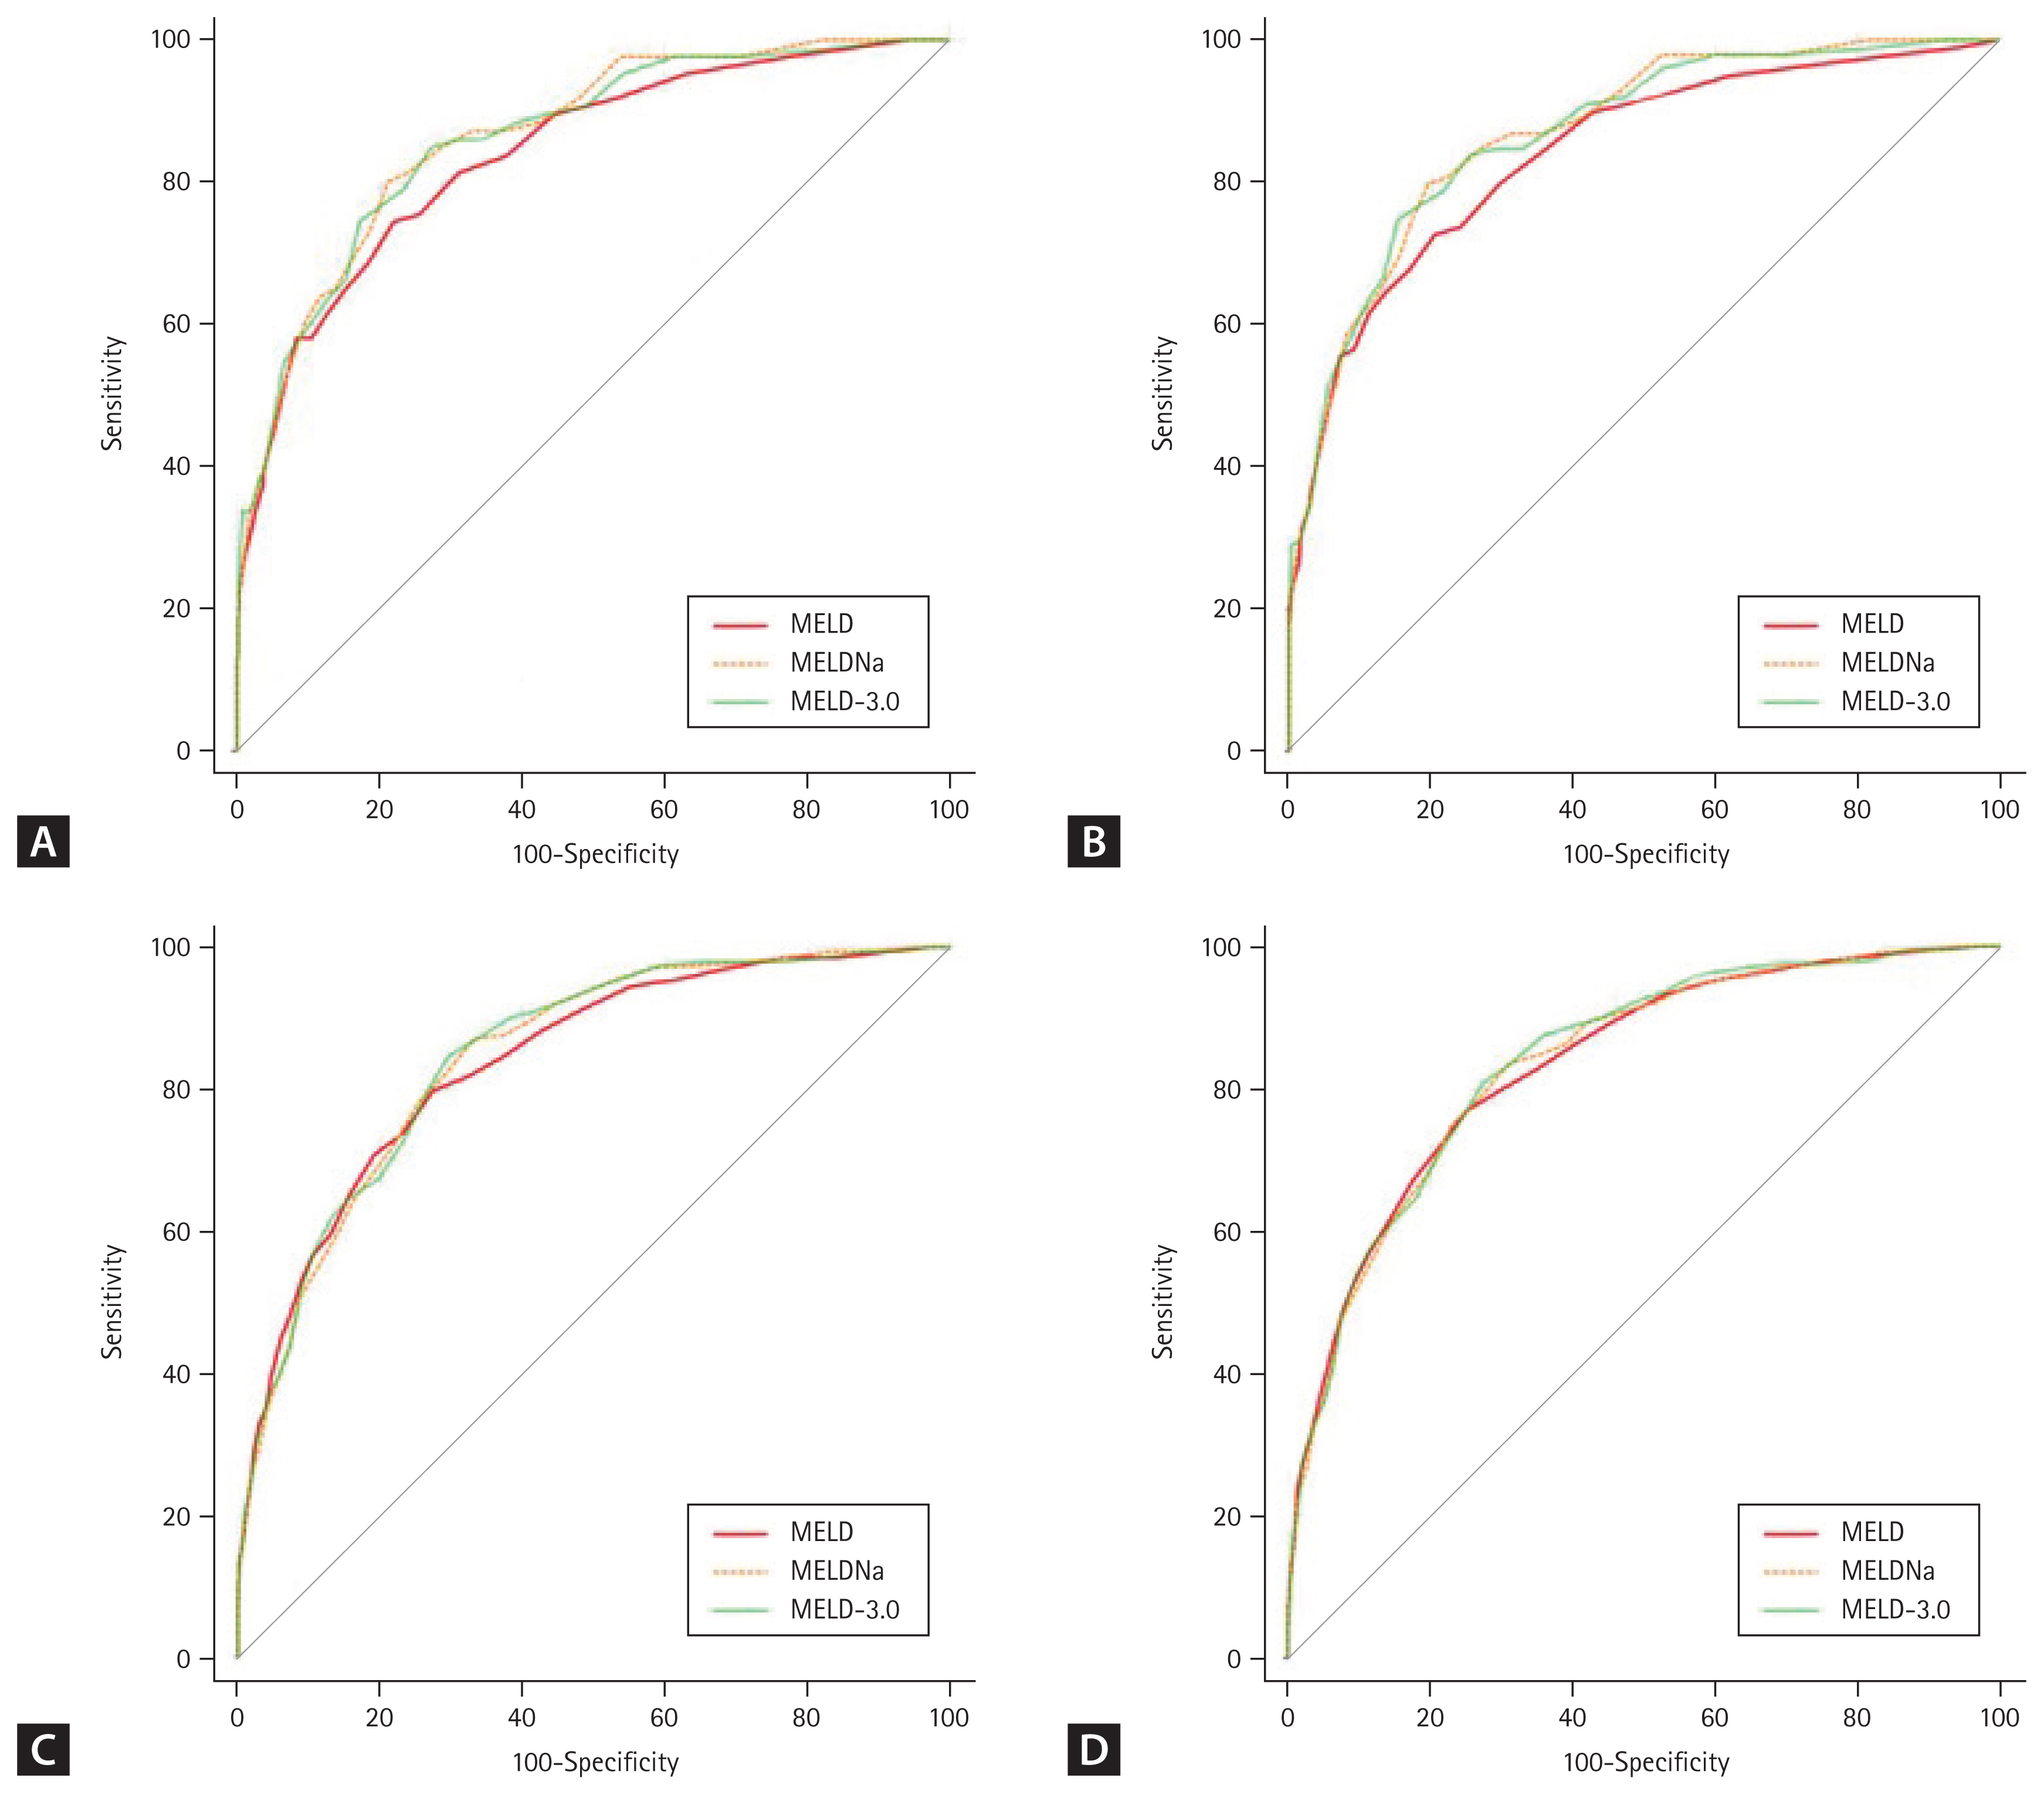
The ROCs and AUROC values of the MELD, MELD-Na, and MELD-3.0 scores for 3- and 6-months mortality in subgroups categorized according to etiology are shown in Figure 3 and Table 7. Among patients with HBV + HCV, the 3-months mortality AUROC of the MELD, MELD-Na, and MELD-3.0 score was 0.839, 0.864, and 0.861, respectively. The 6-months mortality AUROC for the MELD, MELD-Na, and MELD-3.0 score was 0.840, 0.870, and 0.868, respectively. MELD-Na and MELD-3.0 were superior to MELD in both 3- (p = 0.02, p = 0.02) and 6- (p = 0.02, p = 0.02) months mortality predictions, but there was no significant difference between MELD-Na and MELD-3.0 at 3- (p = 0.38) and 6- (p = 0.60) months. In patients with alcoholic LC, the 3-months mortality AUROC of the MELD, MELD-Na, and MELD-3.0 score was 0.838, 0.844, and 0.847, respectively. The 6-months mortality AUROC of the MELD, MELD-Na, and MELD-3.0 score was 0.834, 0.835, and 0.839, respectively. However, there was no significant difference among MELD, MELD-Na, and MELD-3.0 in both the 3- and 6-months mortality predictions.
DISCUSSION
In this study, we investigated the accuracy of MELD-3.0 mortality prediction in Korean patients with LC. This study confirmed that MELD-3.0 had a higher accuracy in mortality prediction than MELD-Na and MELD, indicating that MELD-3.0 reflects a more accurate mortality prediction for the recently changing LC patient population. This result can be attributed to the characteristics of MELD-3.0. In addition to updating the coefficient, MELD-3.0 has three differences compared to the previous MELD system; (1) addition of two variables, namely, female sex and serum albumin; (2) lowering ceiling for serum creatinine from 4.0 to 3.0 mg/dL; and (3) addition of two interaction terms between albumin and creatine, and bilirubin and sodium [10].
The renal function, evaluated using serum creatinine level, was overestimated in women and patients with malnutrition and sarcopenia, which could be a disadvantage in prioritizing patients for liver transplantation [11]. In addition, the number of patients with NAFLD with diabetes mellitus and hypertension has been increasing among patients with LC, and the increase in their serum creatinine levels is indicative of chronic kidney disease (CKD) rather than acute kidney disease (AKD). The elevation of creatinine level in MELD indicates AKD. Therefore, the elevation of creatinine level due to CKD has a small effect on mortality [8,12]. Thus, it is meaningful to lower the score given to the maximum creatinine level by lowering the ceiling of creatinine from 4 mg/dL to 3 mg/dL in MELD-3.0.
To prove the superiority of MELD-3.0 against these changing etiologies, this study compared two subgroups of patients: patients with HBV + HCV and those with alcoholic LC. Patients with alcoholic LC were selected as a subgroup because the number of cases in the NAFLD subgroup was small, and most alcoholic patients, who have recently been increasing in etiology, have DM and HTN. MELD-Na and MELD-3.0 showed no significant differences in the 3- and 6-months mortality predictions in the two subgroups. However, the AUROC of 3-months mortality was greater for MELD-Na than that for MELD-3.0 in patients with HBV + HCV (0.864 vs. 0.861). In contrast, the AUROC of 3-months mortality was greater for MELD-3.0 than that for MELD-Na (0.844 vs. 0.847) in patients with alcoholic LC. Although this difference was not significant, the analysis using MELD-Na for patients with HBV + HCV and MELD-3.0 for patients with alcoholic LC may be superior in mortality prediction.
Women are considered disadvantaged by the existing MELD system compared to men. This is because the risk of death could be underestimated by overestimating renal function based on the serum creatinine concentration. Moreover, women have a smaller abdominal cavity than men; therefore, there is not enough space to receive a large organ [13]. Therefore, MELD-3.0, attempted to overcome this sex disparity by giving women an additional 1.3 points, thereby increasing prediction accuracy. This study compared male and female mortality rates using the same MELD score. Although the difference was not significant, men had a higher mortality than women in the MELD-Na score range of 20ŌĆō29 and 30ŌĆō39. This may be because most male patients have alcoholic LC, and the uncontrolled desire to drink affects their prognosis.
Albumin was included in the MELD-3.0 because it could play a role as a variable in determining the mortality of patients with LC. However, there are side effects to refraining from albumin infusion, even if it is an indication. This is because the administration of albumin may lower the MELD-3.0 score, potentially resulting in disadvantages in liver transplantation priority. However, the interaction term between albumin and creatine, which is included in MELD-3.0, can reduce the influence of albumin and may serve as a solution to this problem. This is because creatinine levels are generally high during albumin administration.
This study proved the superiority of MELD-3.0 in predicting the mortality of Korean patients with LC, but it had several limitations. First, the median MELD score was lower in our study compared to that in the original article [10]: MELD (16.0 vs. 12.4), MELD-Na (18.0 vs. 14.3). The original article focused on the patients on the liver transplantation waiting list, whereas our study included hospitalized patients at an earlier stage of LC. As a result, 34.9% of the patients in our study were classified as CTP Class A. In addition, alcohol consumption accounted for 52.3% of the majority of inpatients, and it could be considered that many HBV and HCV patients were missing. In the case of alcoholic LC patients unable to control their drinking habits, there was a high probability of hospitalization. However, in the case of HBV and HCV patients, it can be considered that many cases are not hospitalized because they do not deteriorate acutely while taking anti-viral agents in the outpatient clinic.
In conclusion, the mortality prediction of the recently introduced MELD 3.0 was compared with that of the existing MELD and MELD-Na to confirm its superiority in Korean patients with LC. Despite the high proportion of patients with alcoholic LC in the cohort and the selection bias caused by not including patients waiting for liver transplantation in the cohort, this study demonstrated that MELD-3.0 was superior to MELD-Na and MELD. Currently, MELD is being used in Korea to determine liver transplant priorities. However, this tool was introduced more than 20 years ago and does not reflect the currently changing etiology of patients or several variables, such as sodium levels, albumin levels, and sex (female), which may be necessary for mortality prediction. Therefore, it is expected that Korea will need to use MELD-3.0 to prioritize liver transplantation.
 PDF Links
 PubReader
 ePub Link
 Full text via DOI
 Download Citation
 Print
Print


