


INTRODUCTION
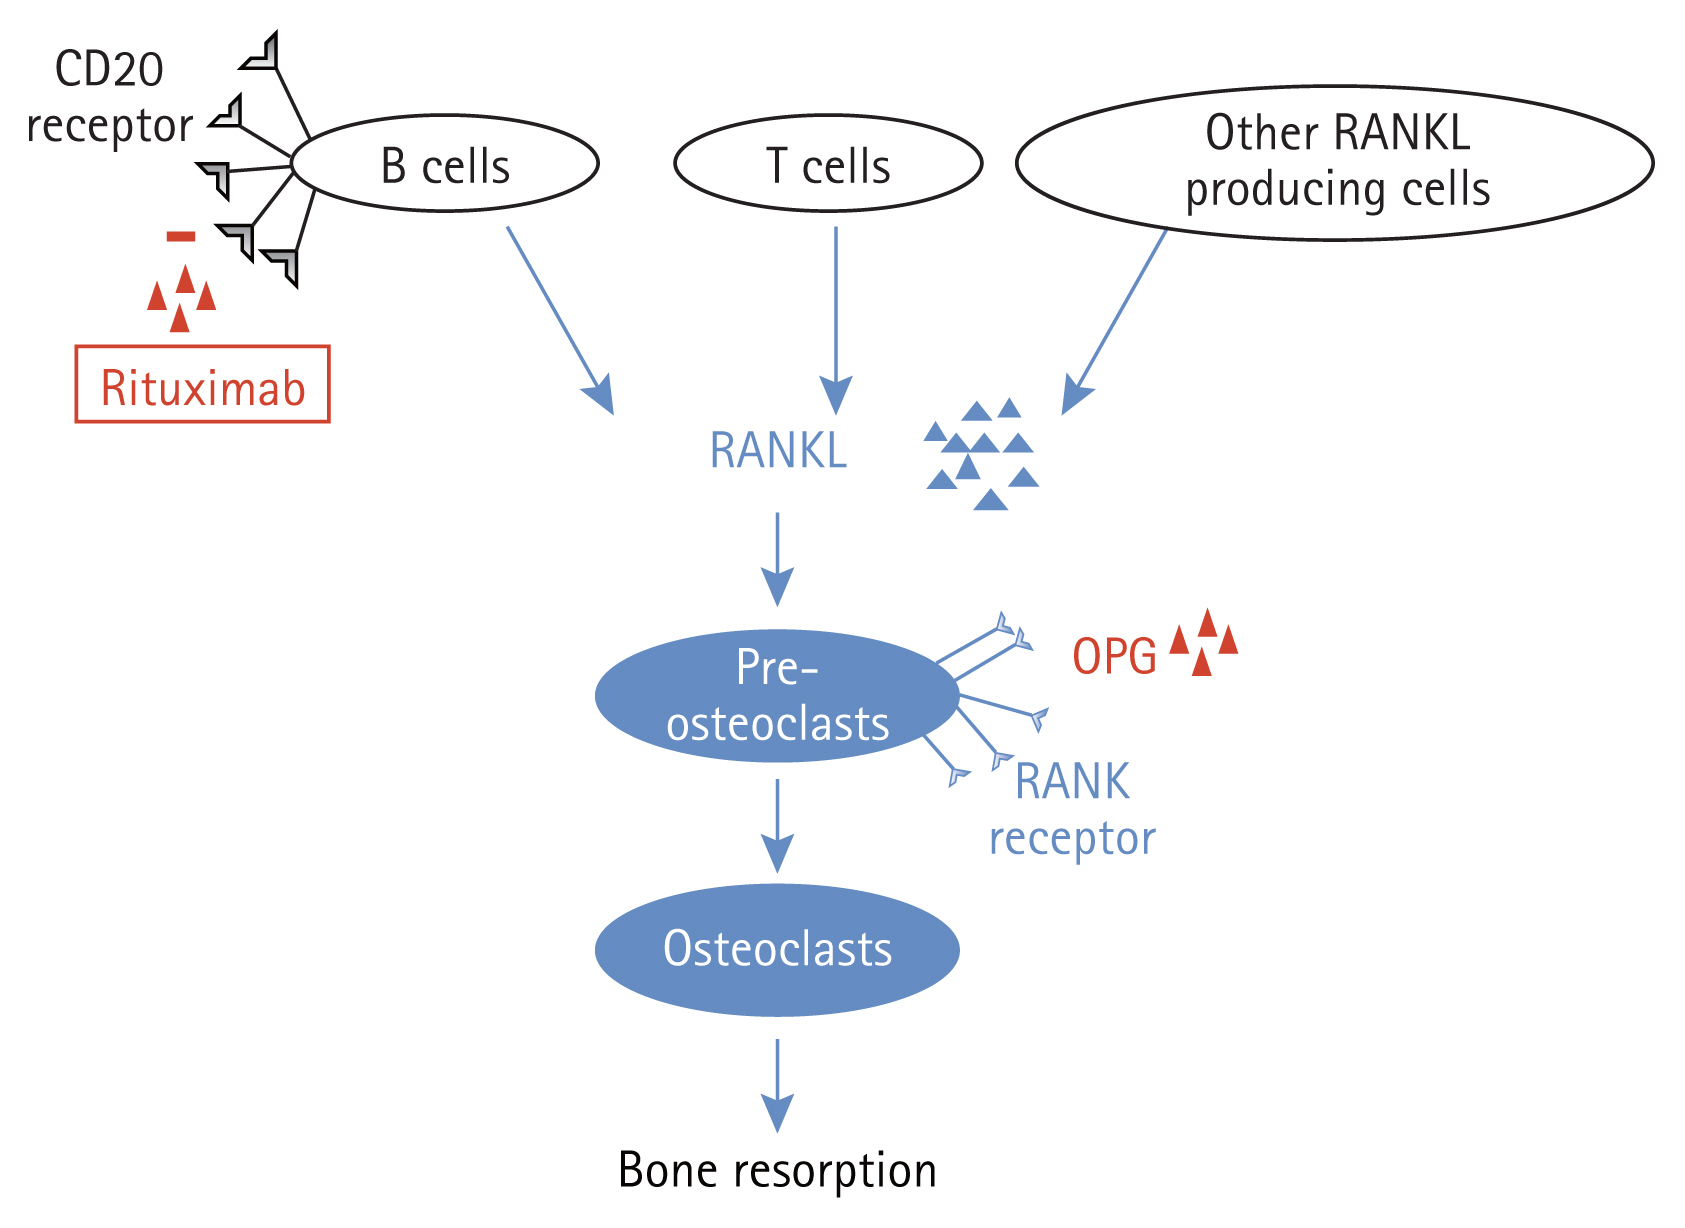
Rheumatoid arthritis (RA) is a systemic autoimmune disease in which B cells play an important role in disease pathogenesis [1]. A clinical trial using rituximab, a monoclonal antibody against CD20 on B cells, demonstrated that depletion of selective B cells can lead to significant clinical improvement in patients with RA [2]. Patients with RA treated with rituximab represent an ideal model for determining the role of B cells in inflammatory bone resorption [1]. Although the role of B cells in the regulation of osteoclast activity remains controversial, receptor activator of nuclear factor kappa-B ligand (RANKL) has been identified as a key membrane-associated factor regulating osteoclast differentiation, and B-lymphoid lineage cells as the main source of endogenous RANKL in bone marrow, thereby supporting osteoclast differentiation [3].
The skeletal complications of RA include focal erosion of the marginal and subchondral bones, juxta-articular osteoporosis, and generalized bone loss with reduced bone mass [4]. The generalized bone loss associated with RA results in an increased risk of osteoporotic fractures in all age groups, both sexes, and various anatomic sites, with an overall relative risk of 2.25 (95% confidence interval, 2.25ŌĆō3.83) [5,6]. Several studies have shown that rituximab effectively inhibits the progression of peripheral joint damage [7,8]. However, data describing the effect of in vivo B cell depletion on general bone loss in patients with RA remain controversial. Studies have shown that bone resorption markers are decreased in patients with RA after B cell depletion [1,9]; however, another study demonstrated a decrease in bone mineral density (BMD) despite improvement in disease control [10]. Experimental data from several studies indicate possible unfavorable effects of B cell depletion on bone remodeling [11ŌĆō13].
The crosstalk between the immune system and cells participating in bone remodeling, such as osteoclasts and osteoblasts, is highly complex. B cell depletion may be beneficial for bone metabolism, and the suppression of systemic inflammation, other than that mediated by B cells, may be important for favorable bone turnover. The present study investigated how systemic bone metabolism is affected in seropositive RA patients treated with rituximab. We explored whether B cells alone or systemic inflammation, with or without B cell involvement, is a determinant of bone turnover. We administered rituximab to patients with highly active RA who were refractory to tumor necrosis factor (TNF) blockers and were prospectively followed up for up to 1 year. If the RA activity worsened for > 6 months after the first cycle of rituximab, a second cycle was administered to appropriate patients. Patients treated with only one cycle of rituximab were compared with those treated with two cycles of rituximab.
METHODS
Patients
Twenty seropositive patients with RA (18 female and 2 male) aged 58 years (range, 38ŌĆō78 yr) were enrolled in the study. All patients met the 2010 American College of Rheumatology/ European League Against Rheumatism classification criteria for RA [14]. They were unresponsive to conventional disease-modifying anti-rheumatic drugs and TNF blockers. Rituximab was administered to all patients according to the approved dosage for RA treatment. Rituximab was administered as a 1,000 mg intravenous infusion on days 1 and 15 in conjunction with intravenous methylprednisolone 125 mg and an antihistamine. Clinical disease activity was determined using the Disease Activity Score based on 28 joints (DAS28) for patients with RA at baseline, 4 months, and thereafter until 12 months after the first cycle of rituximab treatment. If the DAS28 value at 4 months was lower than that at baseline by > 1.2, the patients were regarded as responsive to rituximab therapy. If patients developed joint pain > 6 months after the first cycle of rituximab and their DAS28 value at the time of joint pain was worse than that at 4 months by > 0.6, they were considered to have experienced an RA flare, and a second cycle of rituximab was initiated. Twelve patients remained stable for up to 1 year after the first cycle, whereas eight patients developed RA flares 6 months after the first cycle, and the median time of flare-up was 8 months (8ŌĆō11.75 mo). They were all administered a second cycle of rituximab when RA flares were noted. Seven patients received anti-osteoporosis medications, namely raloxifene (n = 5), bisphosphonate (n = 1), and denosumab (n = 1). One patient receiving the first cycle was administered tacrolimus, whereas one patient receiving the second cycle of rituximab was treated with methimazole for hyperthyroidism. Weight and body mass index (BMI) were 58.0 kg (51.2ŌĆō63.8 kg) and 22.3 kg/m2 (22.0ŌĆō25.5 kg/ m2) in group 1 and 61.0 kg (54.6ŌĆō66.1 kg) and 24.3 kg/m2 (22.6ŌĆō26.8 kg/m2) in group 2, respectively. There were no differences in weight and BMI between the two groups. The patient demographics are presented in Table 1. This study was approved by the Inha University Hospital Institutional Review Board (IRB 13ŌĆō109), and written informed consent was obtained from all patients. This study was carried out from December 2015 to February 2018, prospectively.
BMD measurements
BMD (g/cm2) was measured using dual-energy X-ray absorptiometry (Luna Prodigy Advance; GE Healthcare, Diegem, Belgium). It was measured at baseline and 12 months after the first cycle of rituximab treatment.
Biochemical analyses
Serum samples were obtained from each patient before and 4 and 12 months after the first cycle of rituximab treatment. The samples were processed for routine laboratory tests, including erythrocyte sedimentation rate (ESR) and C-reactive protein (CRP) levels. For bone metabolism markers, serum levels of RANKL, C-terminal telopeptide (CTX), bone-specific alkaline phosphatase (BSALP), and osteoprotegerin (OPG) were measured. The RANKL and OPG levels were measured using commercial assays (Biomedica, Wien, Austria). Both measurements had an inter-assay coefficient of variation (CV) of 3ŌĆō5%. CTX-1 levels were determined using a kit from Nordic Bioscience Diagnostics A/S (Herlev, Denmark). BSALP levels were measured using a commercial assay (Quidel, San Diego, CA, USA) with an inter-assay CV of 5ŌĆō8%. CD19 cells, a marker for the B cell lineage, were quantified at baseline and 4 and 12 months after the first cycle of rituximab treatment.
Cell preparation and culture
Osteoclast preparation and culture were performed as previously described [15]. Peripheral blood mononuclear cells (PBMCs) were isolated via Ficoll-Hypaque density gradient centrifugation. To culture osteoclast precursor cells, isolated PBMCs were suspended in alpha-minimum essential medium containing 1% penicillinŌĆōstreptomycin and 10% fetal bovine serum and plated at a density of 1 ├Ś 106 cells per well in 24-well plates. The cells were incubated in the culture medium, which was then changed to a differentiation medium supplemented with human RANKL and macrophage colony-stimulating factor (both 50 ng/mL; PeptroTech EC Ltd., London, UK). The cells were stained for tartrate-resistant acid phosphatase (TRAP) using an acid phosphatase kit (386-A; Sigma-Aldrich, St. Louis, MO, USA). TRAP-positive giant cells with more than three nuclei were considered osteoclasts. To evaluate osteoclast activity, PBMCs were plated onto bovine bone slices and cultured to perform a resorption assay. The cells were removed and the pits in the bone slices were stained with 0.5% toluidine blue. The slides of the bone sections were reviewed by two researchers who were blinded to the culture sequence. The resorption areas on the bone slices were morphometrically quantified using a computer image analysis program [15]. The total pit resorption area per bone slice was calculated at baseline and 4 and 12 months after the first cycle of rituximab treatment.
Statistical analyses
Data in the table are presented as median (interquartile range). The data were small in number and thus did not follow a normal distribution. Therefore, non-parametric tests were performed on all occasions. Comparisons between the two independent groups in Table 1 were performed using the MannŌĆōWhitney U test. Comparisons of variables over time within the same group were performed using the Wilcoxon signed-rank test. The results were analyzed using SPSS version 19.0 (SPSS Inc., Armonk, NY, USA). Differences were considered statistically significant when the two-sided p values were Ōēż 0.05. Values are expressed as median (interquartile range).
RESULTS
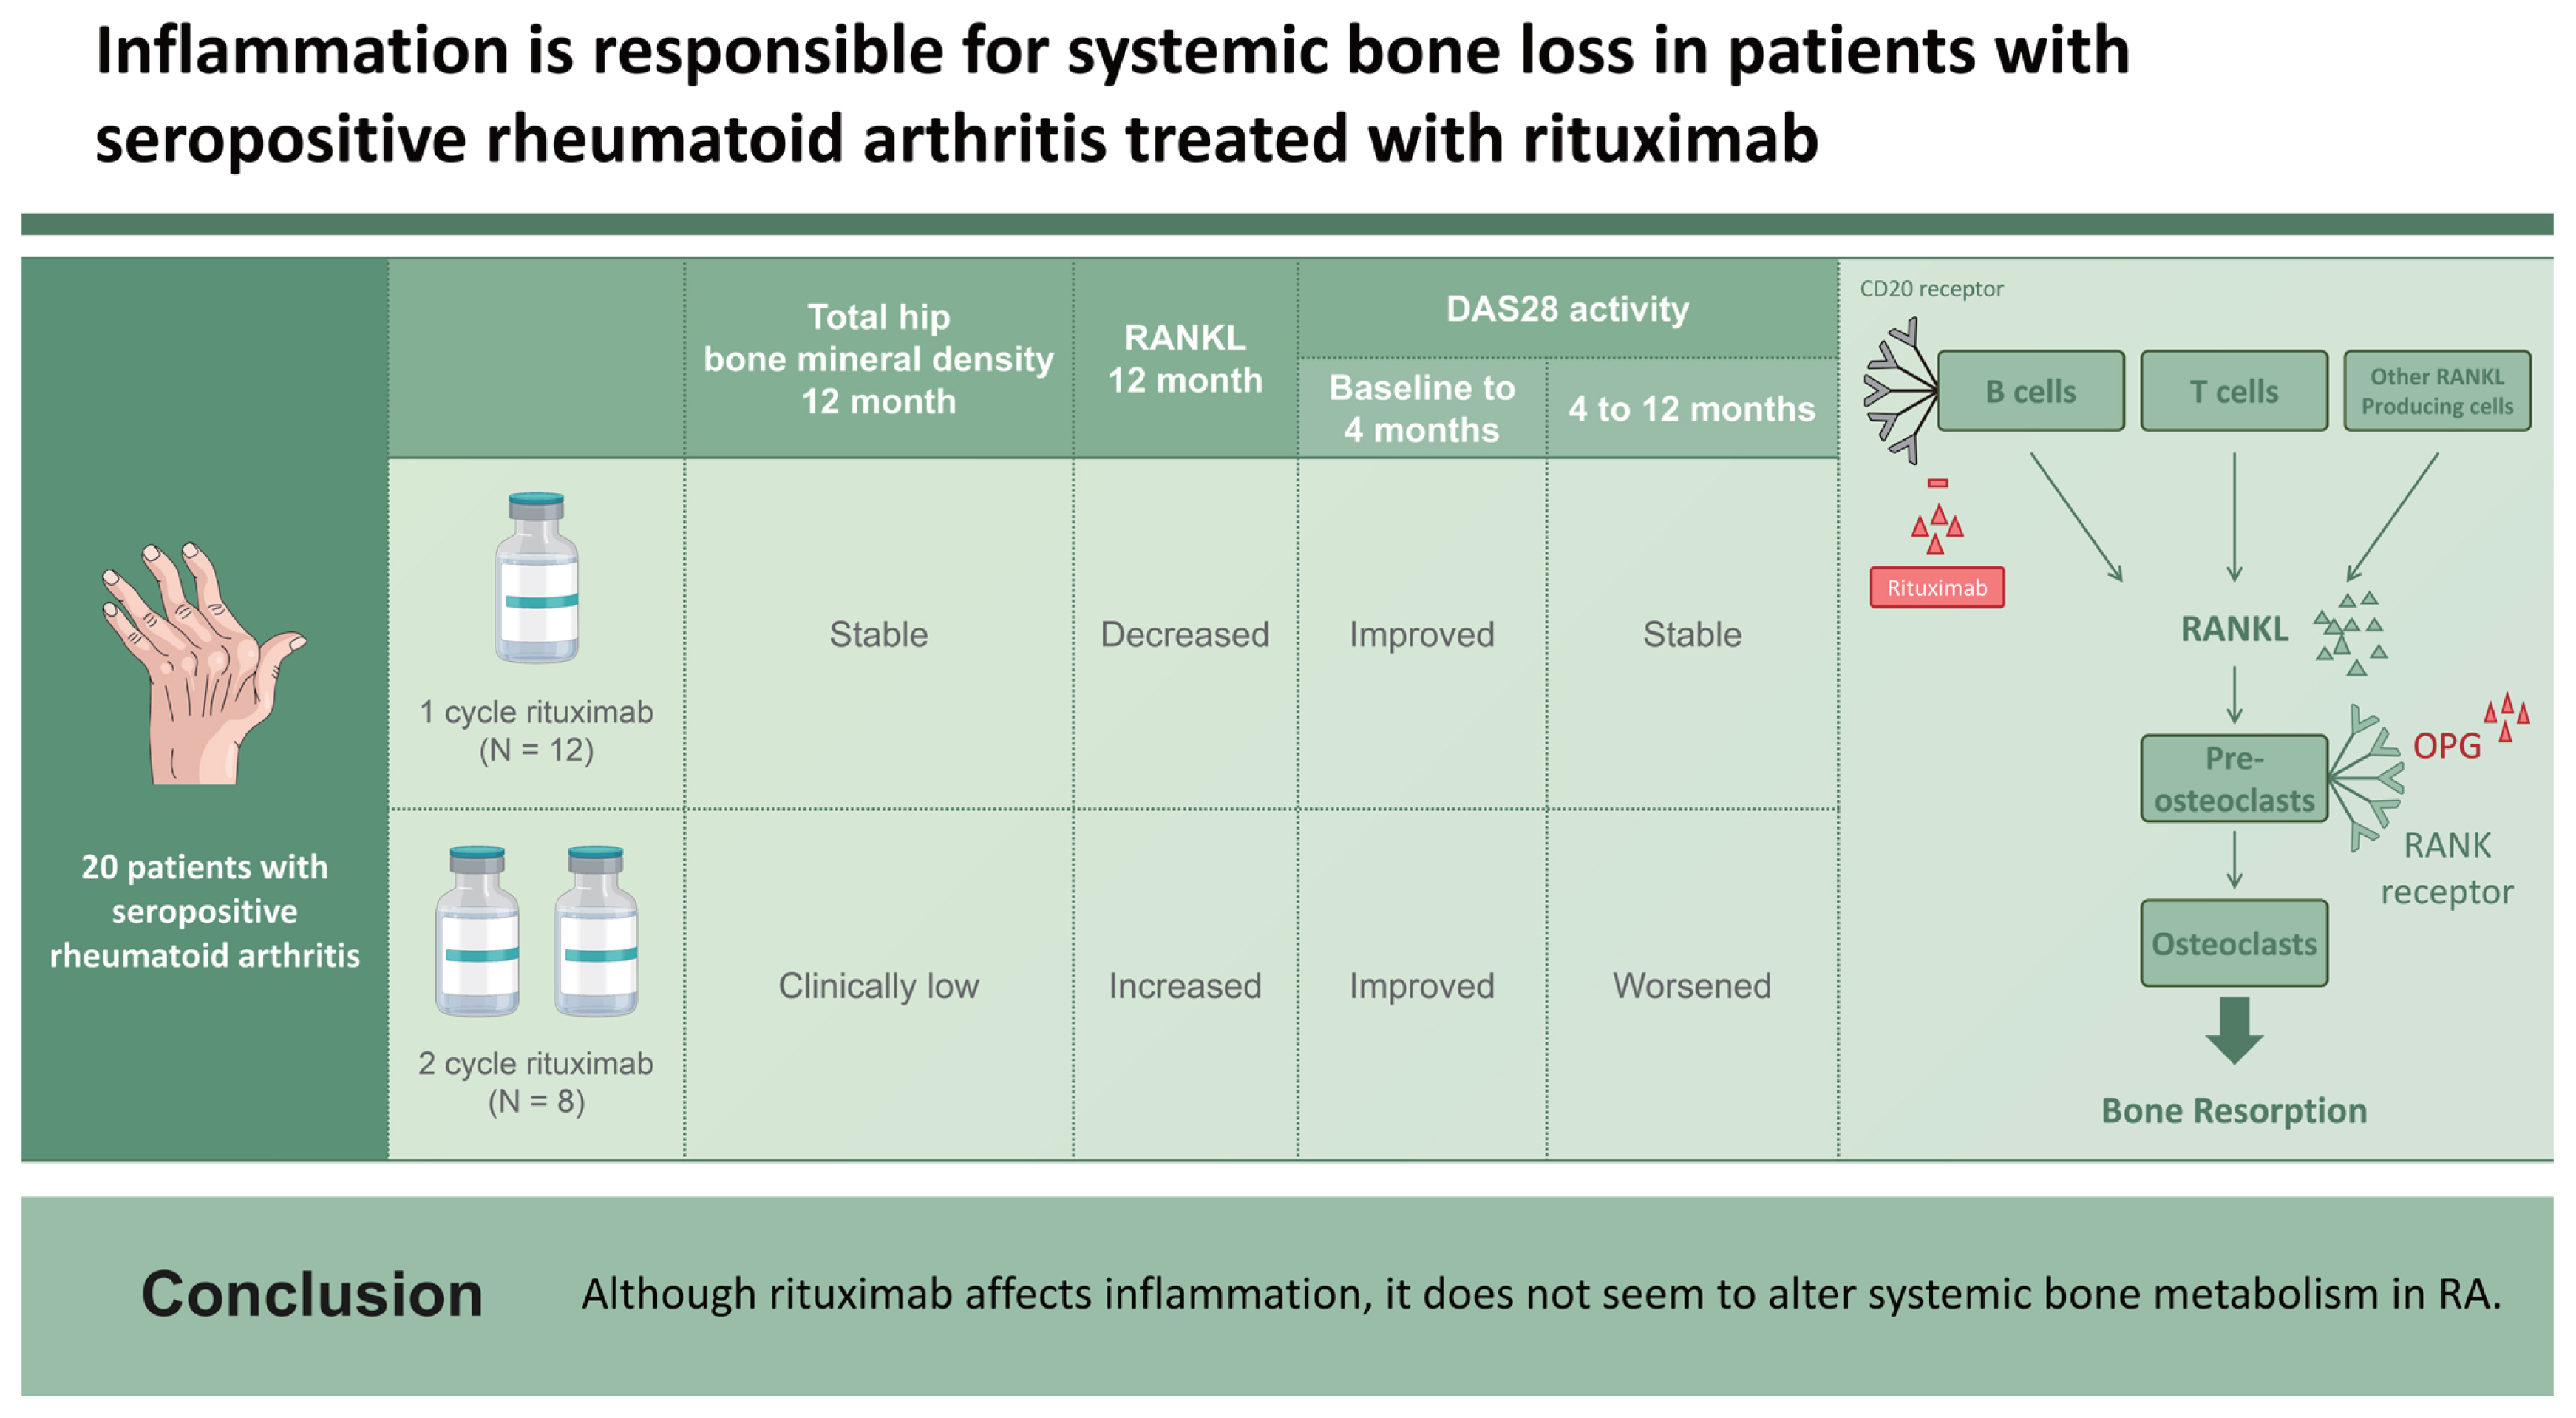
Patients were divided into two groups. Group 1 received only one cycle of rituximab (2 ├Ś 1,000 mg, n = 12) owing to their stable RA activity. Group 2 received two cycles of rituximab (4 ├Ś 1,000 mg, n = 8) due to the occurrence of RA flares. Comparison of demographic variables between groups 1 and 2 did not show any significant changes (Table 1). All patients who received rituximab showed a decrease in the BMD of the femoral neck (p = 0.028; Table 2). Group 1 did not show any change in the BMD 12 months after rituximab treatment, whereas group 2 showed markedly decreased BMD in the total hip (p = 0.043; Table 2). The change in the BMD of the lumbar spine, femur neck, and total hip from baseline to 12 months was prominent in group 2; however, comparison between the two groups failed to show a significant difference (ŌłÆ0.006 [ŌłÆ0.040 to 0.024] in group 1 and ŌłÆ0.061 [ŌłÆ0.074 to 0.017] in group 2; ŌłÆ0.024 [ŌłÆ0.064 to 0.026] in group 1 and ŌłÆ0.040 [ŌłÆ0.057 to 0.002] in group 2; 0.000 [ŌłÆ0.032 to 0.021] in group 1 and ŌłÆ0.056 [ŌłÆ0.075 to ŌłÆ0.009] in group 2, respectively). Given that the least significant changes for the lumbar spine and right total femur were 0.028 g/cm2 and 0.033 g/cm2, respectively, it could be assumed that the BMD in group 2 clinically worsened at 12 months.
Notably, in group 1, serum RANKL levels were significantly decreased at 4 and 12 months compared with those at baseline (p = 0.028 and p = 0.018 at 4 and 12 months after rituximab treatment, respectively), whereas the OPG/RANKL ratio was markedly increased 4 months after treatment compared with that at baseline (p = 0.018 after rituximab treatment). However, in group 2, serum RANKL level was clinically increased 12 months after rituximab treatment, whereas the OPG/RANKL ratio decreased during the same period (p = 0.043 for both RANKL and OPG/RANKL, Table 3). In group 2, BSALP concentrations increased significantly after 4 months of treatment (p = 0.028) but returned to baseline levels 12 months after the first cycle of rituximab treatment. Ex vivo cultures showed no significant changes in the number of osteoclasts or osteoclast activity in the bone-resorbing pits in either group (Table 3).
Regarding systemic inflammation, ESR was markedly decreased in both groups after 4 months of treatment (p = 0.005 and 0.018 in groups 1 and 2, respectively, Table 4). The ESR level remained lower at 12 months than that at baseline in group 1 (p = 0.007). The CRP level was lower at 12 months in group 1 (p = 0.005) and at 4 months in group 2 (p = 0.028) than that at baseline. The DAS28 response was assessed at baseline and 4 and 12 months after the first treatment. In both groups, RA activity, as determined by DAS28-ESR and DAS28-CRP, was reduced 4 months after treatment (p = 0.003 for both DAS28 ESR and DAS28 CRP in group 1, p = 0.012 for both DAS28 ESR and DAS28 CRP in group 2). DAS28 ESR and CRP responses at 4 months were observed in 17 patients. In one patient, both the DAS28 ESR and DAS28 CRP were unresponsive. In two patients, either DAS28 ESR or DAS28 CRP was solely observed to be unresponsive. Thus, a total of three patients were unresponsive to either the DAS28 ESR or DAS28 CRP response criteria, all of whom belonged to group 1. In the study setting, if either DAS28 ESR or DAS28 CRP was recorded as responsive at 4 months, a second administration of rituximab was possible. Thus, in our study, nearly all patients, except for one, were eligible for a second treatment. The DAS28 ESR response at 12 months was observed in seven (58.3%) patients in groups 1 and three (37.5%) patients in group 2. The DAS28 CRP response at 12 months was also similar, as eight (66.7%) patients in group 1 and four patients (50.0%) in group 2 were responsive. In group 2, both DAS28-ESR and DAS28-CRP increased from 4 to 12 months (p = 0.018 for both DAS28 ESR and DAS28 CRP). In group 1, both DAS28 ESR and DAS28 CRP remained low at 12 months compared to baseline (p = 0.007 for DAS28 ESR and 0.009 for DAS28 CRP), whereas only DAS28-ESR at 12 months remained lower than that at baseline in group 2 (p = 0.043).
In both groups, the number of CD19 cells markedly decreased to the nadir at 4 months (p = 0.005 and p = 0.043 in groups 1 and 2, respectively). The CD19 cell count in group 1 increased significantly from 4 to 12 months (p = 0.043); however, the CD19 cell count at 12 months remained lower than that at baseline (p = 0.018).
DISCUSSION
Patients who received two cycles of rituximab showed reduced BMD in the total hip, whereas patients who received only one cycle of rituximab showed stable BMD 12 months after treatment. Most importantly, RANKL measurements differed between the groups. Serum RANKL levels decreased in patients treated with only one cycle of rituximab but increased in patients treated with two cycles of rituximab. The number of CD19 cells decreased at all time points in both groups. The CD19 cell count in group 1 increased markedly from 4 months to 12 months after treatment, which suggests repopulating CD19 cells; however, the number of CD19 cells at 12 months was still lower than that at baseline. Similar to group 2, the median number of CD19 cells at 12 months was greater than that at 4 months, but there was no significant difference. Therefore, the differences in RANKL levels could not be explained solely by B cells, which were represented as CD19 cells in this study. Rituximab can influence bone metabolism in patients with RA either by direct antibody- or inflammation-mediated effects. Generalized bone loss, represented as reduced BMD in the total hip, was pronounced in patients who received two cycles of rituximab. These patients responded to treatment and experienced flares within 1 year before the second cycle. Keystone et al. [8] reported that high disease activity correlated with augmented joint damage progression and that an RA flare before the second cycle could have accentuated radiographic progression. This idea was also supported by a study showing that radiographic progression was significantly increased in patients with periodic flares compared with that in patients with sustained disease control [16]. As disease activity, determined by DAS28 ESR and DAS28 CRP in group 2, increased from 4 to 12 months, it could be assumed that enhanced systemic inflammation reflected by high disease activity was responsible for bone loss in group 2 receiving two cycles of rituximab. The interaction between immune and bone cells is similar to that observed in systemic bone remodeling and peripheral joints. Activated T cells also produce RANKL, the downstream activator molecule of osteoclasts [17,18], and rituximab was found to have no effect on CD4+ or CD8+ T cells in peripheral blood [19]. Therefore, we believe that the increased systemic inflammation associated with the unaltered T cell axis could have affected RANKL secretion, leading to generalized bone loss.
Rituximab successfully reduced the number of B cells in all patients. However, it was previously reported that the effect of rituximab on B cells in the bone marrow was not highly pronounced [20,21]. Rituximab therapy also preferentially depletes activated CD19+HLA-DR+B cells in both the bone marrow and peripheral blood compartments, and the response to rituximab is preceded by a significant decrease in peripheral blood and bone marrow CD19+ CD27+ memory B cells [20]. Moreover, Leandro et al. [21] demonstrated that, despite similar degrees of peripheral blood depletion, the frequency of B cell lineage cells in bone marrow aspirates varies among patients. They also showed that patients who relapsed early after the repopulation of peripheral blood B cells showed a trend (p = 0.170) for a higher percentage of CD19+CD27+ memory B cells than those who relapsed later. In our study, all patients responded to rituximab treatment at 4 months, and CD19 cells reached a nadir at 4 months in both groups. Thus, it could be assumed that CD19+H-LA-DR+B cells in the peripheral blood and bone marrow were depleted. However, patients in group 2 experienced flares, and the number of CD19 cells at 12 months did not differ clinically from baseline. Thus, we believe that memory B cells would have repopulated the peripheral blood, which could be responsible for the RA flares. Peripheral B cells in patients with RA can express RANKL upon stimulation; when switched to memory B cells (CD27+IgDŌłÆ), RANKL expression increases significantly [22]. The RANKŌĆōRANKL pathway is important for osteoclast differentiation and function. Upregulated expression of RANKL in memory B and activated T cells facilitates its interaction with RANK on circulating monocytes. This interaction stimulates the precursors of osteoclasts and osteoclastogenesis, tipping the balance to bone loss [23]. However, the soluble decoy receptor OPG has a negative effect on osteoclastogenesis and causes an imbalance in the OPG/RANKL ratio, which has a positive influence on osteogenesis. Human memory B cells produce RANKL in quantities that exceed those produced by T and memory B cells, supporting osteoclastogenesis in a RANKL-dependent manner in vitro. The number of CD19 cells in peripheral blood was higher at 12 months than that at 4 months in group 1 but was still lower than that at baseline. The CD19 cell count at 12 months in group 2 with the second cycle of rituximab did not increase significantly from 4 months but was not clinically lower than that baseline. We believe that patients in group 1 were still affected by the B cell-depleting effect of rituximab, whereas patients in group 2 were decreasingly affected by rituximab after 12 months. The second cycle of rituximab was administered to all patients in group 2, but the B cell-depleting effects were not observed. Thus, memory B cells might have returned to the peripheral blood and started to produce RANKL in group 1; however, CD 19 cells were still small in number, resulting in few memory B cells producing small quantities of RANKL. The number of CD19 cells in group 2 at 12 months was comparable to that at baseline; thus, memory B cells were ready to produce RANKL in excess quantities, which could also explain the increased RANKL levels and decreased BMD in this group.
Several studies have shown that treatment with rituximab retards peripheral joint destruction by inhibiting osteoclastogenesis [7,8,24]. In our study, patients in group 2 showed BMD loss at the total hip at 12 months, with a decreasing trend in the OPG/RANKL ratio 12 months after rituximab treatment, unlike patients with RA treated with TNF blockers, who displayed decreased BMD in the lumbar spine, total hip, and femur [15]. Wheater et al. [1] previously demonstrated a significant reduction in bone resorption markers, mirrored by a decrease in disease activity. Thus, if RA disease activity is controlled without flares, B cell depletion therapy could be beneficial for bone health in patients with RA.
Systemic inflammation perturbs bone metabolism and promotes bone loss [25]. In a study of a healthy population, the group that experienced an incident fracture had the highest levels of inflammatory markers. In individuals with high levels of three or more inflammatory markers, including CRP, IL-6, TNF╬▒, and soluble receptors of IL-2 and IL-6, the relative risk of fracture was 2.65 [26]. Thus, it has been suggested that elevated levels of inflammatory markers are prognostic for fractures, extending the inflammation hypothesis of aging to osteoporosis. Pro-inflammatory cytokines, particularly TNF╬▒ and IL-1, IL-6, and IL-17, play a key role in the pathogenesis of inflammation-induced bone loss. TNF╬▒ stimulates RANKL secretion by osteoblasts; subsequently, RANKL binds to the RANK receptor on osteoclast precursors and induces osteoclast maturation and activation, leading to bone resorption and inhibition of osteoblast activity and bone formation [27]. In mice, even when TNF-mediated inflammatory arthritis is induced, the bones are fully protected by the absence of IL-1 [28]. Thus, both TNF╬▒ and IL-1 play a key role in the pathogenesis of inflammation-induced bone loss in patients with RA. Synovitis in RA is a source of pro-inflammatory cytokines, such as TNF╬▒, IL-1, IL-6, and IL-17 [29]. Therefore, high disease activity, as determined by large number of synovitis, would have increased the secretion of several pro-inflammatory cytokines that act together to activate osteoclasts, resulting in systemic bone loss.
All patients in this study displayed reduced BMD in the femoral neck after 1 year of rituximab treatment. Seven patients treated with anti-osteoporotic drugs were excluded, and the remaining patients showed reduced BMD in the total hip (p = 0.033). There was a discordance in the loss of bone density between the femoral neck and the total hip. We believe that the loss of bone density solely from the femoral neck was not clinically significant in this study. Serial monitoring of patients revealed greater variability in the magnitude of femoral neck changes than that in the magnitude of total hip changes for the regions of interest, and the total hip lowered the precision error and exhibited small BMD changes with leg rotation [30]. Moreover, a decrease in the BMD of the femoral neck is a characteristic of RA. Sugiguchi et al. [31] reported that patients with RA show a greater decrease in the BMD of the femoral neck than in that of the lumbar spine. The Health Assessment Questionnaire score was negatively correlated with the BMD of the femoral neck [31]. Therefore, we believe that the BMD of the total hip is more responsible for systemic bone loss than that of the hip, especially in patients with RA, and that BMD loss at the total hip accounts for systemic bone loss.
Our study has several limitations. First, the number of patients included in this study was considerably low. Further studies with larger sample sizes are needed. Second, TNF inhibitor therapy was administered to all patients prior to rituximab treatment at various intervals. Rituximab was started at a median of 2 months (0ŌĆō5.5 mo) after TNF blocker treatment, and the TNF blockers might have influenced the baselines variables; however, there was no significant difference in the interval between TNF and rituximab treatment between the two groups. Third, glucocorticoids influence systemic bone loss in patients with RA [32]. Glucocorticoids were used as premedication prior to the infusions. In group 2, the second cycle or rituximab was administered 8 months (8ŌĆō11.75 mo) after the first cycle when an RA flare was noted. Because the follow-up BMD was measured 12 months after the first cycle of rituximab, it is possible that premedication with glucocorticoids influenced the follow-up BMD value in group 2. A study of the effects of steroid premedication on bone metabolism in gastrointestinal cancer showed that additive steroid use is not responsible for reduced BMD [33]. Decreased BMD was significantly linked to the number of chemotherapy cycles but was independent of the total cumulative steroid dose, steroid dose intensity, and additive steroid usage. Thus, we believe that the additive steroid premedication in the present study was not the reason for the bone loss detected in group 2. In conclusion, we believe that exacerbation of RA activity is responsible for systemic bone loss in patients with RA (Fig. 1). If there is an RA flare with increased activity, generalized bone loss worsens despite B-cell-depleting therapy.
KEY MESSAGE
1. Patients receiving two cycles of rituximab had worsened BMD in the total hip after 1 year of treatment.
2. Increased serum RANKL levels may be responsible for the systemic bone loss.
3. Worsened RA activity from 4 to 12 months in patients receiving two cycles of rituximab explains the increased systemic inflammation.
4. Systemic inflammation may be responsible for the increase in RANKL levels, which, in turn, causes systemic bone loss in rituximab-treated patients with RA.
 PDF Links
 PubReader
 ePub Link
 Full text via DOI
 Download Citation
 Print
Print


