


INTRODUCTION
Colorectal cancer (CRC) is the third most common cancer worldwide and is more prevalent in developed countries [1]. Screening for CRC, which is recommended for the average risk population of 50 years and above, has been shown to reduce CRC-related mortality [2,3]. However, the effectiveness of this approach is affected by low adherence and inefficiency [4]. A large number of high-risk individuals have never been screened or have undergone non-invasive tests, resulting in wasted resources. Meanwhile, colonoscopy conducted on low-risk individuals results in a low yield and leads to unnecessary complications. The customization of the screening based on the risk of CRC among the average risk population may improve the screening efficiency and adherence [5]. Several risk-prediction algorithms based on logistic regression (LR) models have been developed to identify individuals at high risk of advanced colorectal neoplasia (ACRN), for which colonoscopy may be most suitable [5-10]. However, these models demonstrated limited performance with low sensitivity and high false-positive rates, which may be due to the limited amount of information used in the model, limited performance of the LR method, or both.
Recently, deep learning has emerged as an alternative approach based on the accumulation of big data, advances in computational power, and improved algorithms [11]. It has outperformed previous machine learning techniques in various domains, including medicine [12]. Deep learning has shown expert-level accuracy in the diagnosis of skin cancer [13], diabetic retinopathy [14,15], lymph node metastasis of breast cancer [16], and colorectal adenoma during colonoscopy [17,18]. Clinical data are rapidly being obtained worldwide, and several laboratory parameters are reported to be associated with the risk of CRC [19]. However, a previous attempt that used an LR method to incorporate laboratory data into a risk model for identifying individuals at high risk of ACRN was not successful, with only minimal performance improvements being realized [10]. Deep learning may offer better prediction models for ACRN by utilizing big clinical data more efficiently than previous LR models.
Therefore, this study aimed to develop and validate a deep learning model for the prediction of the risk of ACRN in asymptomatic adults, and compare the developed model with an existing LR model with respect to CRC screening.
METHODS
Study population
This cross-sectional study was approved by the Institutional Review Board of Kangbuk Samsung Hospital (IRB No. 2017-07-024). The requirement for informed consent was exempted because only anonymized data were used.
We considered consecutive asymptomatic adults who underwent colonoscopy screening during health checkups at the Kangbuk Samsung Hospital Health Screening Center, Seoul, Korea, between January 2003 and December 2012. Exclusion criteria included previous colorectal examinations, such as barium enema, sigmoidoscopy, or colonoscopy, a history of CRC or other malignancies, a history of inflammatory bowel disease, a history of colorectal surgery, incomplete colonoscopy due to failed cecal intubation or inadequate bowel cleansing, and missing clinical data. The overall study population considered in the analysis was randomly split into development and validation groups in the ratio of 4:1.
Dataset
From the health checkup results of the participants, 26 clinical and laboratory parameters were selected as input variables as well as colonoscopy data for the outcome variable.
As previously described [10,20], information on demographics, such as age, sex, and life style factors, was determined using standardized, self-administered questionnaires. For individuals with a family history of CRC, only first-degree relatives were considered, regardless of age. Trained nurses measured the physical parameters. According to the recommendation for Asians, a body mass index (BMI) Ōēź 25 kg/m2 was used to indicate obesity [21]. From the blood samples obtained after 10 hours of fasting, a range of laboratory parameters were measured.
In our screening program, some participants underwent a fecal immunochemical test (FIT) as well as colonoscopy [22]. A one-time stool sample was collected within 3 days before colonoscopy in a buffered sampling tube (Eiken Chemical Company, Tokyo, Japan) and sent to the laboratory on the day of the health examination. Fecal hemoglobin was quantified using an OC-SENSOR DIANA (Eiken Chemical Company) as ngHb/mL. A positive cut-off value of 100 ngHb/mL was considered equivalent to 20 ╬╝gHb/g feces.
Colonoscopy was conducted by 13 board-certified endoscopists using Evis Lucera CV-260 colonoscopes (Olympus Medical Systems, Tokyo, Japan). Colons were prepared with 4 L of polyethylene glycol solution. The endoscopists measured the sizes of all polyps, and then either performed a biopsy or removed them. Gastrointestinal pathologists evaluated histological specimens. ACRN was classified as colorectal carcinoma or advanced adenoma. Advanced adenoma was defined as any adenoma Ōēź 1 cm in size, or one that has a villous component or high-grade dysplasia [10].
Conventional machine learning methods
We first fitted an LR model to the development group for comparison (Supplementary Table 1) [10]. In a previous report, nine variables were manually selected from among 26 variables for this model as follows: age (< 50, 50 to 60, 60 to 70 vs. Ōēź 70 years), sex, smoking status (none/past vs. current), family history of CRC, BMI (< 25 kg/m2 vs. Ōēź 25 kg/m2), serum levels of fasting glucose (< 100 mg/L vs. Ōēź 100 mg/L or diabetes), low-density lipoprotein-cholesterol (LDL-C; < 100 mg/L vs. Ōēź 100 mg/L), and carcinoembryonic antigen (CEA; < 5 and 5 to 10 ng/mL vs. Ōēź 10 ng/mL).
Development of deep neural networks
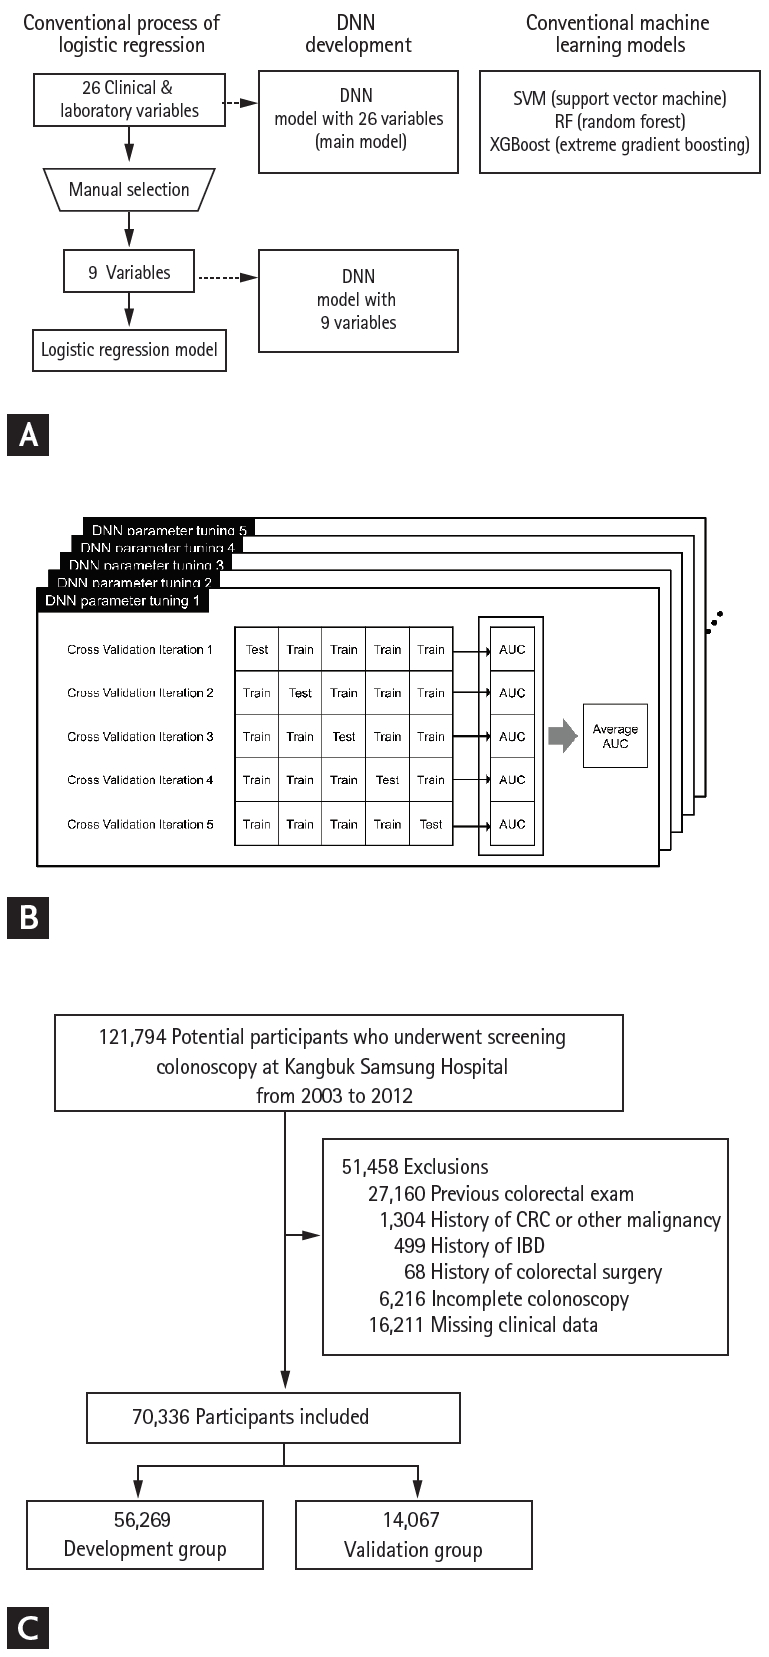
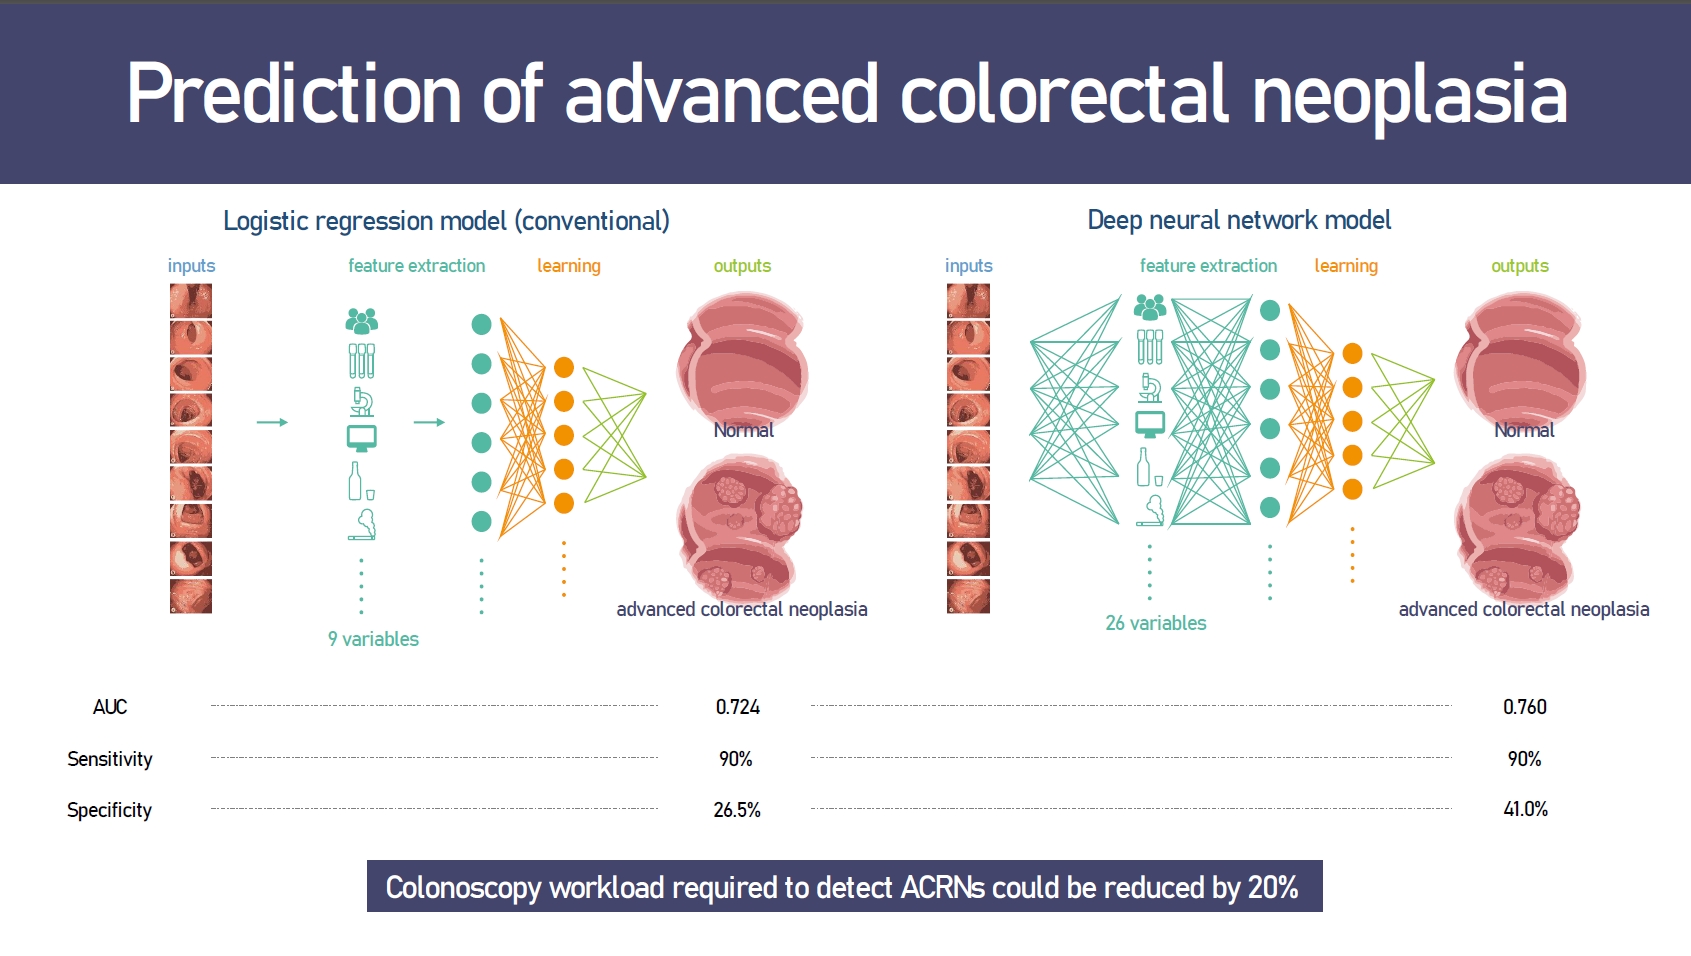
For deep learning, we used a feedforward neural network [25] as the deep neural network (DNN) structure, and Keras (version 2.2.4) [26] in Python (version 2.7.6.) as the deep learning framework. As illustrated in the Fig. 1A, we initially developed the DNN model using the same nine variables as that used in the LR model to determine whether deep learning could predict ACRN better than the LR method when the same information was provided. The main DNN model was developed using all 26 variables in the dataset as input nodes to clarify whether deep learning could overcome the limitations of the LR model, such as the compromise in prediction performance when a large number of covariates are considered. Moreover, all continuous variables were standardized for feature scaling [27]. For hyperparameter tuning, a 5-fold cross-validation was conducted (Fig. 1B) [28]. Consequently, the DNN with nine variables was set to have two hidden layers with 26 nodes for each layer, and the DNN with 26 variables was set to have two hidden layers with 10 nodes for each layer (Supplementary Table 2). Adam was used as an optimization algorithm with learning rate = 0.001, ╬▓1 = 0.9, and ╬▓2 = 0.999, as proposed by Kingma and Ba [29]. The DNNs also applied the Xavier initializer [30] to initialize the weights of hidden units and the sigmoid activation function [31] in each layer. Binary cross-entropy was used to define a loss function [32]. We trained each model for 1,000 iterations using the dataset of the development group. The output value generated from the trained networks indicated the probability of each input case having ACRN, wherein the output ranged between 0 (low probability) and 1 (high probability).
Statistical analysis
The primary analysis involved the comparison of the performance of the DNN model with that of the LR model for the prediction of ACRN in the validation group. The models were compared with respect to their area under the curve (AUC) of the receiver operating characteristic (ROC) curve using the DeLong test [33].
In a previous study on the LR model, the AUC was 0.68, and the prevalence of ACRN was 1.4% [10]. It was assumed that the detection of at least a 0.05 increment in the AUC in the DNN models would be clinically significant; therefore, it was estimated that at least 13,064 individuals would be required to detect this difference with 80% power, 5% significance level, and strong correlations (correlation coefficient, 0.7) between the models, both in the positive and negative cases [34].
From the perspective of CRC screening, model performances were also compared with respect to their sensitivity and specificity at three points with high sensitivity (80%, 90%, and 95%) on the ROC curve, which would be important for screening programs. At each point, the specificity and reduction in the number of colonoscopies needed to detect one ACRN (NNScope) for each method were estimated.
As ad-hoc analyses, we compared the LR and DNN models according to the number of included variables (nine vs. 26). SVM, RF, and XGBoost models as well as DNN were also compared with the LR model that included 26 variables as a reference. Furthermore, the performance of FIT and a combined FIT and clinical score, wherein colonoscopy is recommended for either individuals with positive FIT or a high-risk group in a clinical scoring model [10,35], were compared with the DNN model.
To address the black-box issue, which refers to the inability to learn how a DNN model predicts ACRNs [12], we compared the subjects that were predicted by both the LR and DNN models to have ACRN, those that were predicted only by the LR model, and those that were predicted only by the DNN model at the point of 90% sensitivity. Statistical analyses were performed using the R statistical programming environment, version 3.3.2 (R Development Core Team, Vienna, Austria; http://www.R-project.org). Furthermore, all p values were two-sided, and p < 0.05 was considered statistically significant.
RESULTS
Demographic and clinical characteristics of study population
During the study period, 121,794 individuals were screened. After excluding 51,458 individuals for reasons depicted in Fig. 1C, 70,336 individuals were included in the development group (n = 56,269) and validation group (n = 14,067). The mean age ┬▒ standard deviation (SD) of the overall study population was 41.6 ┬▒ 8.3 years, 69.4% (48,810/70,336) were male, and ACRN was detected in 1.4% (960/70,336) of the participants. The proportion of subjects aged 50 years or older was 15.1% (10,620/70,336), of which 3.9% (414/10,620) had ACRN. There were no significant differences between the demographics and clinical characteristics of the development and validation groups (Table 1). Although the differences in the serum glucose levels and high-sensitivity C-reactive protein (hsCRP) levels were statistically significant because of the large sample size, the actual difference had little clinical significance (development group vs. validation group: mean ┬▒ SD of glucose, 93.5 ┬▒ 14.6 mg/dL vs. 93.9 ┬▒ 15.5 mg/dL, p < 0.007; median [range] of hsCRP, 0.1 [0.0 to 0.1] mg/L vs. 0.1 [0.0 to 0.1] mg/L, p = 0.038).
Performance of DNN model
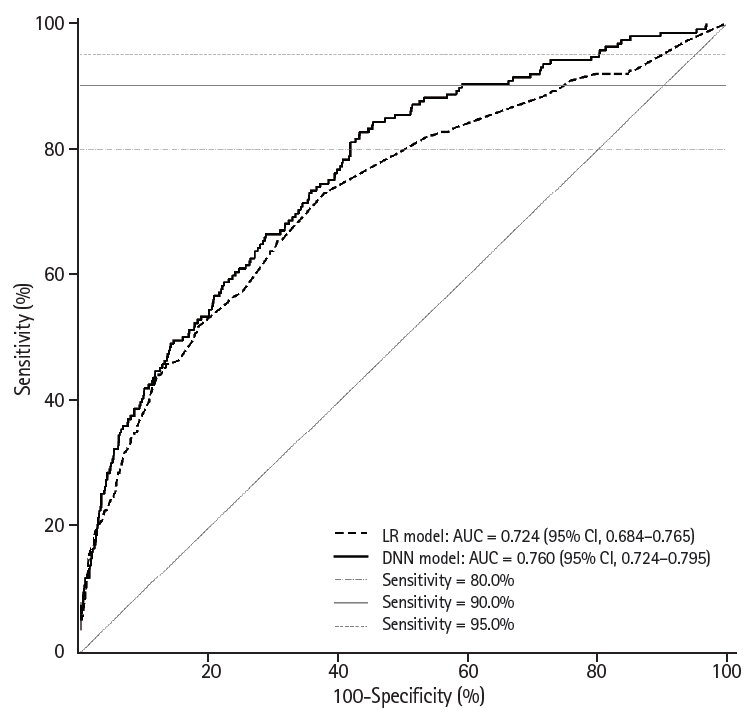
The ROC curves of the LR and DNN models in the validation group are illustrated in Fig. 2. When compared with the LR model (AUC, 0.724; 95% confidence interval [CI], 0.684 to 0.765), the DNN model exhibited significantly improved performance (AUC, 0.760; 95% CI, 0.724 to 0.795; p = 0.009). The superiority of the DNN model over the LR model was prominent at the points with high sensitivity (Ōēź 80%) on the ROC curve. The performances of the prediction models with respect to CRC screening are presented in Table 2. At a sensitivity of 90%, with respect to detecting ACRNs, the specificity significantly increased with the application of the DNN model (41.0%) in comparison with the LR model (26.5%, p < 0.001). The DNN model could reduce the colonoscopy workload estimated by the NNScope that is required to detect the same number of ACRNs as the LR model by 19.9%. At other points with sensitivities of 80% and 95%, the DNN model demonstrated a slightly attenuated but still significant benefit over the LR model with a 13.8% and 8.4% reduced colonoscopy workload, respectively (both p < 0.001).
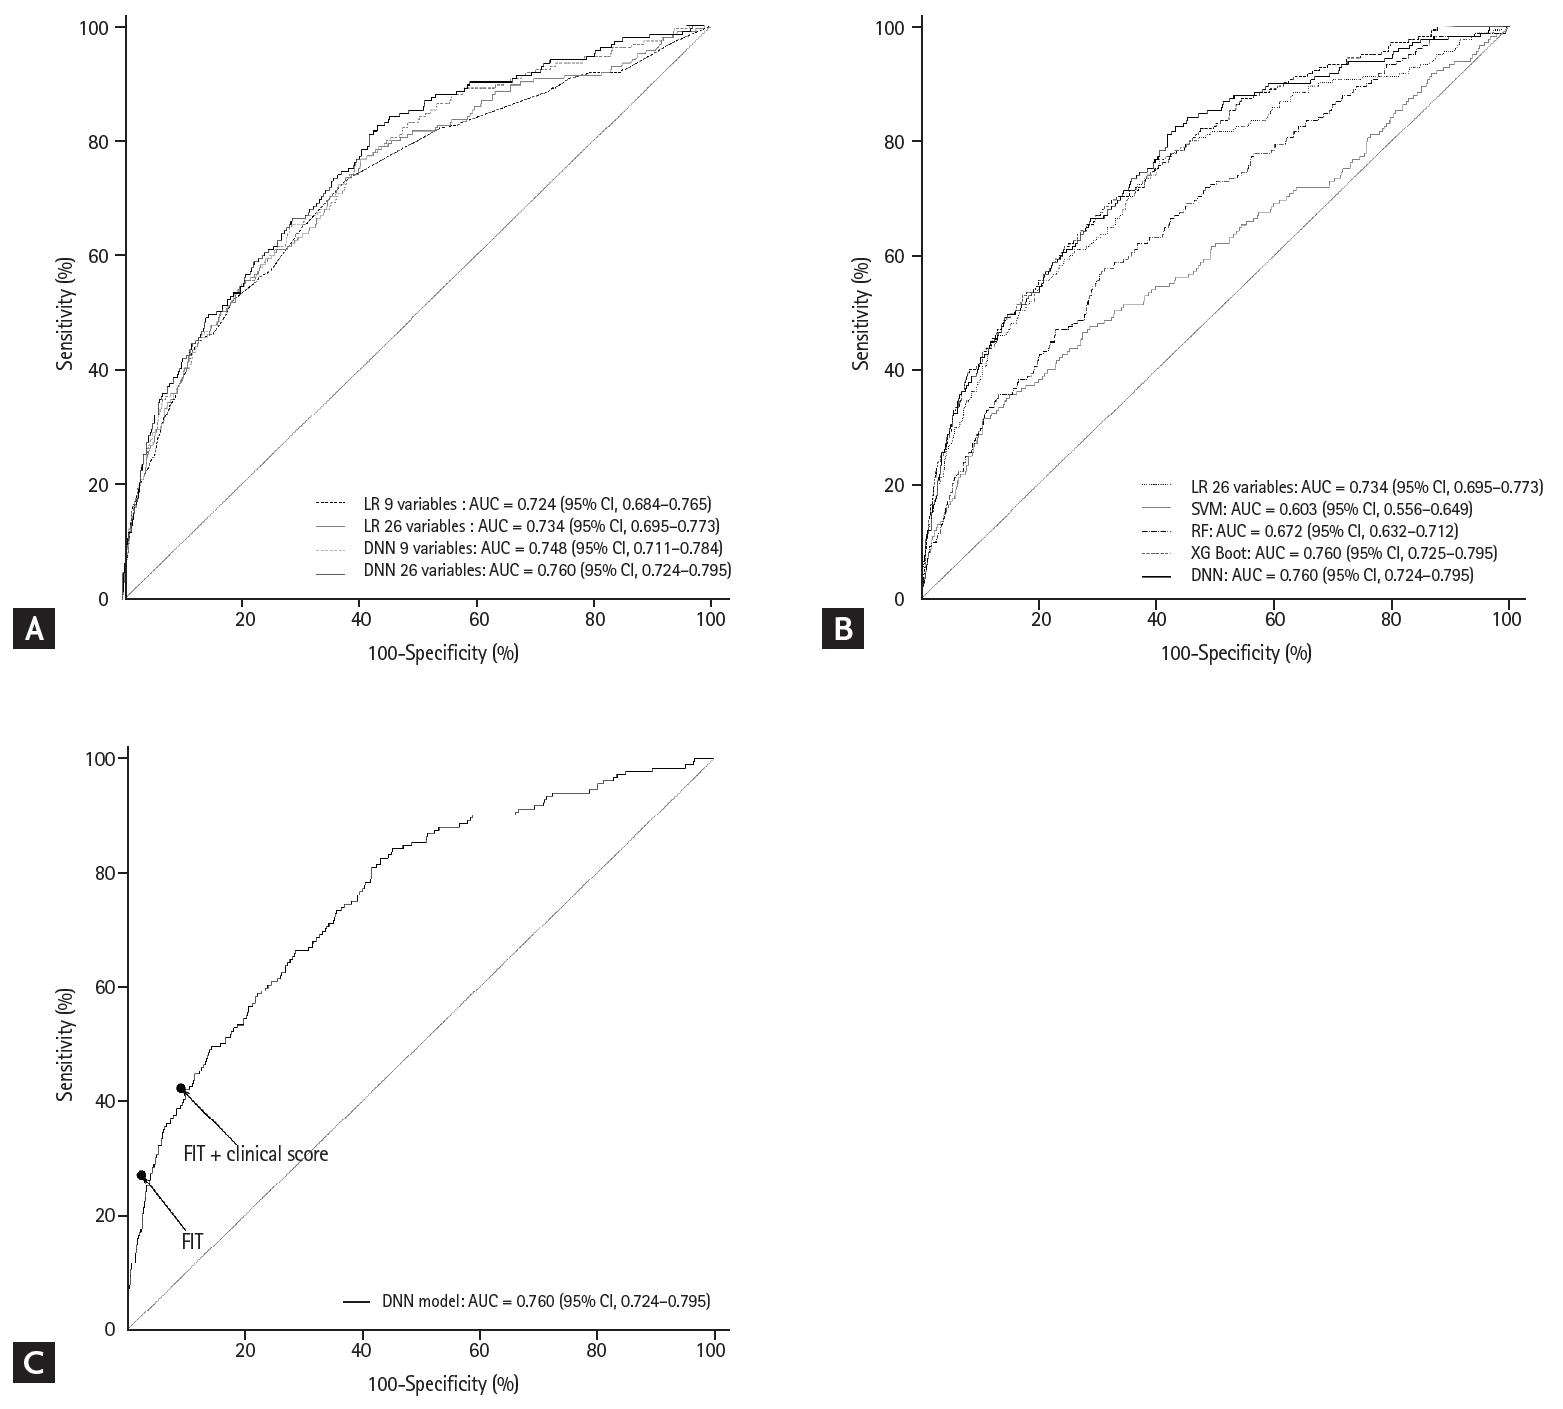
We further evaluated the prediction performance of the DNN model. First, we compared the LR and DNN models according to the number of variables (Fig. 3A). In comparison with the original LR model with nine variables (AUC, 0.724; 95% CI, 0.684 to 0.765), the LR model with 26 variables did not demonstrate any significant improvement in the performance (AUC, 0.734; 95% CI, 0.695 to 0.773). This value was lower than that for the DNN model with nine variables (AUC, 0.748; 95% CI, 0.711 to 0.784). Second, we compared SVM, RF, XGBoost, and DNN with the LR model with 26 variables for reference (Fig. 3B and Supplementary Table 3). In the validation group, only the DNN model exhibited a significantly better prediction performance than that of the LR model (p = 0.036). The SVM (AUC, 0.603; 95% CI, 0.556 to 0.649) and RF (AUC, 0.672; 95% CI, 0.632 to 0.712) exhibited a significantly lower prediction performance. The XGBoost exhibited a prediction performance as high (AUC, 0.760; 95% CI, 0.725 to 0.795) as that of the DNN model although it was not significantly better than that of the LR model (p = 0.064). Third, the performance of the DNN model was compared with that of FIT and the combined FIT and clinical score (Fig. 3C and Supplementary Table 4). The FIT results were available in 19.6% (2,751/14,067) of the validation group, and FIT was found to be positive in 2.9% (79/2,751). The sensitivity for ACRN was 27.3% and specificity was 97.4%. At the same sensitivity, the specificity of the DNN model was significantly lower at 90.5% (p < 0.001). The sensitivity of the combined FIT and clinical score was 42.4% and specificity was 90.7%. At the same sensitivity, the specificity of the DNN model was also significantly lower at 81.0% (p < 0.001).
Characteristics of the subjects with ACRNs detected by DNNs
At the target sensitivity of 90%, the actual number of subjects with ACRNs detected by the LR and DNN models were 165 and 166, respectively (Table 2). Most of them (n = 158) were detected using both the LR and DNN models. Meanwhile, seven subjects were detected using only the LR model, and eight using only the DNN model. To explore the additional features that could be captured by the DNN model, the three groups of subjects were compared based on their characteristics (Table 3). The participants with ACRNs who were predicted only by the DNN model were more likely to be women, had a lower BMI, higher serum levels of hsCRP, and lower levels of ferritin than those with ACRNs who were missed by the DNN model. When compared with those detected by both models, the subjects detected either by the LR or DNN model were younger and had lower serum levels of triglycerides.
DISCUSSION
In this study, using a dataset of more than 70,000 subjects involving 26 clinical parameters, the DNN model exhibited better performance in the prediction of ACRN in comparison with the conventional LR model. The value of AUC reached 0.76, which is higher than that of that of any other clinical prediction models or scores employed to predict ACRNs [5-10]. Importantly, this performance was achieved by the inclusion of 26 clinical and laboratory parameters, indicating the potential for the DNN to be expanded to include more data, even from other sources, such as transcriptomics and metabolomics information from blood, stool, tissue samples, or even imaging data. From the perspective of CRC screening, it was estimated that the use of our model could realize a reduction of 20% of the NNScope to detect the same number of ACRNs as the LR model.
The overall compliance of CRC screening remains suboptimal [4]. The improved awareness of personal risk of CRC may be helpful in increasing screening uptake [36]. However, previously reported clinical risk models did not demonstrate good discriminative power with maximum AUC or C-statistics Ōēż 0.72 [5-9], and neither did the LR model with laboratory parameters, which was used as a reference in the current study [10]. In this study, the LR model with 26 variables exhibited a slight nonsignificant improvement in the AUC in comparison with the LR model with nine variables, from 0.72 to 0.73. In LR methods, the additional inclusion of a large number of covariates may not lead to a substantial improvement in the model performance because of multiple collinearities or interactions [37]. However, the application of DNN significantly improved the AUC from 0.72 of the LR model to 0.76 for the DNN model. This implies that the interactions between the risk factors for ACRNs may be too complex and nonlinear to be reflected by the LR models, whereas DNNs may be able to capture the complex associations caused by the inclusion of large numbers of input parameters/nodes [11]. The DNN has a multilayer architecture of input, hidden, and output layers. Each node of a hidden layer is computed as a function, which is usually nonlinear, of input nodes or previous hidden nodes that have their own weights. During each training example, the network is trained by updating the weights of the nodes through the backpropagation process. This multilayered structure of nonlinear functions and fine-tuned weights is capable of learning more complicated data structures. This is particularly important in modern times because of the substantial increase in the amount of biomedical information [12]. Furthermore, unlike the LR methods, a DNN can include various types of data as inputs, such as imaging data, fecal microbiome data, and electronic health record data [12]. In summary, we presented an enhanced performance DNN prediction model for ACRN, which may be able to improve adherence to CRC screening, indicating the possibility for further improvement by utilizing large quantities and various types of biomedical information.
It was estimated that colonoscopy resources are not sufficient, and tend to be overused in CRC screening [38,39]. Efficient screening can be achieved if ACRNs can be predicted with high specificity at a point of high sensitivity, which is associated with a lower colonoscopy workload being required for screening. In our study, the DNN model improved specificity by Ōēź 80% of the sensitivity on the ROC curve. While ensuring that the number of ACRNs detected is not lesser than that detected by the LR model, the DNN model could reduce the NNScope by 20% in comparison with the LR model. Given the low marginal cost in the development of deep learning algorithms, our results imply that deep learning may promote a more efficient utilization of CRC screening resources without compromising health outcomes.
Our DNN model demonstrated significantly inferior specificity in comparison with FIT and the combined FIT and clinical score at the sensitivity points of 27% and 42%, respectively. However, FIT is limited by its low sensitivity unless the cut-off level is adjusted. In contrast, our model has the advantage of high specificity at the point of high sensitivity and the cut-off level can be chosen according to the available colonoscopy resources in individual societies.
Among the conventional machine learning methods, XGBoost exhibited a performance similar to that of the DNN model. XGBoost is an advanced implementation of the gradient boosting algorithm that is optimized for speed and performance [24]. Our results suggest that XGBoost could also potentially improve the prediction of ACRN in CRC screening. However, further study may be required to evaluate the role of XGBoost in the context of CRC screening, as this was not the focus of our study.
In this study, we observed several limitations of our deep learning model. First, although the DNN model detected more ACRNs than the LR model did, it is unknown as how the model actually functions. This blackbox issue is important in clinical interpretations in terms of specifying why a specific individual was categorized as having a high risk of ACRN [12]. To address this issue, we reverse-engineered the DNN model, wherein the subjects with ACRNs who were detected both by the DNN and LR models, only by the LR model, and only by the DNN model were compared based on their clinical characteristics. The results demonstrated that the three groups differed substantially with respect to age, sex, BMI, triglycerides, white blood cell count, and ferritin. This implies that the DNN may result in a more accurate prediction by reducing the impact of conventional risk factors, in particular, sex and BMI. Second, we adopted a complete case analysis using deep learning similar to the LR method. Thus, our model considered 26 parameters, including serum glucose, LDL-C, and CEA, which are not directly applicable to other current CRC screening programs because not all these data are usually available in asymptomatic adults. However, it is not cost-effective to conduct laboratory analyses only for CRC screening. In the present study, we did not evaluate the potential for predicting ACRN or the degree of accuracy when only some of the parameters are given. Moreover, although we suggested the possibility of including various types of data, such as fecal microbiome data, such data were not available in our database. Thus, we could not demonstrate the feasibility of a model with ŌĆśomicsŌĆÖ data. The answers to these questions are left to future research. Third, our model did not specify the time at which or the number of times that the prediction of ACRN could be applied. Theoretically, these models could be applied at a specific age, such as 40 or 50 years. Nevertheless, the age-specificity of these theoretical models need to be evaluated in further studies before their application to CRC screening in real practice.
In conclusion, the application of the DNN model to big clinical data significantly improved the prediction of ACRNs in comparison with the conventional LR model. This demonstrates the potential for realizing further performance improvements by utilizing large quantities and various types of biomedical information. This deep learning platform may accelerate the adoption of customized CRC screening based on the predicted risk of ACRN.
KEY MESSAGE
1. A deep learning model demonstrated better performance than a conventional logistic regression model in the prediction of advanced colorectal neoplasia, by utilizing big clinical data more efficiently.
2. With the application of the deep learning model, the colonoscopy workload required to detect the same number of advanced colorectal neoplasia could be reduced by 20%.
3. Deep learning offers the potential for further improvements by utilizing large quantities and various types of biomedical information.
 PDF Links
 PubReader
 ePub Link
 Full text via DOI
 Download Citation
 Supplement 1
 Print
Print


