 |
 |
| Korean J Intern Med > Volume 2(1); 1987 > Article |
|
Abstract
To elucidate the mechanism of glucose intolerance in patients with chronic liver disease(CLD), we measured the levels of plasma glucose, insulin and C-peptide during oral glucose tolerance test and urinary excretion of C-peptide per 24 hours during a weight maintenance diet in 20 patients with CLD who had fasting plasma glucose(FBS) of less than 100 mg/dl.
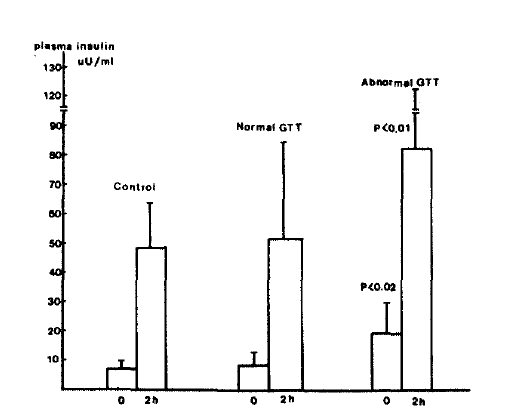
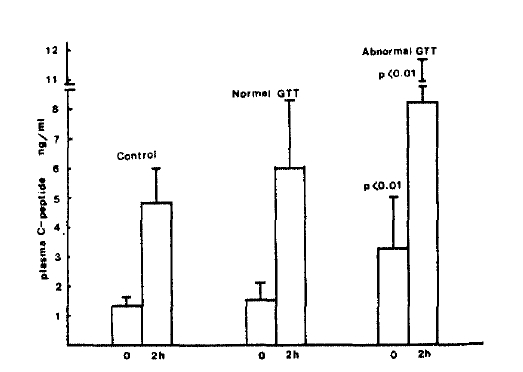
The patients with CLD who had normal FBS(FBS less than 100 mg/dl) were divided into two groups by the National Diabetes Data Group Criteria: one with abnormal glucose tolerance (abnormal GTT, Group 1) and the other with normal glucose tolerance (normal GTT. Group 2). Group 1 patients showed significantly higher plasma insulin (p<0.02 and p<0.01, respectively) and C-peptide concentrations (p<0.01) in the fasting state and 2 hours after a 75gram oral glucose loading (PP2) than group 2 patients. Urinary excretion of C-peptide per 24 hours was also higher in group 1 patients than in group 2 patients (p<0.01). Group 2 patients demonstrated similar plasma insulin, C-peptide and urinary excretion of C-peptide per 24 hours to normal subjects (p>0.05).
These results suggest that patients with CLD who had normal FBS can be divided into two groups by oral glucose tolerance test(GTT) and those with abnormal GTT have hyperinsulinemia the mechanism of which is insulin hypersecretion from pancreatic B-cell.
Because the liver is the principal organ involved in glucose metabolism, it is not surprising that glucose intolerance is often seen in patients with chronic liver diseass(CLD)1ŌĆō16,18ŌĆō21). Several factors may be responsible for an altered glucose metabolism in CLD. Among them fasting hyperinsulinemia has been described in patients with various liver deseases4ŌĆō6,20) although hypoinsulinemia has also been described in patients with chronic hepatitis7). Some investigators reported that fasting hyperinsulinemia is due to decreased hepatic degradation of insulin8ŌĆō10), while others reported that pancreatic insulin secretion is actually increased11ŌĆō15).
Few studies have so far dealt with patients with CLD from the view point of insulin ability and glucose tolerance. We previously reported that patients with CLD could be divided into two groups by fasting plasma glucose(FBS) i.e. one with normal FBS and an exaggerated insulin response to intravenous glucose and the other with a higher FBS and a blunted insulin response to intraveous glucose2,3). The present study was designed to further elucidate the mechanisms of glucose intolerance and hyperinsulinemia in the patients group with normal FBS by measuring plasma glucose, insulin and C-peptide during oral glucose tolerance test(OGTT). Also we measured urinary excretion of C-peptide per 24 hours during weight maintenance diet as an index of total daily insulin secretion16).
The studies were carried out in 20 patients with CLD and 14 healthy subjects. Fasting plasma glucose levels were less than 100 mg/dl in all subjects.
The patients group was composed of 16 men and 4 women (age distribution; 17ŌĆō67 years of age, mean 42, body mass index: 23┬▒5). The diagnosis of chronic liver disease was established by liver biopsy and/or laparoscopy in all patients. Sixteen patients had chronic active hepatitis and four had liver cirrhosis. They took no medication that might influence glucose tolerance and did not have recent gastrointestinal bleeding. They had no past history of diabetes mellitus before the onset of CLD, and serum urea nitrogen, creatinine and electrolytes were normal.
The control group was composed of 12 healthy men and 2 women(age distribution: 24ŌĆō51 years of age, mean 38, body mass index: 22 ┬▒ 3) with no evidence of hepatobiliary, renal and endocrine disturbance. None had a family history of diabetes mellitus.
Informed consents were obtained from all subjects of both groups (Table 1).
All of the subjects received weight maintenance diet containing at least 250 gram of carbohydrate daily for at least 2 days before testing. Studies were carried out following an overnight fast.
On day 1, urine samples were collected in plastic container coated with bovine serum albumin and refrigerated at ŌłÆ4┬░C during the collection period. Following the completion of collection, an aliquot of urine was frozen until assayed for C-peptide. During the collection period all subjects received weight maintenance diet.
On day 2, venous blood samples were taken prior to administration of 75 gram of oral glucose load, and at 60 min and 120 min post (PP1, and PP2).
Blood samples were collected in EDTA containing tubes, which were immediately centrifused and plasma was stored at ŌłÆ20┬░C until assayed.
Plasma insulin concentration was measured by radioimmunoassay using kits from Dainabot, Japan. Plasma and urinary C-peptied concentration was measured by enzymeimmunoassay kits from Daiichi, Japan.
On the basis of criteria set forth by the National Diabetes Data Group(NDDG)17), the patients with CLD who had normal FBS were divided into two groups; group 1 comprised of 12 patients with abnormal GTT and group 2 of 13 patients with normal GTT.
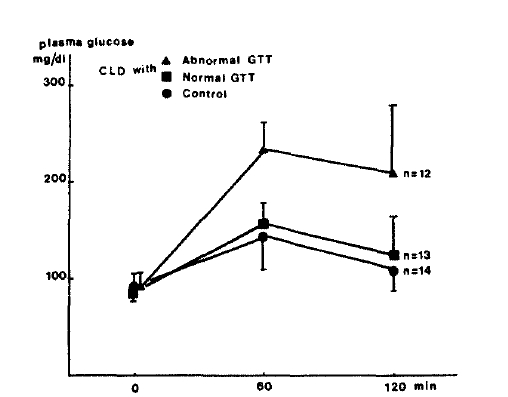
Although FBS levels of patients with CLD were not significantly different from values in normal subjects, PP2 plasma glucose levels were significantly higher in both groups of patients with CLD compared with normal subjects (160.7 + 66.3 vs 112.4 + 19.1 mg/dl, p<0.05). Plasma insulin levels before and 2 hours after oral glucose load were significantly higher in both groups of patients with CLD when compared with normal subjects (14.4 ┬▒ 10.4 vs 7.0 ┬▒ 1.2 uU/ml, p <0.05; 62.9 ┬▒ 36.1 vs 27.8 ┬▒ 1.5, p<0.05). Fasting plasma C-peptide and urinary excretion of C-peptide per 24 hours were also significantly higher in those patients as compared with normal subjects (2.19 ┬▒ 0.73 vs 1.34 ┬▒ 0.30 p<0.05; 77.5 ┬▒ 42.7 vs 46.2 ┬▒ 12.2 ug/gm creatinine, P<0.05). PP2 plasma C-peptide levels tended to be higher in CLD group but the statistical difference were not significant (5.33 + 1.25 vs 4.91 ┬▒ 1.11 ng/ml, p>0.05).
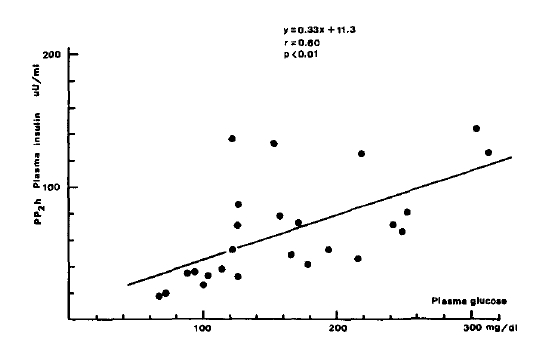
There was a significant linear correlationship between fasting insulin levels and PP2 glucose levels (r = 0.60, p<0.01, Fig. 1).
When the results of the two subgroups of patients with CLD were compared, PP2 C-peptide levels as well as fasting C-peptide, fasting and PP2 insulin, PP2 glucose, urinary excretion of C-peptide per 24 hours, were significantly higher in group 1 patients than in group 2 patients as shown in Table 2 (p<0.01, Fig. 2Ōł╝5).
The present study clearly demonstrated that there are two subgroups in patients with CLD who had normal FBS, one with normal glucose tolerance and normoinsulinemia and the other with abnormal glucose tolerance and hyperinsulinemia.
As we previously reported there are two subgroups of patients in CLD i.e. one with normal FBS and showing an exaggerated insulin response to intravenous glucose and the other with higher FBS and showing a blunted insulin response to intravenous glucose, the present data suggest that the patients with CLD is, from the viewpoint of glucose tolerance, heterogeneous group that can be divided into at least three subgroups; the first with high FBS and relative hypoinsulinemia, the second with normal FBS and hyperinsulinemia and the third with normal FBS and normoinsulinemia. The above classification could explain why, in our previous study, the patients with normal FBS showed an exaggerated acute insulin response to intravenous glucose load.
In contrast to our data, Riggio et al.18) reported that there was no significant difference in the fasting insulin level among the three groups of cirrhotic patient showing different glucose tolerance. Similarly Shankar et al.12) and Berkowitz et al.19) also showed similar plasma insulin and C-peptide levels among cirrhotic patients showing different glucose tolerance during OGTT. The discrepancy of these data and our data can be explained by the different criteria they used to classify their patients. Their classification was entirely based on NDDG criteria17) and therefore large numbers of our group 1 patients were included in the diabetic group. In addition, Shankar et al.12) and Berkowitz et al.19) examined a number of patients with impaired glucose tolerance too small to have statistical significance.
The presence of hyperinsulinemia with abnormal GTT as well as linear correlation between fasting plasma insulin and degree of glucose intolerance expressed by PP2 glucose in our group 1 patients strongly suggest insulin resistence in these patients. The location of insulin resistence in CLD could not be determimed exactly from this study.
Our data demonstated that fasting and PP2 plasma C-peptide and the urinary excretion of C-peptide are higher in hyperinsulinemic CLD than normal subjects. This suggested an absolute increase in pancreatic secretion of insulin in these patients and was consistent with several previous reports.11ŌĆō15,23) But Johnston et al.8) and Iwasaki et al.10) stated that the hyperinsulinemia in the cirrhotic patients could be explained by a decrease in hepatic degradation of insulin. This conclusion was based on the assumption that the plasma C-peptide/Insulin molar ratio reflects changes in hepatic insulin extraction.21) However, many additional factors other than the hepatic extraction of insulin constantly affect both plasma C-peptide and insulin levels and, thus, their peripheral molar ratio i.e. their different distribution kinetics (C-peptide: 2 compartment22), insulin: 3 compartment23) different half life (C-peptide: 30 min22), Insulin: 4 min24)), etc. Therefore, since the C-peptide/Insulin molar ratio is dependent upon the the secretion metabolism, distribution, half lives of C-peptide and insulin, studies that rely on this ratiuo alone to measure hepatic insulin metabolism should be viewed with caution25).
The above data suggest that in some patients with CLD who have normal FBS, insulin hypersecretion to compensate for postprandial hyperglycemia may be insufficient to normalize postprandial plasma glucose and such patients show hyperinsulinemia and abnormal glucose tolerance.
It is unclear why some patients with CLD show insulin resistence while others do not and what is the mechanism of insulin resistance. Further studies will be needbed to clarify these questions.
Fig.┬Ā1.
Correlation between plasma PP2 glucose and insulin concentrations in chronic liver disease.

Fig.┬Ā2.
Plasma glucose profiles during oral GTT in patients with chronic liver disease and controls.

Fig.┬Ā3.
Plasma insulin concentrations during oral GTT in patients with chronic liver disease and controls.

Fig.┬Ā4.
Plasma C-peptide levels during oral GTT in patients with chronic liver disease and controls.

Fig.┬Ā5.
Urinary excretion of C-peptide per 24hours in patients with chronic liver disease and controls.

Table┬Ā1.
Characteristics of Subjects
| Age (yrs) | Sex (M : F) | Body mass index* | |
|---|---|---|---|
| Chronic liver disease (n=20) | 42 ┬▒ 19 | 16 : 4 | 23 ┬▒ 5 |
| Controls (n=14) | 38 ┬▒ 8 | 12 : 2 | 22 ┬▒ 3 |
Table┬Ā2.
Plasma Insulin, C-peptide and Urinary Excretion of C-peptide per 24 hours in Controls and Patients with Chronic Liver Disease
|
Insulin (uU/ml)
|
C-peptide (ng/ml)
|
24hr urine C-peptide (ug/gm Cr.) | Fasting glucose (mg/dl) | PP2 glucose (mg/dl) | |||
|---|---|---|---|---|---|---|---|
| Fasting | PP2 | Fasting | PP2 | ||||
| Controls | 7.0 ┬▒ 1.2 | 27.8 ┬▒1.5 | 1.34 ┬▒ 0.3 | 4.91 ┬▒ 1.11 | 46.2 ┬▒ 12.2 | 90.5 ┬▒ 9.8 | 112.4 ┬▒ 19.1 |
| Chronic liver disease with normal GTT | 8.1 ┬▒ 2.4 | 33.7 ┬▒ 5.3 | 1.42 ┬▒ 0.55 | 5.90 ┬▒ 2.12 | 47.3 ┬▒ 21.3 | 90.2 ┬▒ 8.8 | 121.3 ┬▒ 10.2 |
| Chronic liver disease with abnormal GTT | 17.3 ┬▒ 4.0* | 103.4 ┬▒ 23.4** | 3.34 ┬▒ 1.53** | 8.31 ┬▒ 3.40** | 88.9 ┬▒ 42.3** | 89.0 ┬▒ 5.8 | 205.5 ┬▒ 20.4 |
REFERENCES
1. Wright R, Millward-Sakler GH, Alberti KGMM. Karans. Liver and Biliary disease. 2nd ed. 161. Bailliere Tindall, 1985.
2. Yoon KW, Woo EJ, Min BG, Rhee BD, Kim SY, Lee HK, Kim CY, Min HK. A study on the mechanism of glucose intolerance in chronic liver disease Analysis of hepatic glucose balance by a computer simulation method during an intravenous glucose tolerance test. The Journal of the Korean Diabetes Association 10:41. 1986.
3. Lee KU, Lee HK. Glucose intolerance in chronic liver disease. Medical Postgraduate 13:20. 1985.
4. Creutzfeldt W, Frerichs H, Sickinger K. Progress in Liver disease. 3rd ed. 380. New York: Grune and stratton, 1978.
5. Conn HO, Daughaday WH. Cirrhosis and diabetes V. serum growth hormone levels in LaenecŌĆÖs cirrhosis. J Lab Clin Med 76:678. 1970.

6. Felig P, Brown WV, Levin RA, Klatskin G. Glucose homeostasis in viral hepatitis. N Engl J Med 283:1436. 1970.


7. Alberti KGMM, Record CO, Williams DG, Wright R. Metabolic changes in active chronic hepatitis. Clin Science 42:591. 1972.

8. Johston DG, Alberti KGMM, Farber LK, Binder C, Wright R. Hyperinsulinism of hepatic cirrhosis: Diminished degradation of hypersecretion? Lancet 1:10. 1977.


9. Kawai K, Hayakawa H, Yoshida K. Plasma insulin and C-peptide levels in cirrhotic and uremic patients. Diabetes et Metabolism 3:7. 1977.
10. Iwasaki Y, Ohokubo A, Kajinuma H, Akanuma Y, Kosaka K. Degradation and secretion of insulin in hepatic cirrhosis. J Clin Endocrinol Metab 47:774. 1978.


11. Proietto J, Dudely FJ, Aitken P, Alford FP. Hyperinsulinemia and insulin resistance of cirrhosis-The importence of insulin hypersecretion. Clin Endocrinol 21:657. 1984.

12. Shankar TP, Solomon SS, Duckworth WC, Himmelstein S, Gray S, Jerkins T, Bobal MA, Iyer RS. Studies of glucose intolerance in cirrhosis of the liver. J Lab Clin Med 102:459. 1983.

13. Collins JR, Lacy WW, Stiel JN, Crofford OB. Glucose intolerance and insulin resistance in patients with liver disease. Arch Intern Med 126:608. 1970.


14. Sonken PH, Jones RH, Tompkins CV. The metabolism of insulin in vivo. Excerpta Medica International Congress Series 413:204. 1976.
15. Andersen BN, Hagen C, Faber OK, Lindholm J, Boisen P, Worning H. Glucose tolerance and B cell function in chronic alcoholism: Its relation to hepatic histology and exocrine pancreatic function. Metabolism 32:1029. 1983.


16. Meistas MT, Zadik Z, Margolis S, Kowarskin A. Correlation of urinary excretion of C-peptide with the integrated concentration and secretion rate of insulin. Diabetes 30:639. 1981.


17. National Diabetes Data Group. Classification and diagnosis of Diabetes Mellitus and other categories of glucose intolerance. Diabetes 28:1039. 1979.


19. Berkowitz D. Glucose tolerance, free fatty acid, and serum insulin responses in patients with cirrhosis. Am J Dig Ds 14:691. 1969.

20. Chupin M, Charbonnel B, Bodic L, Grolleau JY, Chupin F, Giullon J. Glucose tolerance in viral hepatitis. Diabetes 27:661. 1978.


21. Park WK, Yang IM, Yoo MH, Kim JW, Kim KW, Kim YS, Kim SW, Min YI, Choi YK. Studies of pathogenesis of glucose intolerance in liver disease. The Korean Journal of Int Med 27:1008. 1986.
22. Faber LK, Hagen C, Binder C, Markussen J, Naitharu VK, Blix PM, Kuzuya H, Horwitz PL, Rubenstein AH, Rossing N. Kinetics of human connecting peptide in normal and diabetic subjects. J Clin Invest 62:197. 1978.


23. Sherwin RS, Kramer KJ, Tobin JD, Insel PA, Liljenquest JE, Berman M, Andres R. A model of kinetics of insulin in man. J Clin Invest 53:1481. 1974.


24. Sonksen PH, Tompkins CV, Srivastava MC, Nabarro JDM. A comparative study on the metabolism of human insulin and porcine proinsulin in man. Clin Sci Mol Med 45:633. 1973.


25. Polonsky DS, Rubenstein AH. C-peptide as a measure of the secretion and hepatic extraction of insulin-Pitfalls and limitations. Diabetes 33:486. 1984.


-
METRICS

-
- 0 Crossref
- 0 Scopus
- 9,507 View
- 54 Download
- Related articles
-
Nutritional management in patients with chronic kidney disease2020 November;35(6)
Analyses of RBC Insulin Receptor Bindings in Chronic Liver Disease1986 July;1(2)


 PDF Links
 PubReader
 ePub Link
 Full text via DOI
 Download Citation
 Print
Print


