Effect of Helicobacter pylori treatment on the long-term mortality in patients with type 2 diabetes
Article information
Abstract
Background/Aims
Meta-analyses of randomized trials reported a non-significant increase in overall mortality risk after Helicobacter pylori eradication. In this study, we investigated whether H. pylori treatment is associated with increased risk of overall mortality in patients with type 2 diabetes.
Methods
In this retrospective population-based cohort study, we identified 66,706 patients treated for type 2 diabetes between 2002 and 2010 from the Korean National Health Insurance Service-National Sample Cohort. Patients who received H. pylori treatment (Hp-treatment cohort, 1,727 patients) were matched to those who did not (non-treatment cohort, 3,454 patients) at a 1:2 ratio. The primary outcome was overall mortality. The secondary outcomes were mortalities due to cardiovascular disease, cerebrovascular disease, or cancers. To estimate hazard ratio (HR) with confidential interval (CI), we used the Cox proportional-hazard model.
Results
During a median follow-up of 4.7 years, the overall mortality was 5.9% (101/1,727 patients) among patients in the Hp-treatment cohort and 7.6% (364/3,454 patients) among patients in the non-treatment cohort. Adjusted HR (aHR) for overall mortality in the Hp-treatment cohort was 0.74 (95% CI, 0.59 to 0.93; p = 0.011). The mortality risks due to cardiovascular disease (aHR, 1.34; 95% CI, 0.54 to 3.30; p = 0.529), cerebrovascular disease (aHR, 0.97; 95% CI, 0.37 to 2.55; p = 0.947), and cancer (aHR, 1.08; 95% CI, 0.68 to 1.72; p = 0.742) were not significantly different between the groups.
Conclusions
In type 2 diabetes patients, overall mortality did not increase after H. pylori treatment.
INTRODUCTION
A meta-analysis of randomized controlled trials (RCTs) conducted in asymptomatic general population reported 34% reduction in gastric cancer incidence after Helicobacter pylori eradication [1]. Gastric cancer mortality risk also decreased by 33%, but a non-significant 9% increase in the overall mortality risk was found after H. pylori eradication [1]. A RCT in high-risk patients who underwent endoscopic resection for early gastric cancer reported a non-significant increased overall mortality risk among patients included in the H. pylori treatment group (hazard ratio [HR], 1.95; p = 0.19) despite a significant reduction of metachronous gastric cancer risk [2]. A more recent meta-analysis also demonstrated a non-significant risk increase in overall mortality with H. pylori treatment (risk ratio, 1.12; 95% confidence interval [CI], 0.93 to 1.34) [3]. These data suggest a potential harmful effect of H. pylori treatment in terms of increased non-gastric cancer mortality. However, the true nature of this observation and the plausible underlying mechanisms remain unclear.
Globally, the leading causes of death include ischemic heart disease and stroke and cancer [4–6]. A significant association between increased cardiovascular disease mortality and clarithromycin, which is a commonly used antibiotic for H. pylori eradication, has been suggested [7–9]. Thus, we hypothesized that H. pylori treatment might be associated with increased risk of mortality due to these major causes of death which might over-compensate the decrease of gastric cancer mortality. Type 2 diabetes is an important risk factor for cardiovascular disease, cerebrovascular disease, and cancers [10,11]. In this retrospective cohort study, we investigated whether H. pylori treatment is associated with overall mortality increase or with mortality increase from the main causes in patients with type 2 diabetes.
METHODS
Data source
This study used the Korean National Health Insurance Service-National Sample Cohort (NHIS-NSC) database from 2002 to 2013 [12]. Using probability sampling, a representative sample cohort of approximately one million subjects (2.2% of the total eligible population) was extracted from all beneficiaries of the National Health insurance and National Medical Aid in 2002 depending on the entire national cohort information. The cohort follow-up was for 11 years until 2013 [12]. In this cohort, we used disease codes of the International Classification of Diseases, 10th Revision (ICD-10) to identify the disease diagnosis and the cause of death [13]. The database has been validated in several studies performed in Korea [14–16].
Study design and population
Our study design is a population-based retrospective cohort study. The Institutional Review Board of the National Cancer Center approved this study (NCC2016-0043). Requirement for informed consent from each individual was waived.
Detailed patient selection methods have been described in our previous study evaluating the association between overall mortality and H. pylori treatment in hypertension patients [16]. Using the disease codes for type 2 diabetes (ICD-10 code, E11 to E14), type 2 diabetes patients aged 20 years or older were selected between 2002 and 2010. Patients who had been prescribed one or more anti-diabetic drugs were finally included in the analyses.
Patients who received H. pylori eradication treatment after the diagnosis of type 2 diabetes until June 2013 were included in the H. pylori treatment cohort. The prescription of H. pylori eradication medication was examined using drug codes for standard triple therapy (proton-pump inhibitor [PPI], amoxicillin, and clarithromycin for 7 to 14 days) or bismuth quadruple therapy (PPIs, bismuth, tetracycline, and metronidazole for 7 to 14 days), which were approved for the first-line and the second-line treatment in Korea [17]. Each patient in the H. pylori treatment cohort was matched with those in the non-treatment cohort at an 1:2 ratio by using a simple random sampling method without replacement. Variables for matching included age group, sex, date of type 2 diabetes diagnosis, and Charlson comorbidity index (CCI) score [18].
The observation periods for study outcomes started on the prescription date for H. pylori therapy in the treatment cohort and the corresponding date in matched control patients in the non-treatment cohort. The observation periods ended on December 31st, 2013 (Supplementary Fig. 1). Patients who died due to any causes or those who were diagnosed with cancers, cardiovascular diseases, or cerebrovascular diseases before or within the 6 months after the initiation of the observation periods were excluded.
Study outcomes
The primary outcome was overall (all-cause) mortality, and the secondary outcomes included cardiovascular disease mortality, cerebrovascular mortality, and overall cancer mortality occurring at least 6 months after the start of the observation period. The specific ICD-10 code for cancers (C00 to 97), cardiovascular diseases (I20 to I25), and cerebrovascular diseases (I60 to I66) are provided in Supplementary Table 1.
Statistical analysis
Student t test and chi-square test were used for descriptive analyses to compare baseline characteristics between groups. Overall mortality was compared using the Kaplan-Meier curves with log-rank test. We used univariate and multivariate Cox proportional hazard regression models to estimate HR with 95% CI for mortalities and incidences of cancers, cardiovascular, and cerebrovascular diseases according to the H. pylori treatment.
Age, sex, socioeconomic status, CCI scores, and the use of aspirin and metformin were included as the covariates for the multivariate analysis. Statistical analyses were conducted using SAS version 9.4 (SAS Institute, Cary, NC, USA), and p values less than 0.05 were considered statistically significant.
RESULTS
Baseline characteristics of the study population
A total of 66,706 type 2 diabetes patients aged ≥ 20 years were prescribed at least one anti-diabetic medication between 2002 and 2010. A total of 3,059 patients received prescription for H. pylori treatment from the date of diagnosis for type 2 diabetes to June 30, 2013. Among them, 1,251 patients who died from any causes or were diagnosed with cancer, cardiovascular, or cerebrovascular diseases within 6 months before or after H. pylori treatment were excluded. Finally, a total of 1,727 patients in the H. pylori treatment cohort and 3,454 matched patients in the non-treatment cohort were selected for the analysis (Fig. 1).

Study flow. A total of 1,727 patients in the Helicobacter pylori treatment cohort were matched with 3,454 patients in the non-treatment cohort at a 1:2 ratio by using simple random sampling without replacement.
Patients in the H. pylori treatment cohort had a higher proportion of patients with household income level > 50% (62.3% vs. 57.3%, p = 0.001) and metformin users (83.0% vs. 80.1%, p = 0.011) compared to the non-treatment cohort. Other baseline characteristics were not significantly different between the two cohorts. The standard triple therapy regimen was prescribed in 98.4% of patients in the H. pylori treatment cohort (Table 1).

Baseline characteristics of the study population
Risk factors for overall mortality after H. pylori treatment
During the observation periods until December 2013 (median, 4.7 years; interquartile range, 2.5 to 7.3), death occurred in 364 (7.0%) patients; 101 (5.9%) patients in the H. pylori treatment cohort and 263 (7.6%) in the non-treatment cohort. The H. pylori treatment cohort had a significantly higher overall survival rate compared to the non-treatment cohort (5-year overall survival rates, 95.4% vs. 92.6%, respectively; p = 0.015 by the log-rank test) (Fig. 2). In a multivariate Cox-proportional hazard regression analysis, H. pylori treatment cohort had a significantly reduced risk for overall mortality with an adjusted HR (aHR) of 0.74 (95% CI, 0.59 to 0.93; p = 0.011) (Table 2). Other significant risk factors associated with increased overall mortality were age ≥ 60 years, male sex, household income level lower than 50%, CCI score ≥ 2 (vs. CCI score 0). Aspirin use (aHR, 0.76; 95% CI, 0.58 to 0.99; p = 0.039) and metformin use (aHR, 0.56; 95% CI, 0.44 to 0.71; p < 0.001) were associated with decreased overall mortality.
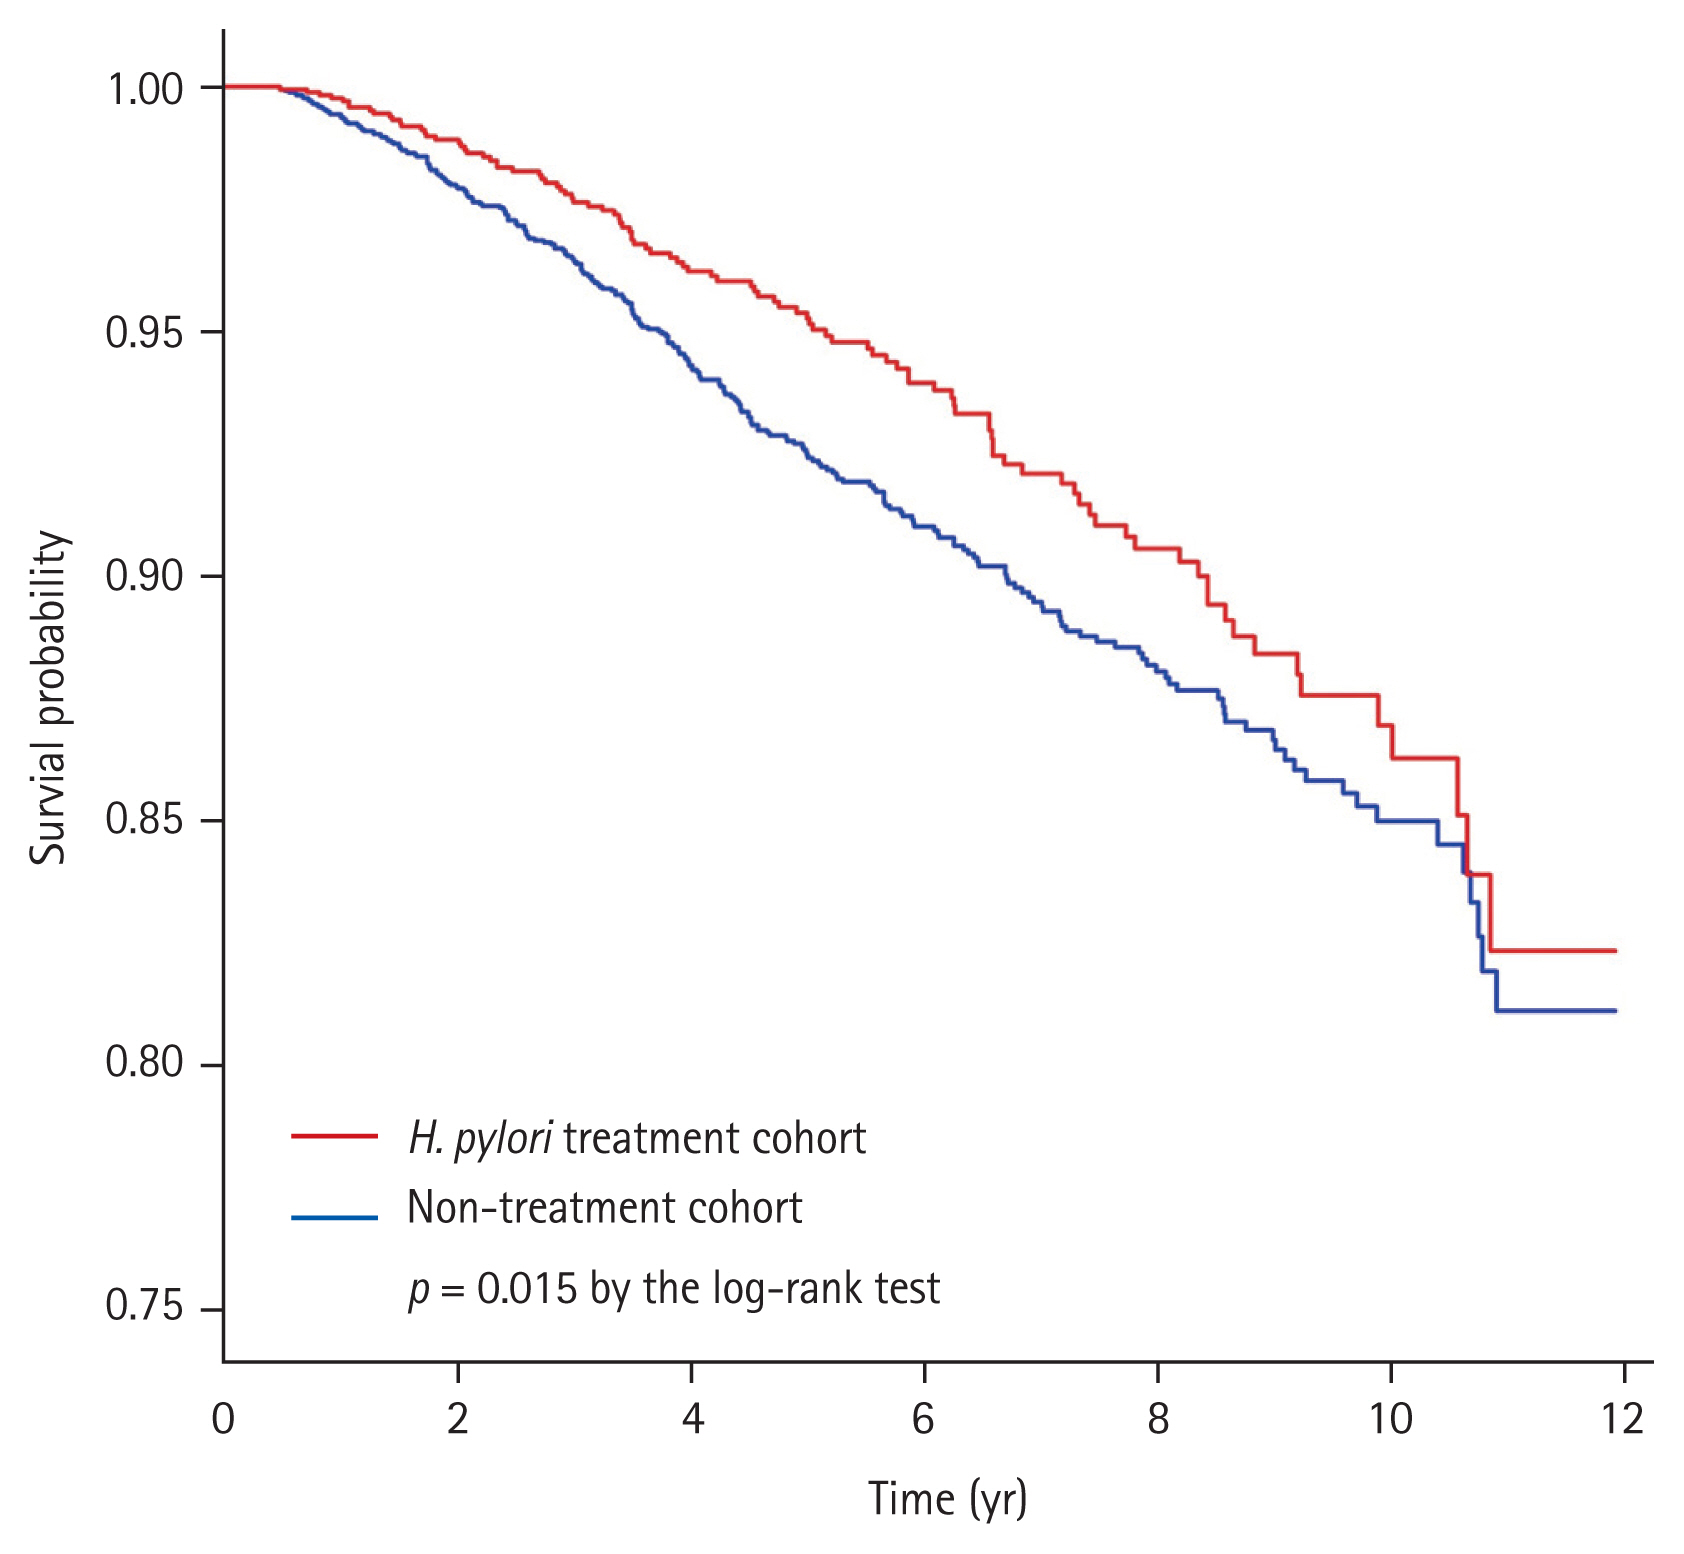
Kaplan-Meier curves for overall survival according to the Helicobacter pylori treatment. During a median follow-up of 4.7 years, death of any cause was reported in 5.9% of patients in the H. pylori treatment cohort and 7.6% of patients in the non-treatment cohort. The H. pylori treatment cohort had a significantly higher overall survival rate as compared with the non-treatment cohort (p = 0.015 by the log-rank test).
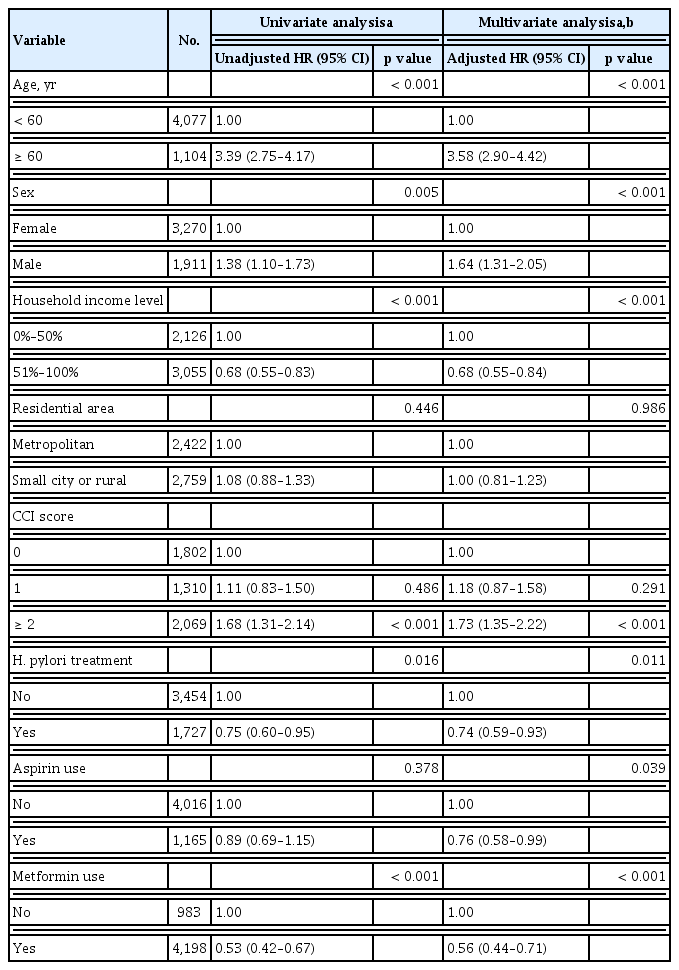
Risk factors associated with overall mortality
Risk of cardiovascular disease, cerebrovascular disease, and overall cancer incidence according to H. pylori treatment
No significant differences were found in cardiovascular and cerebrovascular disease incidences between H. pylori treatment cohort and non-treatment cohort. H. pylori treatment cohort had increased risk for overall cancer incidence (aHR, 1.28; 95% CI, 1.03 to 1.58; p = 0.024) compared with the non-treatment cohort. According to cancer type, the H. pylori treatment cohort showed significant incidence increase in colorectal cancer (aHR, 2.25; 95% CI, 1.25 to 4.04; p = 0.007) and thyroid cancer (aHR, 1.54; 95% CI, 1.02 to 2.31; p = 0.039) (Table 3).

Risk of incidence of cardiovascular diseases, cerebrovascular diseases, and cancer according to H. pylori treatment
Mortality risk due to cardiovascular disease, cerebrovascular disease, and overall cancers according to H. pylori treatment
Mortality risks due to common cause of death including cardiovascular disease, cerebrovascular disease and cancers are described in Table 4. Mortality risks due to cardiovascular disease (aHR, 1.34; 95% CI, 0.54 to 3.30; p = 0.529), cerebrovascular disease (aHR, 0.97; 95% CI, 0.37 to 2.55; p = 0.947), and overall cancers (aHR, 1.08; 95% CI, 0.68 to 1.72; p = 0.742) were not significantly different between the H. pylori treatment and non-treatment cohorts. No significant associations between H. pylori treatment and mortality risks for gastric cancer (aHR, 1.75; 95% CI, 0.46 to 6.60; p = 0.411) as well as other cancer types were found (Table 4).

Risk of cause-specific mortality according to H. pylori treatment
DISCUSSION
In this retrospective cohort study, we investigated overall mortality risk according to H. pylori treatment as the primary outcome, and evaluated cause-specific mortality risks due to major causes of death in patients with type 2 diabetes. H. pylori treatment was associated with a significant decrease in the risk of overall mortality. However, H. pylori treatment was not associated with mortality risks due to cardiovascular disease, cerebrovascular disease, and overall cancers.
In the report of global cancer statistics 2018 (GLOBOCAN 2018), gastric cancer was the fifth most common cancer, and the third leading cause of cancer death worldwide [19]. H. pylori was classified as a group 1 carcinogen for gastric cancer by the International Agency for Research on Cancer [20]. More than 50% of the world’s population (approximately 4.4 billion individuals) was infected with H. pylori in 2015 [21]. In Korea, gastric cancer was the most commonly diagnosed cancer in 2015 [22], and the estimated prevalence of H. pylori infection is about 54% [21]. However, H. pylori treatment as a primary prevention strategy for gastric cancer has not yet been implemented. Meta-analysis of RCTs showed 9% to 12% non-significant increase of overall mortality [1,3]. Of the two largest RCTs included in those meta-analyses, Wong et al. [23] reported no increase in overall mortality risk (relative risk, 0.95; 95% CI, 0.53 to 1.69), whereas Ma et al. [24] showed 10% non-significant increase of overall mortality risk (relative risk, 1.10; 95% CI 0.89 to 1.36). However, overall mortality was evaluated as a secondary outcome in the previous trials and no primary outcome study has been performed [1,23,24]. Therefore, we evaluated the overall mortality after H. pylori treatment as the primary study outcome in type 2 diabetes patients selected from the national cohort database who had increased cardiovascular or cerebrovascular disease risks. This database provides reliable data for mortality including exact date and cause of death. Overall mortality risk did not increase after H. pylori treatment, and this result is similar to that of our previous study evaluating the association between overall mortality and H. pylori treatment in a hypertension patient cohort [16]. These results might be an evidence for supporting the use of H. pylori treatment as a primary prevention strategy for gastric cancer.
In the present study, most of the patients (98.4%) in the H. pylori treatment cohort received clarithromycin-containing standard triple therapy. A clinical trial reported that clarithromycin use for 2 weeks in stable coronary artery disease increased cardiovascular mortality and overall mortality risk during 10-year follow-up period, although the exact underlying mechanism is unknown [7,25,26]. In addition, clarithromycin use was associated with increased risk of cardiovascular mortality during short-term periods, especially because of arrhythmia-related cardiovascular events [9,27]. Meanwhile, retrospective studies evaluating the association between mortality and clarithromycin use for H. pylori treatment have reported inconsistent results [28–30]. A retrospective study demonstrated that overall mortality risk after clarithromycin-containing H. pylori treatment significantly increased during a median follow-up of 3 years (aHR, 1.09; 95% CI, 1.00 to 1.18) [28], whereas two studies did not show any increased risk in long-term overall mortality [29,30]. Previous studies included high-risk patients diagnosed with cardiovascular diseases (arrhythmia, ischemic heart disease, or heart failure) who might develop short-term adverse events or mortality associated with clarithromycin use [28–30]. We excluded patients with cardiovascular or cerebrovascular diseases before or within 6 months after H. pylori treatment to avoid the short-term cardiovascular effects of clarithromycin use. In our study, the long-term cardiovascular mortality was not significantly associated with H. pylori treatment, although almost all patients (98.4%) received a clarithromycin-containing standard triple regimen.
Our study showed that H. pylori treatment was associated with increased risk in overall cancer incidence but reduced risk in overall cancer mortality. Previous studies reported that antibiotics use was associated with increased overall cancer risks [31], and the risk of various cancers including lung, colon, prostate, and breast cancer [31,32]. One of the suggested mechanisms for increased cancer risks is disrupted gut microbiota (dysbiosis) by antibiotics use. Dysbiosis might have negative effects on the process of carcinogenesis including initiation, progression, and dissemination of cancer or cancer treatment efficacy [33,34]. However, in our study, significant increased risks were found only in colorectal cancer and thyroid cancer. In contrast, the colorectal cancer mortality risk did not increase, and no thyroid cancer mortality was observed. In Korea, colorectal cancer incidence also increased after the introduction of colorectal cancer screening program in 2004 with decreased trends of colorectal cancer mortality [22,35]. In addition, opportunistic thyroid cancer screening was associated with increased thyroid cancer incidence without a concomitant increase in thyroid cancer-related mortality [36]. Thus, increased overall cancer incidence risk in the H. pylori treatment cohort seemed to be associated with increased cancer screening. Another explanation for the increased risk of overall cancer incidence in the treatment cohort might be associated with higher economic status. Because the treatment cohort had a higher proportion of patients with household income level of > 50% than the non-treatment cohort, patients in the treatment cohort might have accessed more health-care services, including opportunistic health screening programs. Further prospective studies are needed to investigate whether short duration of antibiotics use for H. pylori treatment (7 to 14 days) is associated with increased cancer risks due to dysbiosis.
Despite increased risks of cardiovascular disease and cancers in the H. pylori treatment cohort, no increase in overall mortality risk and cause-specific mortality risks due to cardiovascular disease and cancers were observed. In addition to the H. pylori treatment, the use of metformin (aHR, 0.56; p < 0.001) and aspirin (aHR, 0.76; p = 0.039) were significant factors associated with reduced overall mortality risk. These results might be explained by the healthy user bias, that is, health-seeking patients tend to initiate preventive therapies and try to engage in healthy lifestyle behaviors, and metformin users are more likely to be engaged in healthy behaviors [37]. In the present study, healthy user bias might be present, and the treatment cohort had higher proportions of better household income levels, and metformin users.
Our study findings should be interpreted in light of several limitations. First, our study population was type 2 diabetes patients, and the severity of diabetes might have been different between the H. pylori treatment cohort and non-treatment cohort. The severity of diabetes could not be assessed because the NHIS-NSC database did not provide any laboratory data such as glycated hemoglobin or blood glucose level. Second, the severity and treatment results of cardiovascular disease, cerebrovascular disease, or cancers might affect overall or disease-specific mortality. However, we could not assess the information due to the limitation of the NHIS-NSC database. Third, compliance for the H. pylori treatment and H. pylori eradication status after the treatment were not available from the database. Thus, we could not analyze whether H. pylori eradication status after treatment affected overall mortality or not. Third, in the non-treatment cohort, both H. pylori infected patients who were not treated and those who were not infected were included. Finally, although we included aspirin and metformin use as the covariate to evaluate risks of incidence and mortality from cardiovascular disease, cerebrovascular disease, and cancers, several factors were not considered in our analyses such as the type of intervention treatment or other drugs including anti-platelet agents or statins.
In conclusion, H. pylori treatment in patients with type 2 diabetes was not significantly associated with increased overall mortality. Among the major causes of death, no significant increase in the risk of mortality due to cardiovascular disease, cerebrovascular diseases, or overall cancers were observed. However, long-term prospective trials are necessary to confirm our findings and to apply H. pylori eradication as a primary gastric cancer prevention strategy in the general population without concern of overall mortality increase.
KEY MESSAGE
In this population-based retrospective cohort study using the Korean National Health Insurance Service-National Sample Cohort database, long-term overall mortality risk was not increased after Helicobacter pylori treatment in patients with type 2 diabetes.
In addition, H. pylori treatment was not associated with mortality risk increase due to cardiovascular disease, cerebrovascular disease, and all cancers.
However, further long-term prospective trials are necessary to confirm our findings and to apply H. pylori eradication as a primary gastric cancer prevention strategy in the general population without concern of overall mortality increase.
Supplementary Materials
The observation periods for study outcome evaluation. The initiation dates of observation period were Helicobacter pylori treatment prescription date in the treatment cohort and the corresponding date of H. pylori treatment prescription in matched patients of the non-treatment cohort. Outcome assessments were continued until December 2013.
Acknowledgments
This study used the Korean National Health Insurance Service-National Sample Cohort database (NHIS-2016-2-191) provided by the National Health Insurance Service. This study was supported by a grant from the Korea Health Technology R&D Project through the Korea Health Industry Development Institute (KHIDI), funded by the Ministry of Health and Welfare, Republic of Korea (grant number HC15C1077) and partially supported by the grant from the National Cancer Center, Republic of Korea (grant number 1910370).
Notes
Conflict of interest
No potential conflict of interest relevant to this article was reported.