Opposing associations of muscle and fat mass changes on serum uric acid levels: a 2-year longitudinal cohort study
Article information

Abstract
Background/Aims
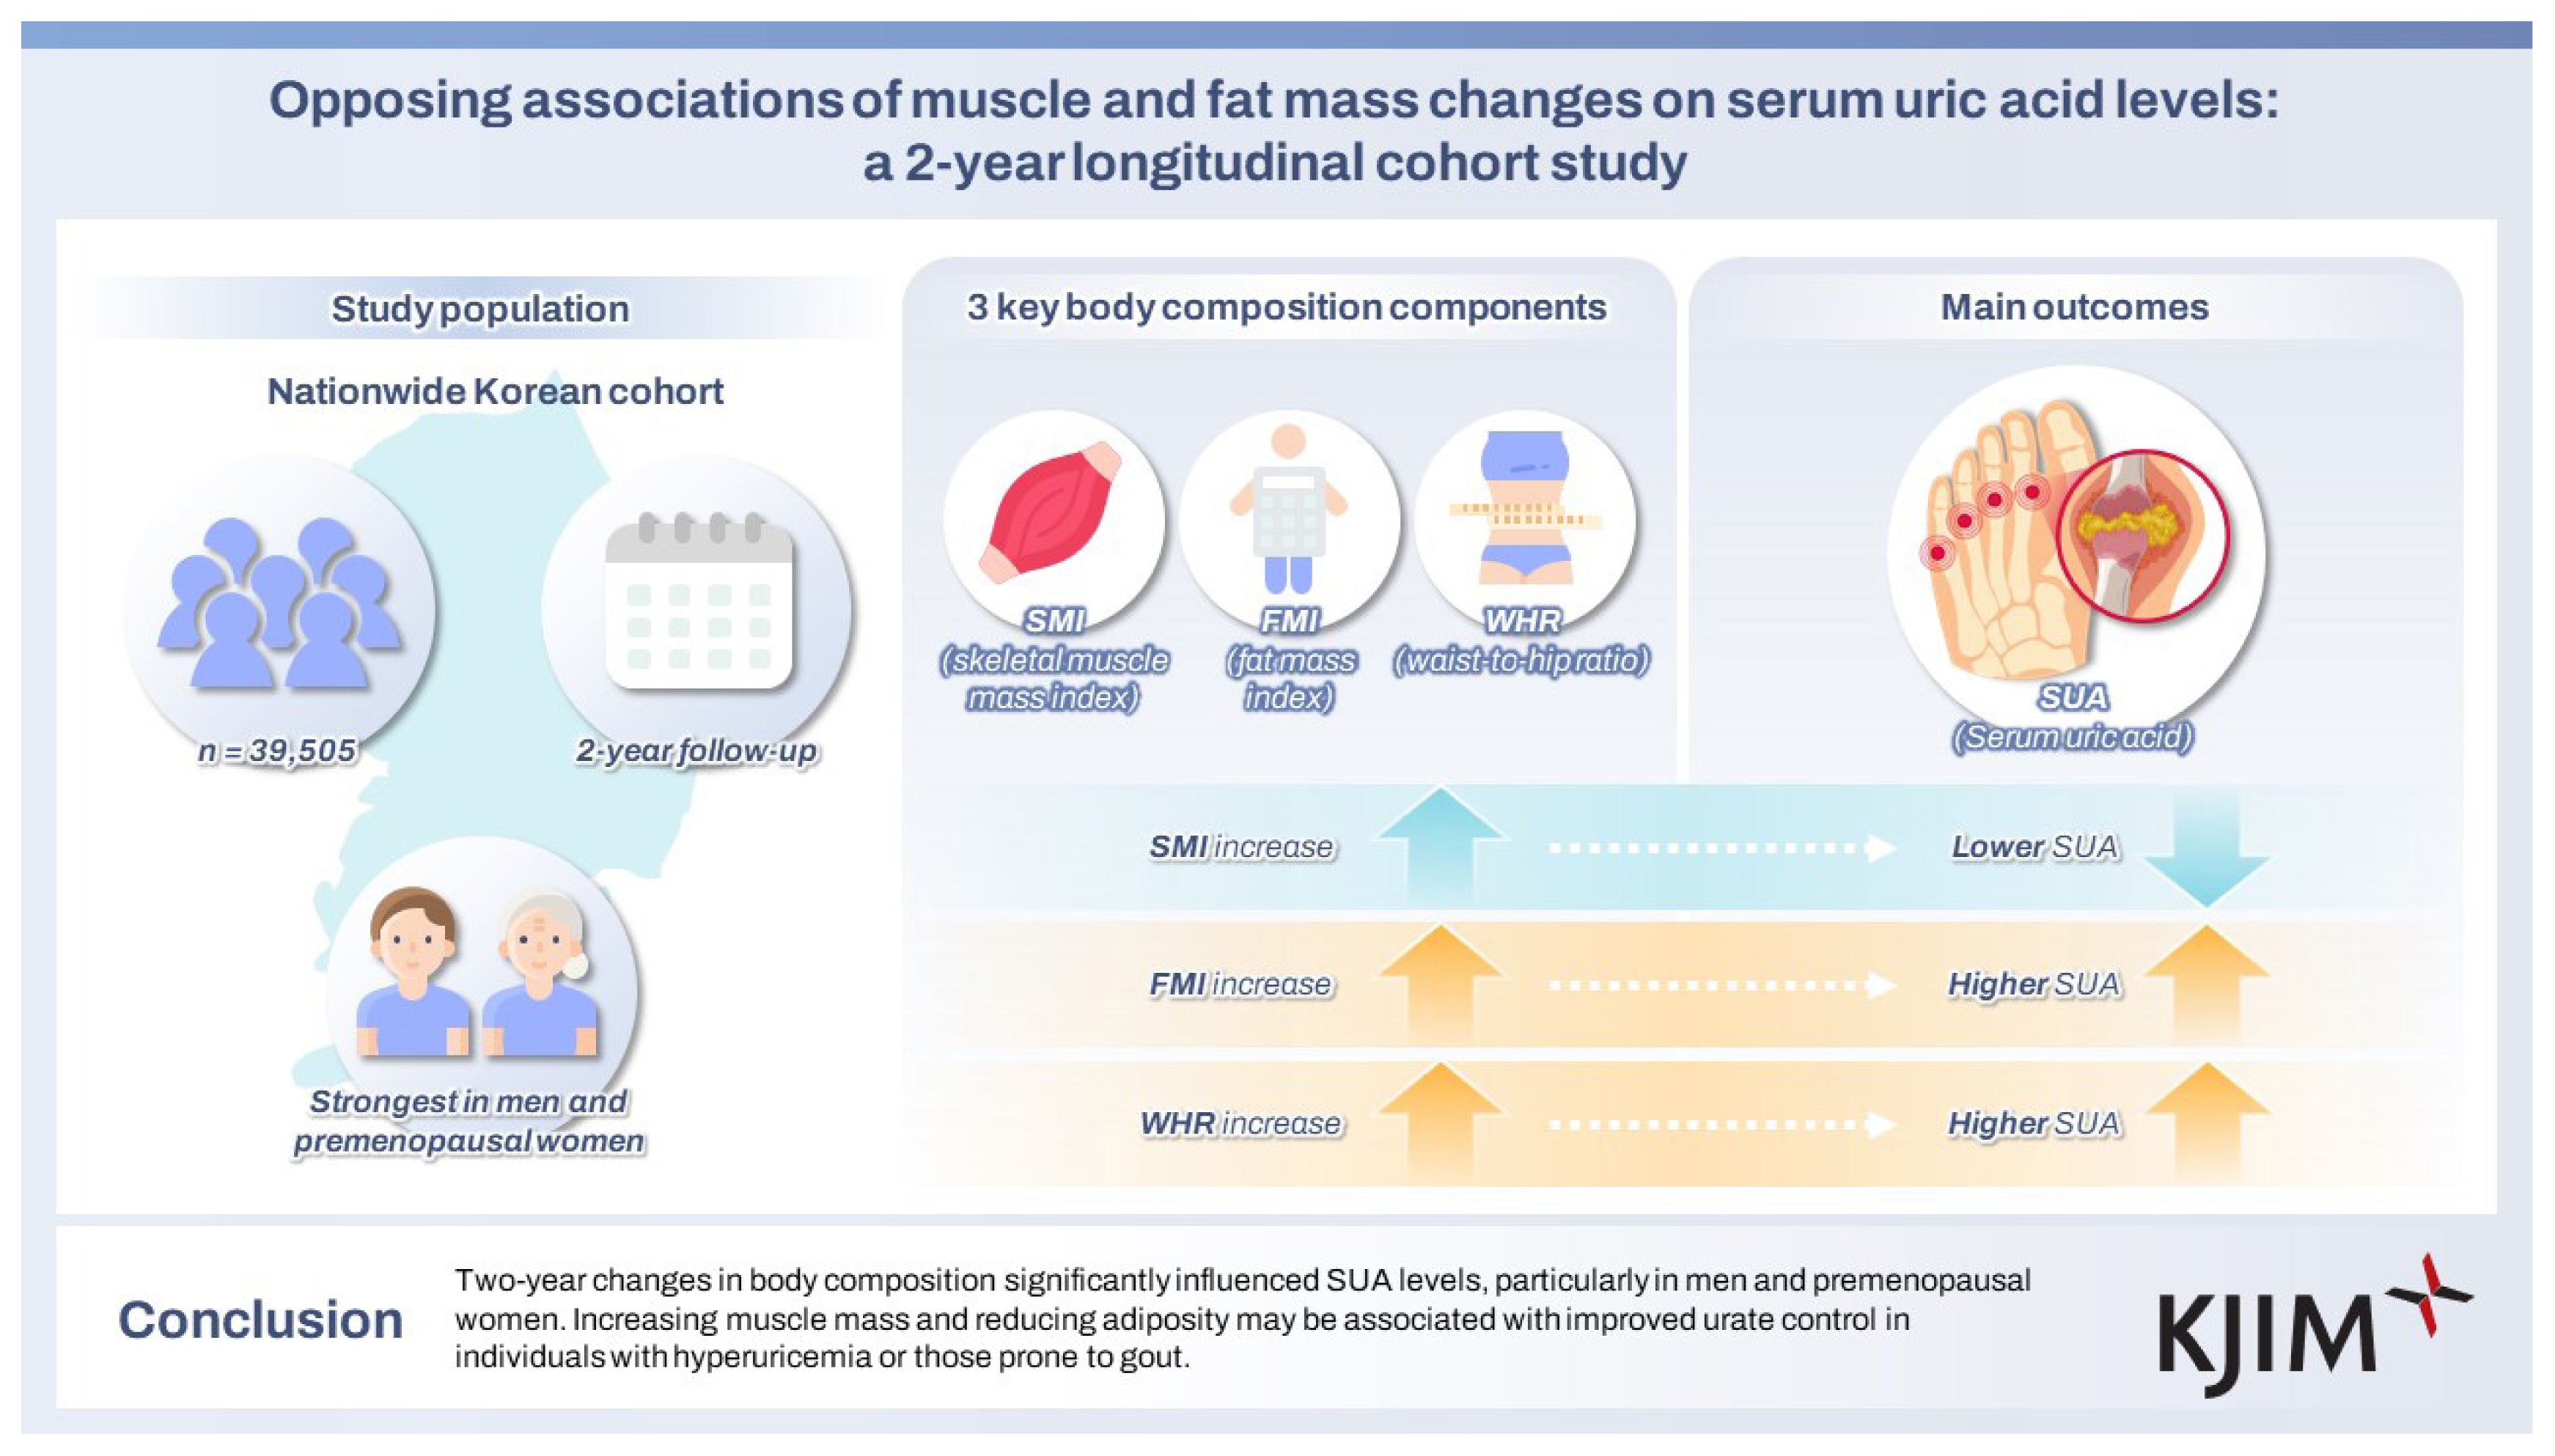
Obesity elevates serum uric acid (SUA) levels, but the influence of muscle mass remains unclear. As a major endogenous purine pool, skeletal muscle may affect SUA dynamics. We evaluated the impact of changes in body components, including skeletal muscle mass index (SMI), fat mass index (FMI), and waist-to-hip ratio (WHR), on SUA in a large cohort of healthy Koreans.
Methods
We analyzed 39,505 adults (24,623 men; 14,180 premenopausal and 702 postmenopausal women) who underwent health checkups in 2015–2017. Body composition was assessed using bioimpedance analysis. Participants were categorized into seven groups based on 2-year changes in SMI, FMI, and WHR (tertiles of increase, decrease, and no change). Hyperuricemia was defined as SUA ≥ 7 mg/dL in men and ≥ 6 mg/dL in women. Odds ratios (ORs) for achieving optimal SUA levels (< 6 mg/dL) and regression coefficients for SUA changes were calculated.
Results
Mean SUA levels were 6.25 ± 1.21 mg/dL in men, 4.23 ± 0.88 mg/dL in premenopausal women, and 4.34 ± 0.91 mg/dL in postmenopausal women. SUA changed dose-dependently with body component: SMI increases were associated with reduced SUA (OR [95% CI] for the highest tertile = 1.45 [1.32–1.59] in men; 1.48 [1.06–2.06] in premenopausal women), while FMI and WHR increases correlated positively with SUA.
Conclusions
Two-year changes in body composition significantly influenced SUA levels, particularly in men and premenopausal women. Increasing muscle mass and reducing adiposity may be associated with improved urate control in individuals with hyperuricemia or those prone to gout.
INTRODUCTION
Uric acid (UA) is the end product of purine metabolism in humans. Both exogenous and endogenous sources contribute to the body’s purine pool. The exogenous pool mainly depends on dietary intake, while the endogenous pool involves several organs and tissues, including the liver, kidney, intestines, and skeletal muscles [1]. Obesity has drawn considerable attention in modern society. It mainly results from a lavish diet and is characterized by excess body fat, which contributes to metabolic disorders such as gout. Hyperuricemia and obesity are often considered closely related conditions. In this regard, we previously reported that changes in body mass index (BMI) and fat mass significantly affect serum UA (SUA) levels [2,3], suggesting that weight loss could be an effective strategy for managing individuals with hyperuricemia.
However, weight changes do not originate solely from alterations in fat mass. Variations in other body components may also affect SUA levels. Skeletal muscles, another UA-producing site, serve as an endogenous pool of purines, including adenine nucleotide [4–6]. Many investigators have assessed the relationship between SUA and skeletal muscles, but have reported inconsistent results. For example, findings from National Health and Nutrition Examination Survey (NHANES) III showed that low skeletal muscle mass was associated with elevated SUA levels [7]. In men with type 2 diabetes, higher SUA levels were reported to be significantly associated with low skeletal muscle mass index (SMI) [8]. In contrast, Chinese community-based studies showed a significant association between elevated SUA levels and increased muscle mass [9,10]. Similarly, SUA levels and muscle mass were positively associated in patients undergoing peritoneal dialysis and kidney transplantation [11,12]. Such discrepancies may be attributed to the diverse study populations and cross-sectional designs.
Despite these findings, the direct relationship of muscle mass on SUA levels has been investigated only occasionally. Muscle mass has been identified as an important correlate of SUA levels in children and adolescents, with a greater influence on the variability of SUA levels observed in boys than in girls (43% vs. 7%), suggesting sexual-related differences [13]. Another large-scale Japanese survey suggested that SUA levels may partly reflect UA production within skeletal muscles [14].
Given that skeletal muscles represent a possible source of UA, in this study, we investigated the impact of changes in muscle mass on SUA levels in a clinically healthy population. We also examined which body composition parameters, including muscle mass, would be most attributable to the change in SUA levels, in line with our previous findings linking BMI and fat mass changes with SUA alterations.
METHODS
Study subjects
We recruited individuals who participated consecutively in a health checkup program conducted by the Kangbuk Samsung Hospital Total Healthcare Centers between 2015 and 2017. This program is part of a regular examination mandated by the Industrial Safety and Health Laws of the Republic of Korea, which requires employers to provide annual or biennial health checkups for employees at no cost. More than 80% of the study participants were employees of various corporations and companies, including local governmental organizations, or their spouses, who also received free checkups. The remaining participants voluntarily underwent self-paid health checkups.
Among 131,632 screened individuals, we excluded those who had underlying conditions and medical histories at baseline as follows: hypertension (n = 11,717), heart disease (n = 959), diabetes (n = 3,592), stroke (n = 515), chronic liver disease (including liver cirrhosis on ultrasonography) (n = 44), chronic kidney disease (estimated glomerular filtration rate [eGFR] < 60 mL/min/1.73 m2, n = 304; or serum creatinine level ≥ 1.4 mg/dL, n = 273), thyroid disease (n = 17,209), lung disease (including asthma and chronic obstructive pulmonary disease) (n = 2,782), malignancy (n = 3,754), dyslipidemia (n = 4,735), gout (n = 530), or the use of sedatives and anxiolytics (n = 880), steroid (n = 143), and medications for hypertension (n = 7,341), as well as tuberculosis (n = 420) and malignancy (n = 487). None were taking gout medication.
We further excluded participants with missing data on key study variables, including the food frequency questionnaire (FFQ) (n = 62,957), lifestyle factors (n = 2,699), anthropometric measurements (n = 8), or laboratory results (n = 24,847). Participants with extreme BMI values were also excluded—underweight (BMI < 18.5 kg/m2, n = 5,342) and severely obese (BMI > 35 kg/m2, n = 548). A total of 39,505 participants were included in the final analysis: 24,623 men and 14,882 women (14,180 premenopausal and 702 postmenopausal). Premenopausal and postmenopausal women were analyzed separately to account for estrogen-related effects on SUA levels. The Institutional Review Board of Kangbuk Samsung Hospital approved this study (KBSMC 2019-09-001) and waived the requirement for informed consent because only de-identified data were used.
Anthropometric and biochemical measurements
Comprehensive data were collected during health checkups, including personal and family medical history, medication use, laboratory test results, and anthropometric measurements (height, weight, blood pressure [BP], and waist circumference), as previously described [15,16]. At enrollment, all participants completed a 103-item semi-quantitative, self-reported FFQ, developed and validated in Korea [17].
Collected variables included: age (yr), weight (kg), height (m), waist circumference (cm), smoking status (never, former, or current), alcohol consumption (g/day), health-enhancing physical activity (HEPA) level, education level (high school or college graduate), medication use, and medical history. Daily dietary intake data were derived from the FFQ, including total energy (kcal), protein (g), fat (g), fiber (g), calcium (mg), and vitamin C (mg). BMI was calculated as weight divided by height (kg/m2), while obesity was defined as BMI ≥ 25 kg/m2, according to the Asia–Pacific criteria [18].
Fasting blood samples for laboratory tests were obtained after an overnight fast. Serum levels of UA, triglycerides, low-density lipoprotein cholesterol (LDL-C), creatinine, alkaline phosphatase, high sensitivity C-reactive protein (hs-CRP), and insulin were measured as previously described [19]. The eGFR was calculated using the Modification of Diet in Renal Disease study equation [20]. Insulin resistance was estimated using the homeostasis model assessment of insulin resistance (HOMA-IR), calculated as fasting insulin (mU/L) × fasting glucose (mmol/L)/22.5. Hyperuricemia was defined as SUA ≥ 7 mg/dL in men and ≥ 6 mg/dL in women. Values below these thresholds were classified as normouricemia.
Body composition measurements via bioelectrical impedance analysis
After an overnight fast, body composition, including skeletal muscle mass (kg) and fat mass (kg), was assessed using a bioelectrical impedance analysis (BIA) device (InBody 720; Biospace Inc., Seoul, Korea). Before measurements, participants’ palms and soles were wiped with electrolyte tissues. Subsequently, each participant was made to stand with both soles on the electrode-embedded platform and grasp the electrode handle with both hands in an abducted position from the body. A tetrapolar 8-point tactile electrode system (two electrodes for each hand and foot) was used to separately measure segmental impedance in the right arm, left arm, trunk, right leg, and left leg at six frequencies (1, 5, 50, 250, 500, and 1,000 kHz). Total body impedance was calculated by summing the segmental impedance values, and skeletal muscle and fat mass were estimated according to the manufacturer’s instructions, adjusted for body height.
The BIA technique is a validated tool for assessing body composition, showing good correlation with dual-energy X-ray absorptiometry (DXA) in the Korean population [21]. Lean mass (kg), fat mass (kg), and body fat percentage (%) were measured using this device. The waist-to-hip ratio (WHR) was also measured as a marker of abdominal obesity. Body weight reflects both muscular and non-muscular mass (fat, bone, and internal organs). To allow for proportional comparison, SMI and fat mass index (FMI) were calculated as follows: SMI (%) = skeletal muscle mass (kg)/body weight (kg) × 100; FMI (%) = fat mass (kg)/body weight (kg) × 100.
Statistical analysis
Continuous variables are presented as means with standard deviations or medians with interquartile ranges, and categorical variables are presented as frequencies with percentages. Variable changes were defined as the difference between the baseline examination (2015) and the 2-year follow-up (2017) for each participant. For baseline characteristics assessment, participants were categorized into seven groups according to changes in muscle mass over 2 years: increase ≥ 2.5 kg, 1.5–2.5 kg, or 0.5–1.5 kg; no change (-0.5 to 0.5 kg); and decrease ≥ 2.5 kg, 1.5–2.5 kg, or 0.5–1.5 kg. Group differences were assessed using analysis of variance, the Kruskal–Wallis H test, or the chi-square test.
For multivariable regression analysis, participants were categorized into seven groups based on tertiles of increase and decrease in body composition indices: T3 (greatest), T2, and T1 (smallest) increases; no change (-0.5 to 0.5%); and T3 (greatest), T2, and T1 (smallest) decreases. The tertile categories served as independent variables in each analysis.
First, binary logistic regression analysis was performed. The dependent variable was achievement of the optimal SUA level at follow-up, yes or no, and the main independent variables were changes in SMI, FMI, and WHR. The optimal SUA level was defined as < 6 mg/dL for both men and women, based on previous reports proposing this value as an upper threshold in the general population [22]. In men, attainment of the conventional upper normal limit (< 7 mg/dL) was additionally assessed as a separate binary outcome. Because WHR variability over 2 years was too small to compare tertile categories, WHR values were multiplied by 1,000 before analysis.
Next, multiple linear regression analyses were conducted to assess the association between changes in SUA levels (dependent variable) and changes in body composition (SMI, FMI, and WHR; independent variables). In these models, the dependent variable was the absolute changes in SMI, FMI, and WHR. Three models were constructed with progressive adjustments for potential confounders: model 1, adjusted for age, education level, daily alcohol consumption, HEPA level, and systolic BP (SBP); model 2, additionally adjusted for intake of total energy, protein, fat, calcium, vitamin C, and fiber based on FFQ data; model 3, further adjusted for triglyceride, hs-CRP, eGFR, and HOMA-IR laboratory findings; and model 4, additionally adjusted for baseline BMI, body weight, and SUA. Because FMI was the main independent variable of interest, additional stratified multiple linear regression analyses according to obesity status (non-obese vs. obese) were performed for FMI, corresponding to models 3 and 4. All covariates in the multivariate models had a variance inflation factor < 5.0, which is considered acceptable for deflecting relevant multicollinearity [23].
All analyses were performed separately for men, premenopausal women, and postmenopausal women. Statistical significance was set at p < 0.05. STATA 16.1 (StataCorp LP, College Station, TX, USA) was used for all statistical analyses.
RESULTS
Participant characteristics
The baseline characteristics of the study population are presented in Supplementary Tables 1–3. The mean age was 38.6 ± 6.5 years in men, 37.2 ± 5.4 years in premenopausal women, and 46.1 ± 8.2 years in postmenopausal women. Mean SUA levels were 6.25 ± 1.21 mg/dL in men, 4.23 ± 0.88 mg/dL in premenopausal women, and 4.34 ± 0.91 mg/dL in postmenopausal women. Hyperuricemia was most prevalent in men (26.08%), followed by postmenopausal (4.42%) and premenopausal women (3.22%).
The mean muscle mass and BMI were 53.6 ± 5.6 kg and 24.8 ± 2.8 kg/m2 in men, 37.2 ± 3.7 kg and 22.1 ± 2.7 kg/m2 in premenopausal women, and 36.7 ± 3.7 kg and 22.6 ± 2.7 kg/m2 in postmenopausal women, respectively. Over 2 years, muscle mass changes were mostly within ± 2.5 kg, with decreases occurring more frequently than increases (men: 49.6% vs. 23.8%; premenopausal women: 44.1% vs. 22.9%; postmenopausal women: 38.3% vs. 26.8%), excluding those with no change (± 0.5 kg).
Men and premenopausal women with decreased muscle mass tended to be less obese, less physically active, and more likely to have hyperuricemia at baseline, while LDL-C and education levels were comparable across the groups. Participants with increased muscle mass had significantly higher baseline SBP and HOMA-IR values, as well as higher total protein intake (and higher fat intake in men), whereas other dietary factors showed no significant differences.
Body composition changes and achievement of optimal SUA levels
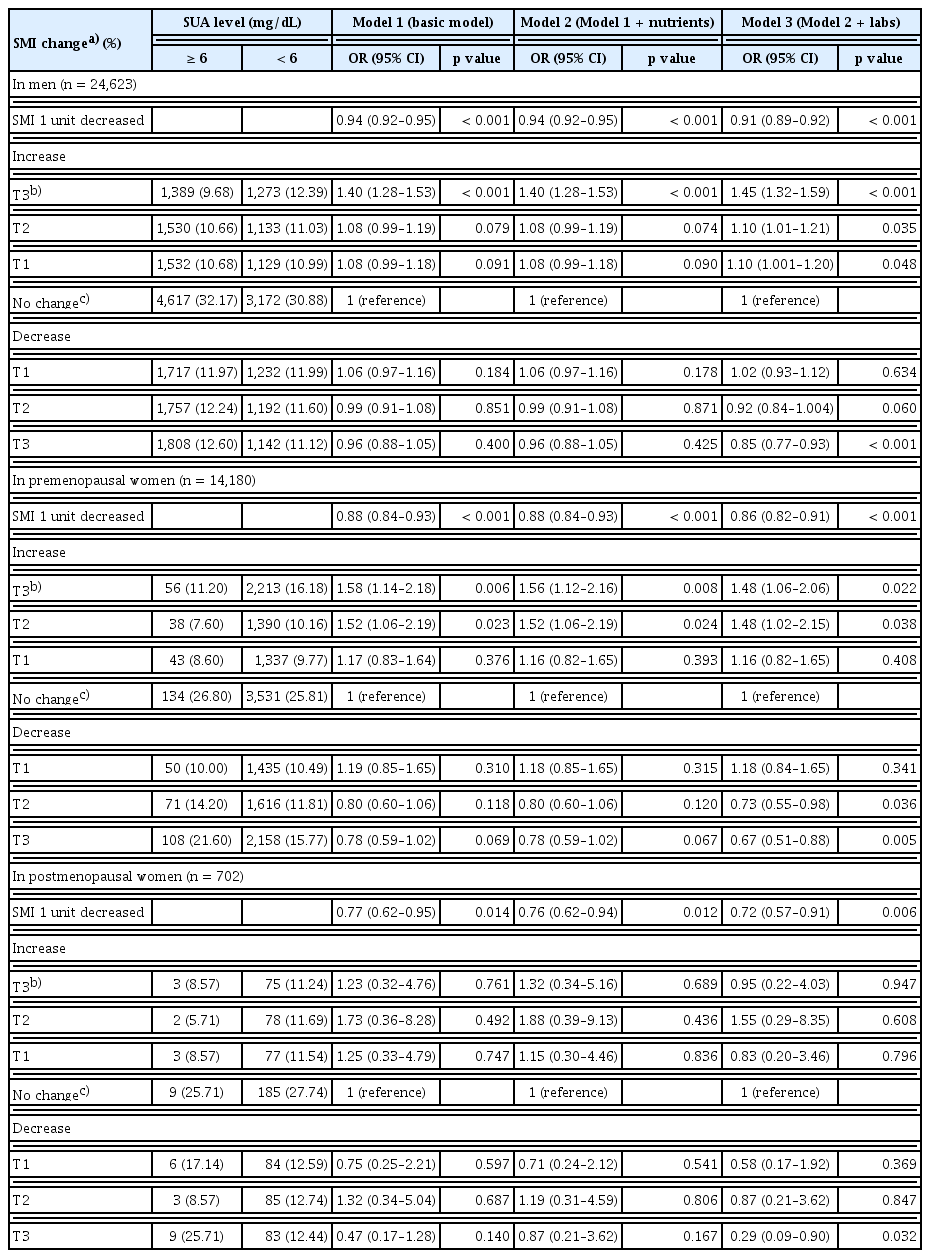
In designing this study, indexed measures of body composition, specifically SMI (%) and FMI (%), were employed instead of absolute mass to enable more accurate comparisons. The multivariate odds ratios (ORs) for achieving optimal SUA level (< 6 mg/dL) are shown in Tables 1–3. In these analyses, an increase indicated a higher measurement in 2017 than in 2015, showing an upward trend over time, whereas a decrease reflected the reverse.
The impact of SMI as a predictor for achieving optimal SUA levels (< 6 mg/dL)

The impact of FMI as a predictor for achieving optimal SUA levels (< 6 mg/dL)
The impact of WHR as a predictor for achieving optimal SUA levels (< 6 mg/dL)
An increase in SMI showed a graded positive association with achieving the optimal SUA levels. The ORs (95% confidence interval [CI]) for tertiles (T1–T3) of SMI increase were 1.10 (1.00–1.20), 1.10 (1.01–1.21), and 1.45 (1.32–1.59) in men, and 1.16 (0.82–1.65), 1.48 (1.02–2.15), and 1.48 (1.06–2.06) in premenopausal women, respectively. Conversely, for SMI decrease, the ORs were 1.02 (0.93–1.12), 0.92 (0.84–1.00), and 0.85 (0.77–0.93) in men and 1.18 (0.84–1.65), 0.73 (0.55–0.98), and 0.67 (0.51–0.88) in premenopausal women, showing a decreasing trend in the likelihood of reaching the optimal SUA levels. Overall, higher SMI over time was associated with a greater probability of achieving the optimal SUA levels.
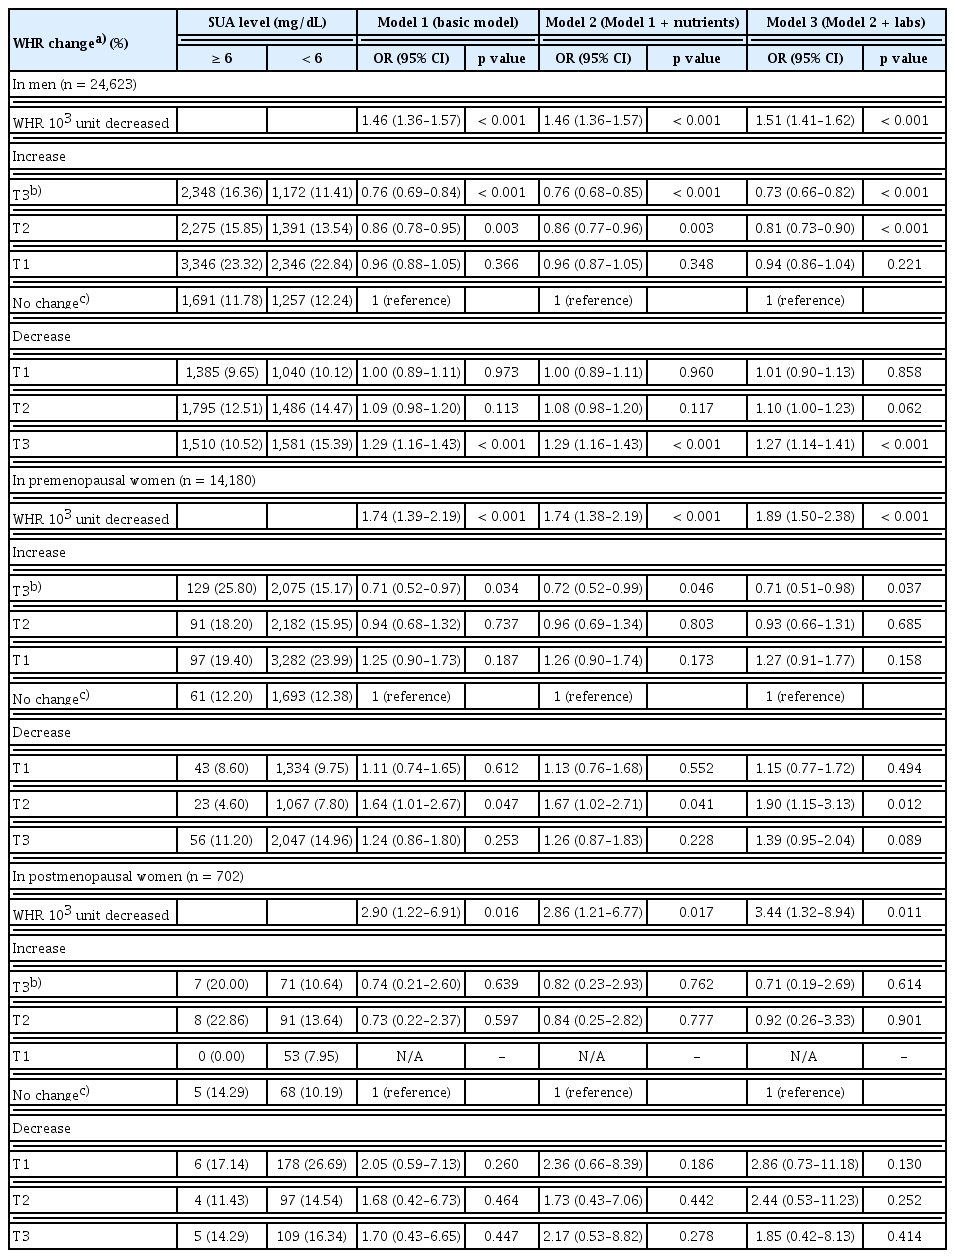
In contrast, FMI and WHR exhibited inverse associations with attainment of the optimal SUA levels. The ORs (95% CI) for tertiles (T1–T3) of FMI increase were 1.00 (0.91–1.10), 0.94 (0.85–1.03), and 0.83 (0.75–0.91) in men, and 1.05 (0.76–1.45), 0.93 (0.67–1.28), and 0.69 (0.51–0.94) in premenopausal women, respectively, whereas for FMI decrease they were 1.05 (0.95–1.15), 1.13 (1.01–1.24), and 1.44 (1.31–1.58) in men, and 1.42 (0.99–2.04), 1.49 (1.03–2.13), and 1.62 (1.11–2.35) in premenopausal women, respectively, indicating that lower FMI over time was associated with a higher probability of achieving the optimal SUA levels. The ORs (95% CI) for T1, T2, and T3 of WHR increase were 0.94 (0.86–1.04), 0.81 (0.73–0.90), and 0.73 (0.66–0.82) in men, and 1.27 (0.91–1.77), 0.93 (0.66–1.31), and 0.71 (0.51–0.98) in premenopausal women, respectively, while the corresponding ORs for WHR decrease were 1.01 (0.90–1.13), 1.10 (1.00–1.23), and 1.27 (1.14–1.41) in men, and 1.15 (0.77–1.72), 1.90 (1.15–3.13), and 1.39 (0.95–2.04) in premenopausal women, respectively, confirming that reduced central obesity improved the likelihood of achieving the optimal SUA levels. Similar trends across SMI, FMI, and WHR were also observed in men for attaining a normal SUA level (< 7 mg/dL) (Supplementary Table 4).
Among postmenopausal women, most associations were not statistically significant, except for that with the highest tertile of SMI decrease (T3), which was associated with a significantly lower odds of achieving the optimal SUA levels (OR 0.29, 95% CI 0.09–0.90).
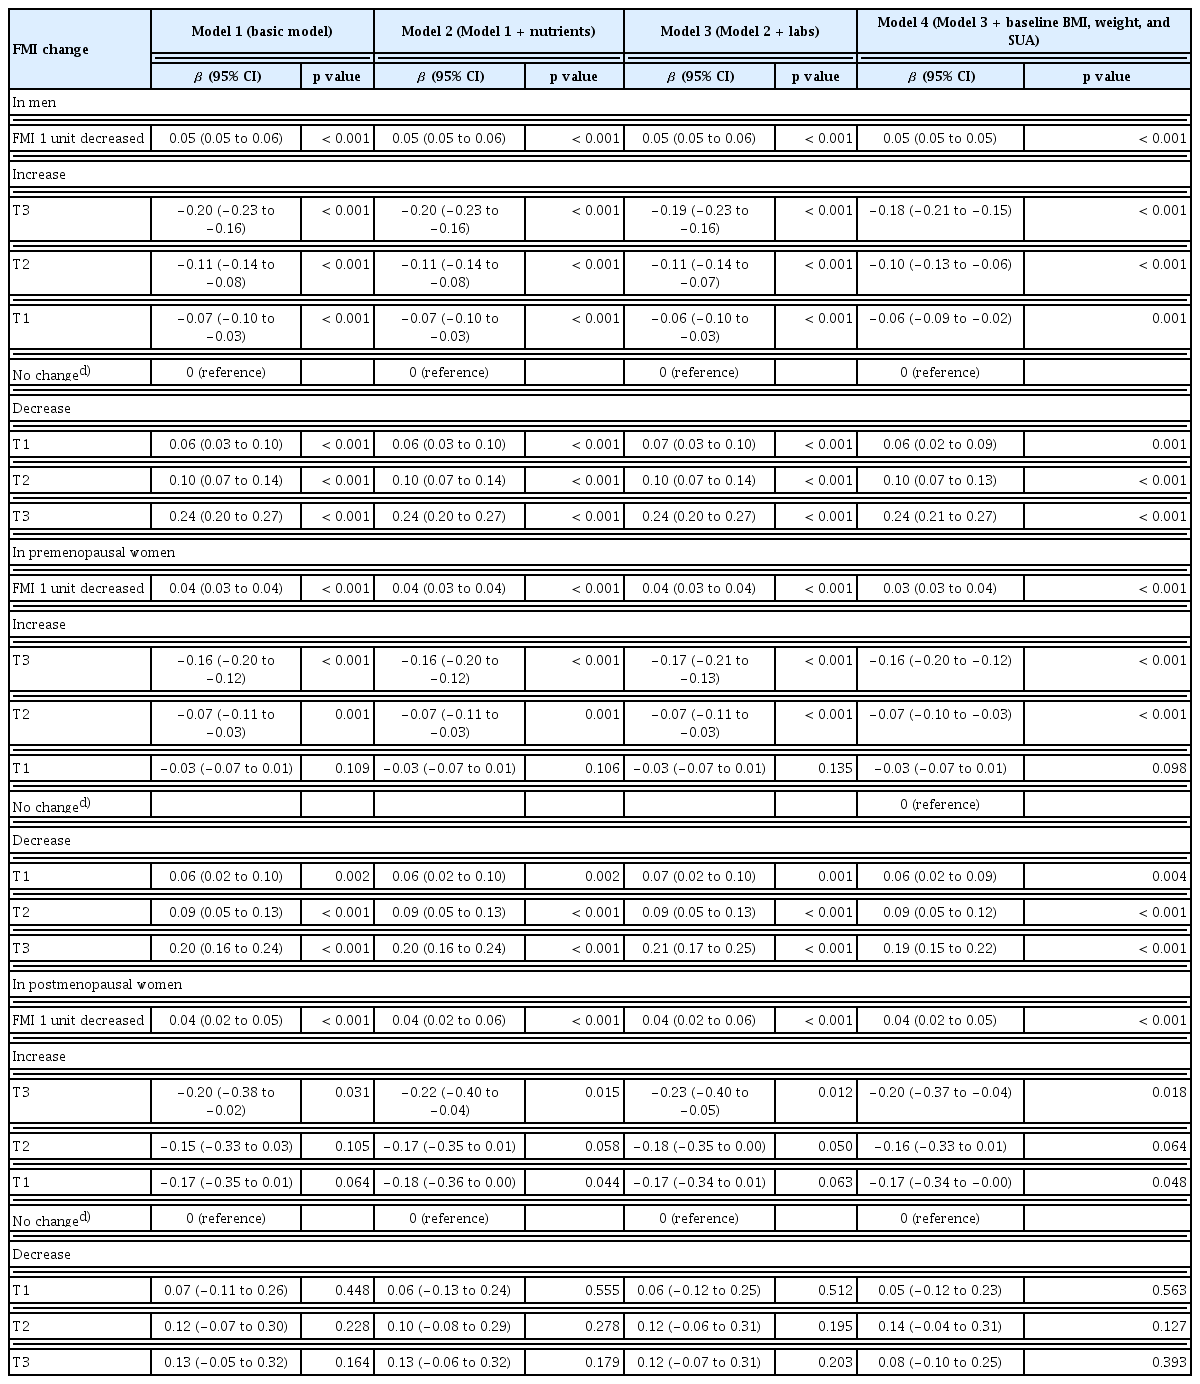
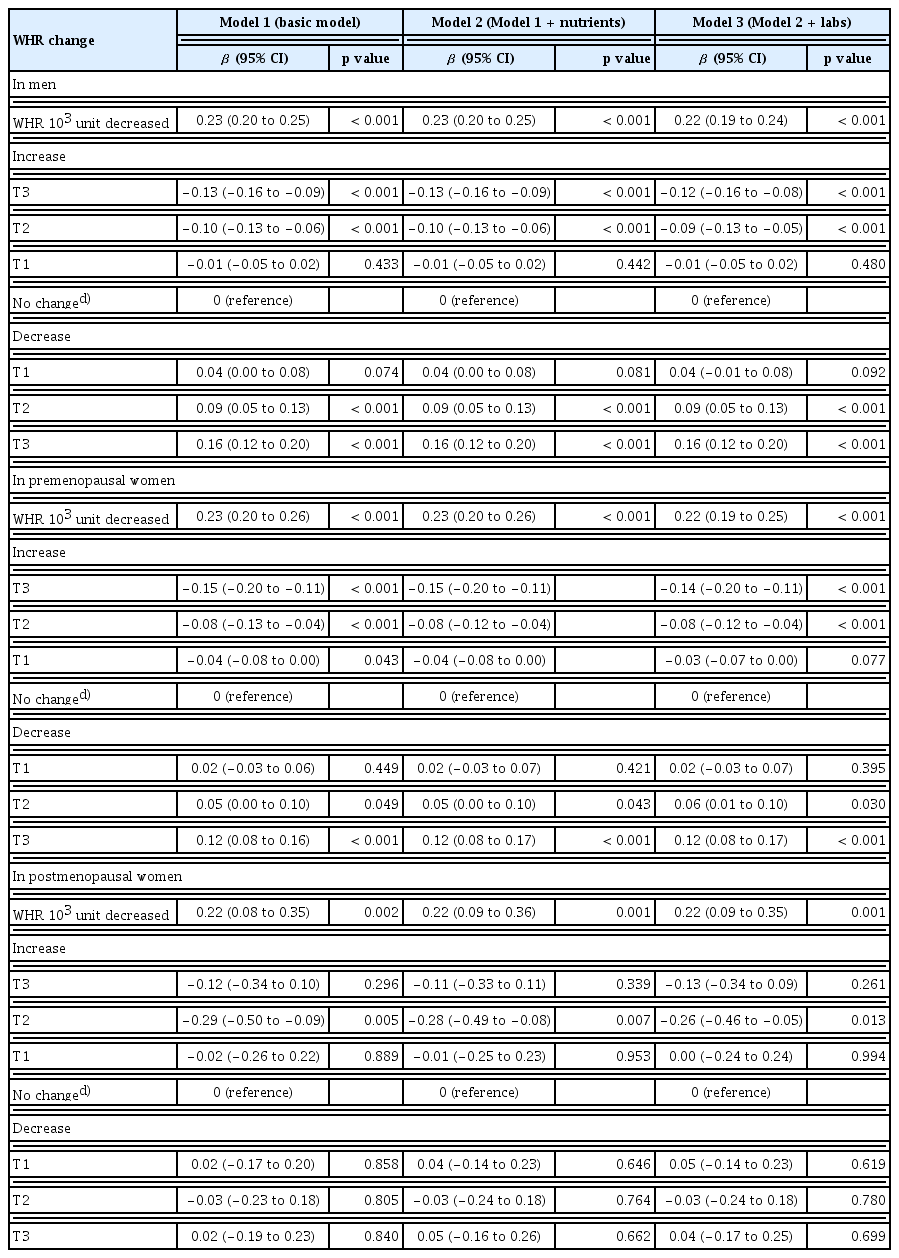
Change in body composition and corresponding changes in SUA levels
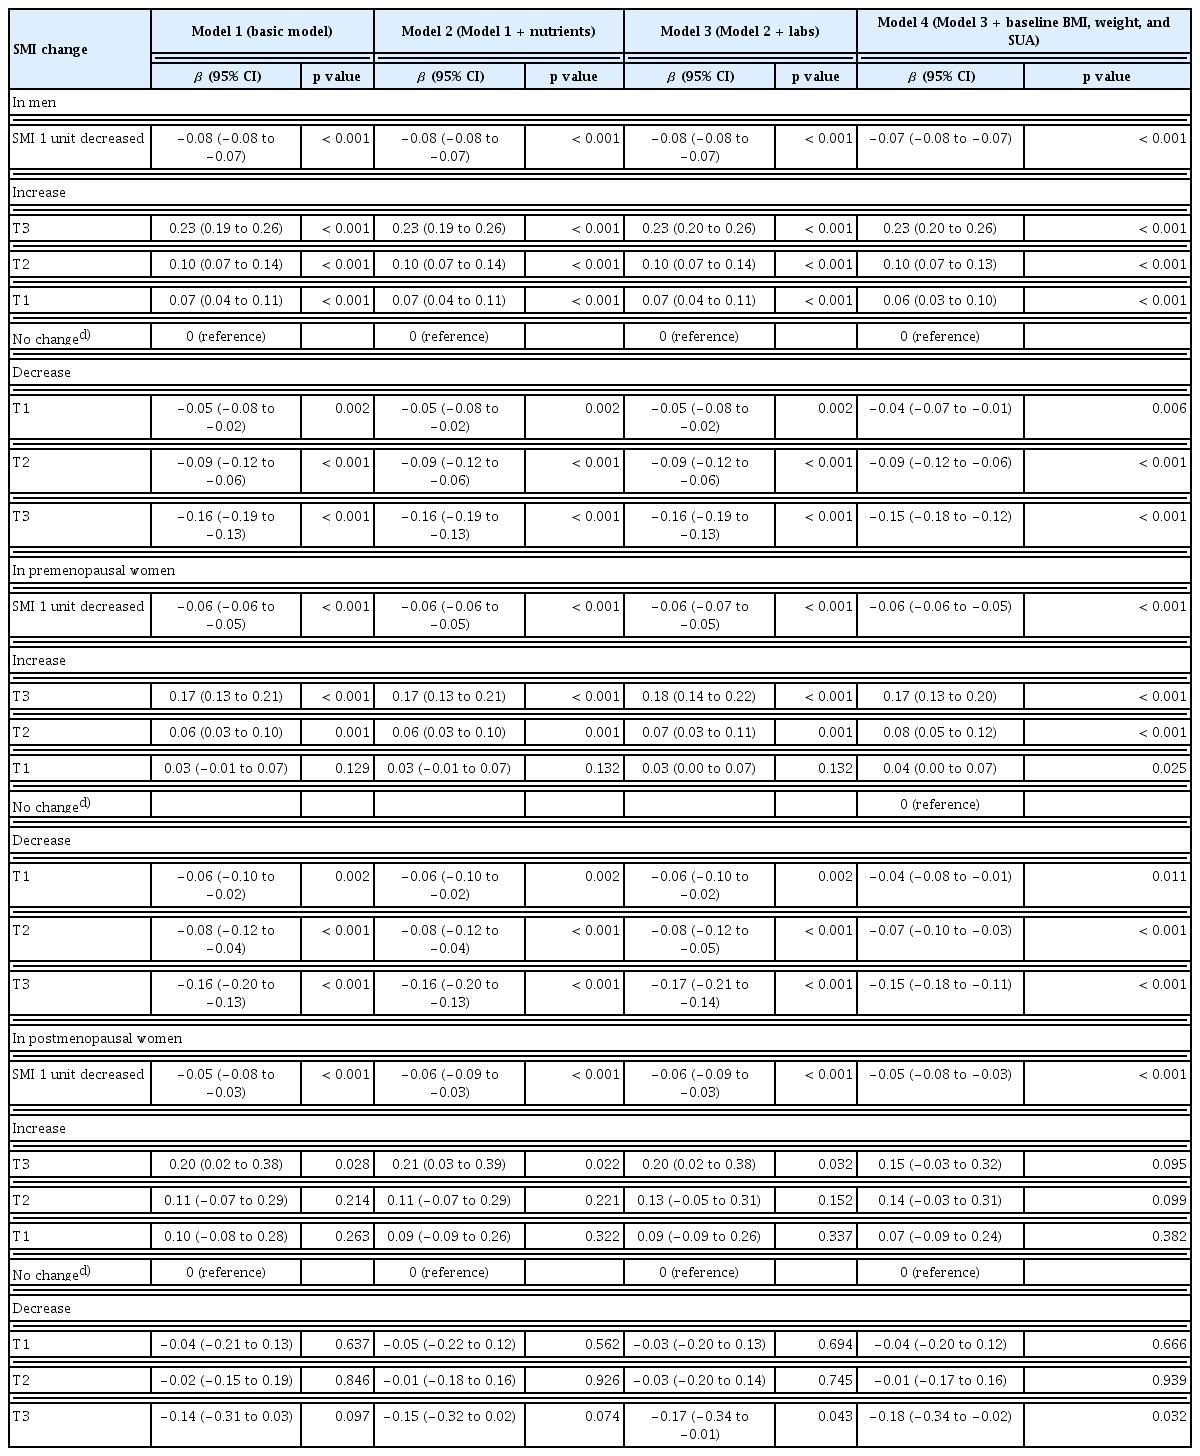
Regression coefficients for changes in SUA levels were estimated according to changes in body composition parameters (Table 4–6). These associations were statistically significant and showed a consistent linear relationship across all adjusted regression models, except in postmenopausal women (Fig. 1). The direction of SUA change differed according to the type of body composition change: SUA increased with greater gains in FMI or WHR but decreased with greater gains in SMI. This pattern was not observed in postmenopausal women. In the stratified analysis of the main independent variable of interest, FMI, according to obesity status (non-obese vs. obese), greater FMI gain was associated with larger increases in SUA regardless of obesity status (Supplementary Table 5).
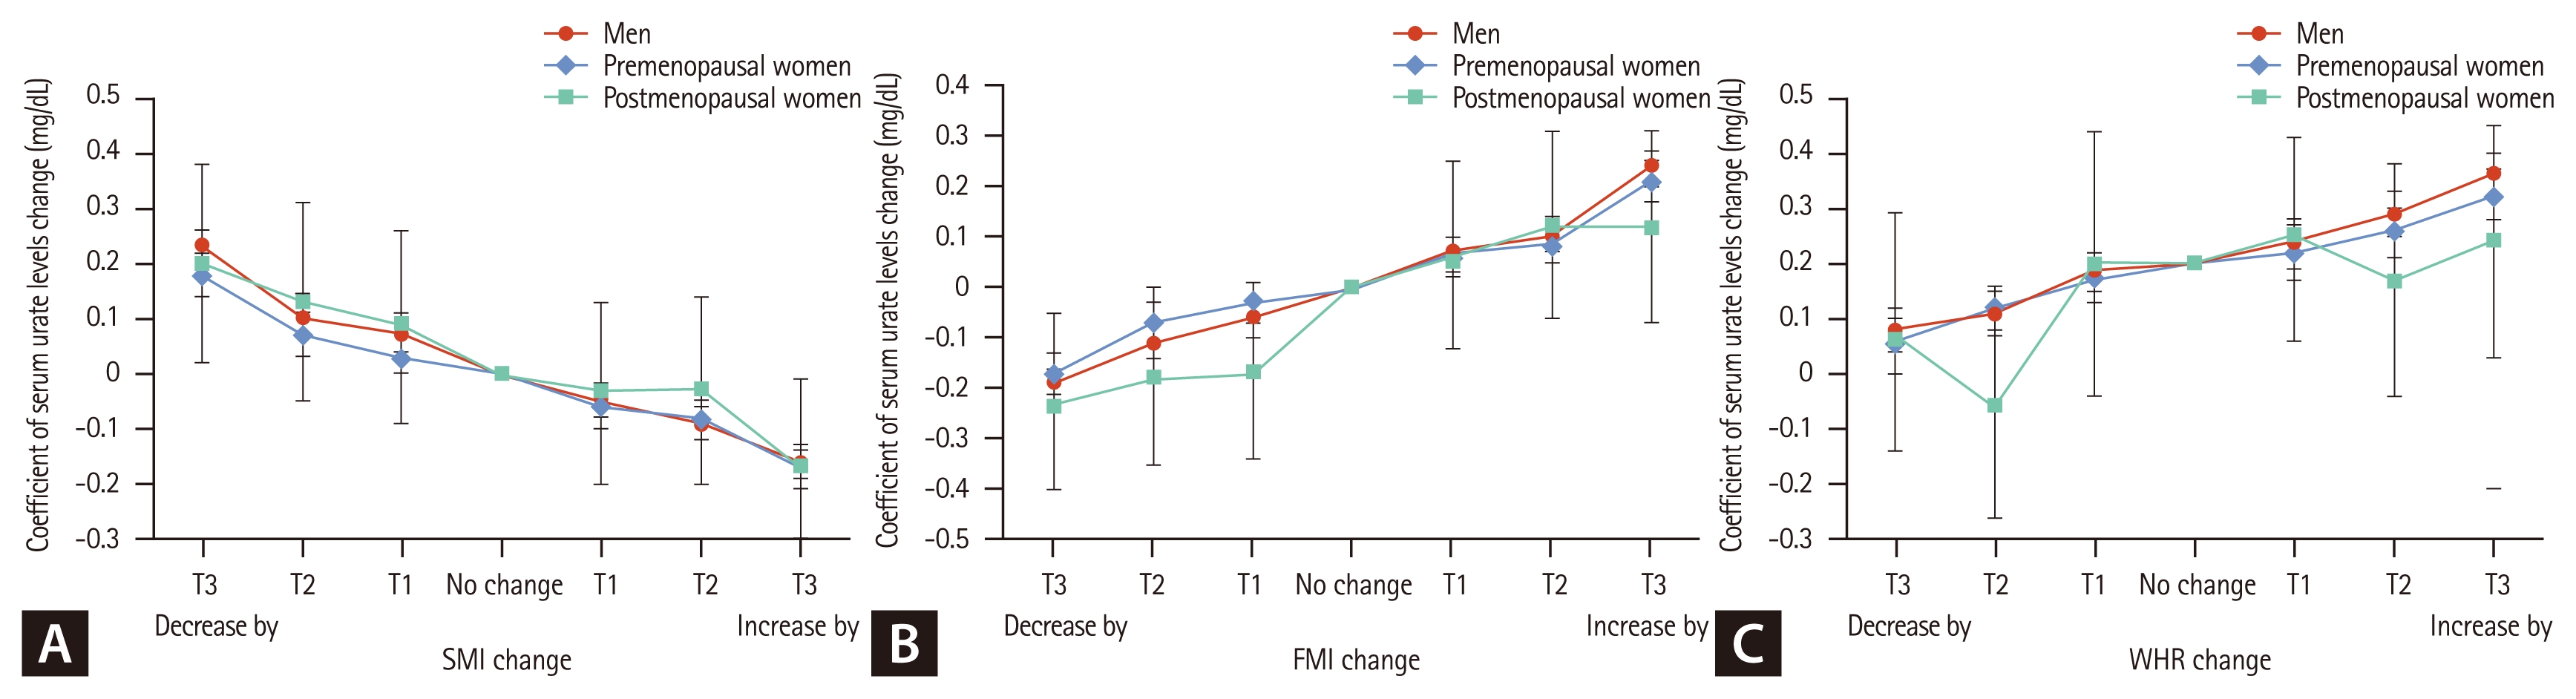
Relationships between (A) SMI change and SUA variability, (B) FMI change and SUA variability, and (C) WHR change and SUA variability in men, premenopausal women, and postmenopausal women according to each tertile change during the 2-year follow-up. A closed dot for each tertile of SMI, FMI, and WHR indicates the beta-coefficient of SUA change (± standard error), and the solid line connects the individual dots to highlight the direction and size of SUA change according to each tertile of variables. Each dot was estimated from a linear regression model representing the adjusted dose-response associations between each variance and SUA level variability. blue diamond dot and line display the result for men, red circle and line for premenopausal women, and green square one for postmenopausal women. Models were adjusted for age, education level, daily alcohol consumption, HEPA level, SBP, dietary intake (total energy, protein, fat, calcium, vitamin C, and fiber based on the FFQ) and laboratory parameters (triglycerides, hs-CRP, eGFR, and HOMA-IR). SMI, skeletal muscle mass index; SUA, serum uric acid; FMI, fat mass index; WHR, waist-to-hip ratio; HEPA, health-enhancing physical activity; SBP, systolic blood pressure; FFQ, food frequency questionnaire; hs-CRP, high sensitivity C-reactive protein; eGFR, estimated glomerular filtration rate; HOMA-IR, homeostasis model assessment of insulin resistance.
We further compared the explanatory power of each body composition parameter to determine its association with SUA variability. The adjusted R2 values were highest for FMI, followed by SMI and WHR, across all models and participant groups (Supplementary Table 6).
DISCUSSION
This longitudinal study showed that 2-year changes in body composition indices, including SMI, FMI, and WHR, were significantly associated with SUA variability in a dose-dependent manner. The key finding was the opposing influence of muscle and fat compartments on SUA homeostasis: an increase in SMI was linked to reduced SUA levels and a higher likelihood of achieving the optimal SUA levels (< 6 mg/dL), whereas increases in FMI or WHR were associated with elevated SUA levels and poorer optimal attainment. These results were consistent in men and premenopausal women, suggesting that muscle gain and fat loss exert independent and opposing associations on SUA regulation. This study adds to the existing evidence as it was conducted to concurrently evaluate the dynamic interactions of muscle and fat compartments on SUA variability in a large-scale longitudinal cohort.
The inverse association between changes in SMI and SUA levels suggests that preserving or increasing muscle mass may be a practical strategy for mitigating hyperuricemia. Previous cross-sectional studies and meta-analyses have reported positive correlations between SUA levels and muscle mass or strength, suggesting a possible antioxidant role of UA in muscle metabolism [11, 24–26]. However, our longitudinal findings indicate that muscle loss, rather than lower SUA level, contributes to SUA elevation over time. Declines in muscle mass often coincide with fat accumulation, which is closely related to insulin resistance and chronic low-grade inflammation, both of which reduce renal urate clearance [26–28]. Therefore, maintaining or increasing muscle mass may prevent hyperuricemia by improving insulin sensitivity and counteracting the metabolic pathways that promote urate retention. This finding supports the idea that the net physiological impact of changes in body composition, particularly muscle loss, outweighs any potential in vivo antioxidant role of SUA.
In contrast, changes in adiposity indices, particularly FMI and WHR, showed strong positive associations with SUA variability. This finding aligns with those of previous studies linking visceral fat accumulation to hyperuricemia [29–31]. In our analysis, FMI and WHR explained a greater proportion of SUA variance than SMI did, underscoring the dominant role of adiposity (Supplementary Table 5). Visceral adipose tissue functions as an active endocrine organ that increases SUA levels by promoting insulin resistance, impairing renal urate excretion via urate transporter 1, and releasing proinflammatory adipokines that exacerbate systemic inflammation and inhibit urate clearance [32,33]. These findings reinforce the growing concept that the metabolic quality of fat, rather than total body weight, determines UA metabolism and related cardiometabolic risks [34].
The associations between body composition change and SUA variability were strong in men and premenopausal women but attenuated in postmenopausal women. The diminished association in postmenopausal women may reflect the loss of estrogen’s uricosuric effect, which reduces urate excretion and contributes to dyslipidemia and insulin resistance, factors that can mask the influence of body composition changes on SUA dynamics [26]. The relatively small sample size of postmenopausal women in our cohort (n = 702) may also have limited the statistical power to detect significant trends. Further research involving larger hormone-adjusted postmenopausal cohorts is required. Incorporating detailed hormone status, including hormone replacement therapy, may help explain the weaker associations observed in postmenopausal women.
This study has several strengths. The longitudinal design with a 2-year follow-up enabled temporal assessments of body composition and SUA changes, providing stronger causal inference than that of cross-sectional approaches. The large sample size, inclusion of both sexes and menopausal strata, and comprehensive adjustment for metabolic, lifestyle, and renal parameters further enhance the robustness of the findings. Moreover, the concurrent evaluation of SMI, FMI, and WHR allowed a nuanced understanding of their independent and opposing associations to SUA regulation.
However, some limitations should be noted. First, body composition was assessed using BIA, which is less precise than DXA. Second, participants were voluntary health checkup examinees, introducing potential selection bias toward healthier individuals. Third, the 2-year observation period may not have fully captured short-term variations in lifestyle or SUA levels. Finally, changes in muscle and fat mass at the population level were assessed in this study rather than tracking concurrent intra-individual alterations. Because muscle and fat compartments often shift reciprocally within the same individual, the lack of paired longitudinal analyses limits the direct translation of these findings into individualized clinical applications. Despite these limitations, this study provides valuable insights into how changes in body composition are associated with UA metabolism in relatively healthy adults.
In conclusion, this large-scale longitudinal analysis provided significant evidence that dynamic changes in body composition are important correlates of SUA variability. Relative gain in skeletal muscle mass and reduction in fat mass were independently associated with lower SUA levels. These findings highlight the clinical importance of targeting body composition, and not merely body weight, as a comprehensive strategy for preventing and managing hyperuricemia and related cardiometabolic disorders, particularly in men and premenopausal women.
KEY MESSAGE
1. Dynamic changes in body composition are key determinants of SUA variability, particularly in men and premenopausal women.
2. Muscle gain and fat loss have opposing, yet independent associations with SUA regulation.
3. Body composition, not body weight alone, may be a more relevant target for preventing and managing hyperuricemia, especially in men and premenopausal women.
Notes
Acknowledgments
During the preparation of this manuscript, the authors used ChatGPT (OpenAI, San Francisco, CA, USA) to assist with language editing, structural refinement, and consistency checks. The AI tool was not used for study design, data collection, statistical analysis, or interpretation of the findings. The authors reviewed and verified all content generated by the AI tool and take full responsibility for the integrity and accuracy of the manuscript.
CRedit authorship contributions
Jiwon Hwang: conceptualization, methodology, investigation, validation, writing - original draft, writing - review & editing, visualization, supervision; Mi Yeon Lee: data curation, formal analysis, software, writing - review & editing, visualization, supervision; Joong Kyong Ahn: conceptualization, methodology, resources, investigation, validation, writing - review & editing, visualization, supervision
Conflicts of interest
The authors disclose no conflicts.
Funding
None