Prognostic role of the neutrophil-to-lymphocyte ratio in patients with chronic kidney disease
Article information

Abstract
Background/Aims
The neutrophil-to-lymphocyte ratio (NLR) has a prognostic value in cardiovascular disease, infection, inflammatory disease, and several malignancies. Therefore, the NLR has a possible predictive value in patients with chronic kidney disease (CKD), but this predictive value has not been validated. Here, we aimed to investigate the possibility of NLR as a predictor of CKD progression.
Methods
This retrospective observational study included 141 patients with non-dialysis CKD. The participants were divided into terciles (T1, T2, and T3) according to NLR. The primary outcome was defined as a composite kidney event, which included a decline in the estimated glomerular filtration rate (eGFR) of at least 50% or initiation of renal replacement therapy during the follow-up period.
Results
The mean follow-up duration was 5.45 ± 2.11 years. The mean NLRs were 1.35 ± 0.05 in T1 (n = 47), 2.16 ± 0.04 in T2 (n = 47), and 4.29 ± 0.73 in T3 (n = 47). The group with the highest NLR (T3) had higher baseline CKD and serum creatinine and lower eGFR levels than the group with the lowest NLR (T1). The cumulative incidence rate of composite kidney events was significantly higher in T3 compared with T1 (p < 0.001, log-rank test). Cox regression analysis revealed that high NLR was associated with the risk of composite kidney events (adjusted hazard ratio, 3.33; 95% confidence interval, 1.43–7.76).
Conclusions
A higher NLR reflects the more advanced stage of CKD and suggests a role for NLR as a biomarker for predicting CKD progression.

INTRODUCTION
Chronic inflammation is closely associated with various chronic diseases, such as diabetes mellitus, cardiovascular disease, and chronic kidney disease (CKD) [1]. Patients with CKD tend to have elevated levels of inflammatory mediators, including high-sensitivity C-reactive protein (hs-CRP), tumor necrosis factor-α (TNF-α), and interleukin (IL)-6 [2]. These mediators stimulate the inflammatory pathway, leading to glomerular hypertension, tubulointerstitial fibrosis, kidney scarring, and, finally, CKD progression and increased cardiovascular events [3,4]. Therefore, it is important to evaluate and decrease the extent of chronic inflammation in patients with CKD. Patients with CKD have higher levels of proinflammatory cytokines, but it remains unclear which biomarker is the best indicator of inflammation in patients with CKD.
The neutrophil-to-lymphocyte ratio (NLR), obtained by dividing the absolute number of neutrophils to the lymphocyte count, is increasingly studied as a new inflammatory marker. An elevated NLR has recently been reported to be an independent predictor of mortality in patients with cardiovascular disease or cancer [5–8]. As CKD is a chronic inflammatory disease, high NLR can predict CKD progression and cardiovascular disease and cancer. However, significantly few studies have investigated the association between high NLR and CKD progression [9–12].
Thus, in this study, we aimed to investigate whether NLR levels were associated with the decline of kidney function in patients with CKD.
METHODS
Study design and data collection
This was a retrospective study based on electric medical record dataset at Department of Nephrology, Chonnam National University Hospital (CNUH). We enrolled 158 patients who visited the nephrology outpatient clinic between April 2011 and October 2011. Follow-up data were collected until April 2020. The inclusion criteria were patients with non-dialytic CKD and screened for International Classification of Diseases codes of CKD (N18.1–18.5, N189). The exclusion criteria were patients with an acute infectious event; malignancy, including hematological or autoimmune disease at the time of enrollment; and insufficient data on follow-up duration. Thus, 141 patients were included in the final analysis (Fig. 1).
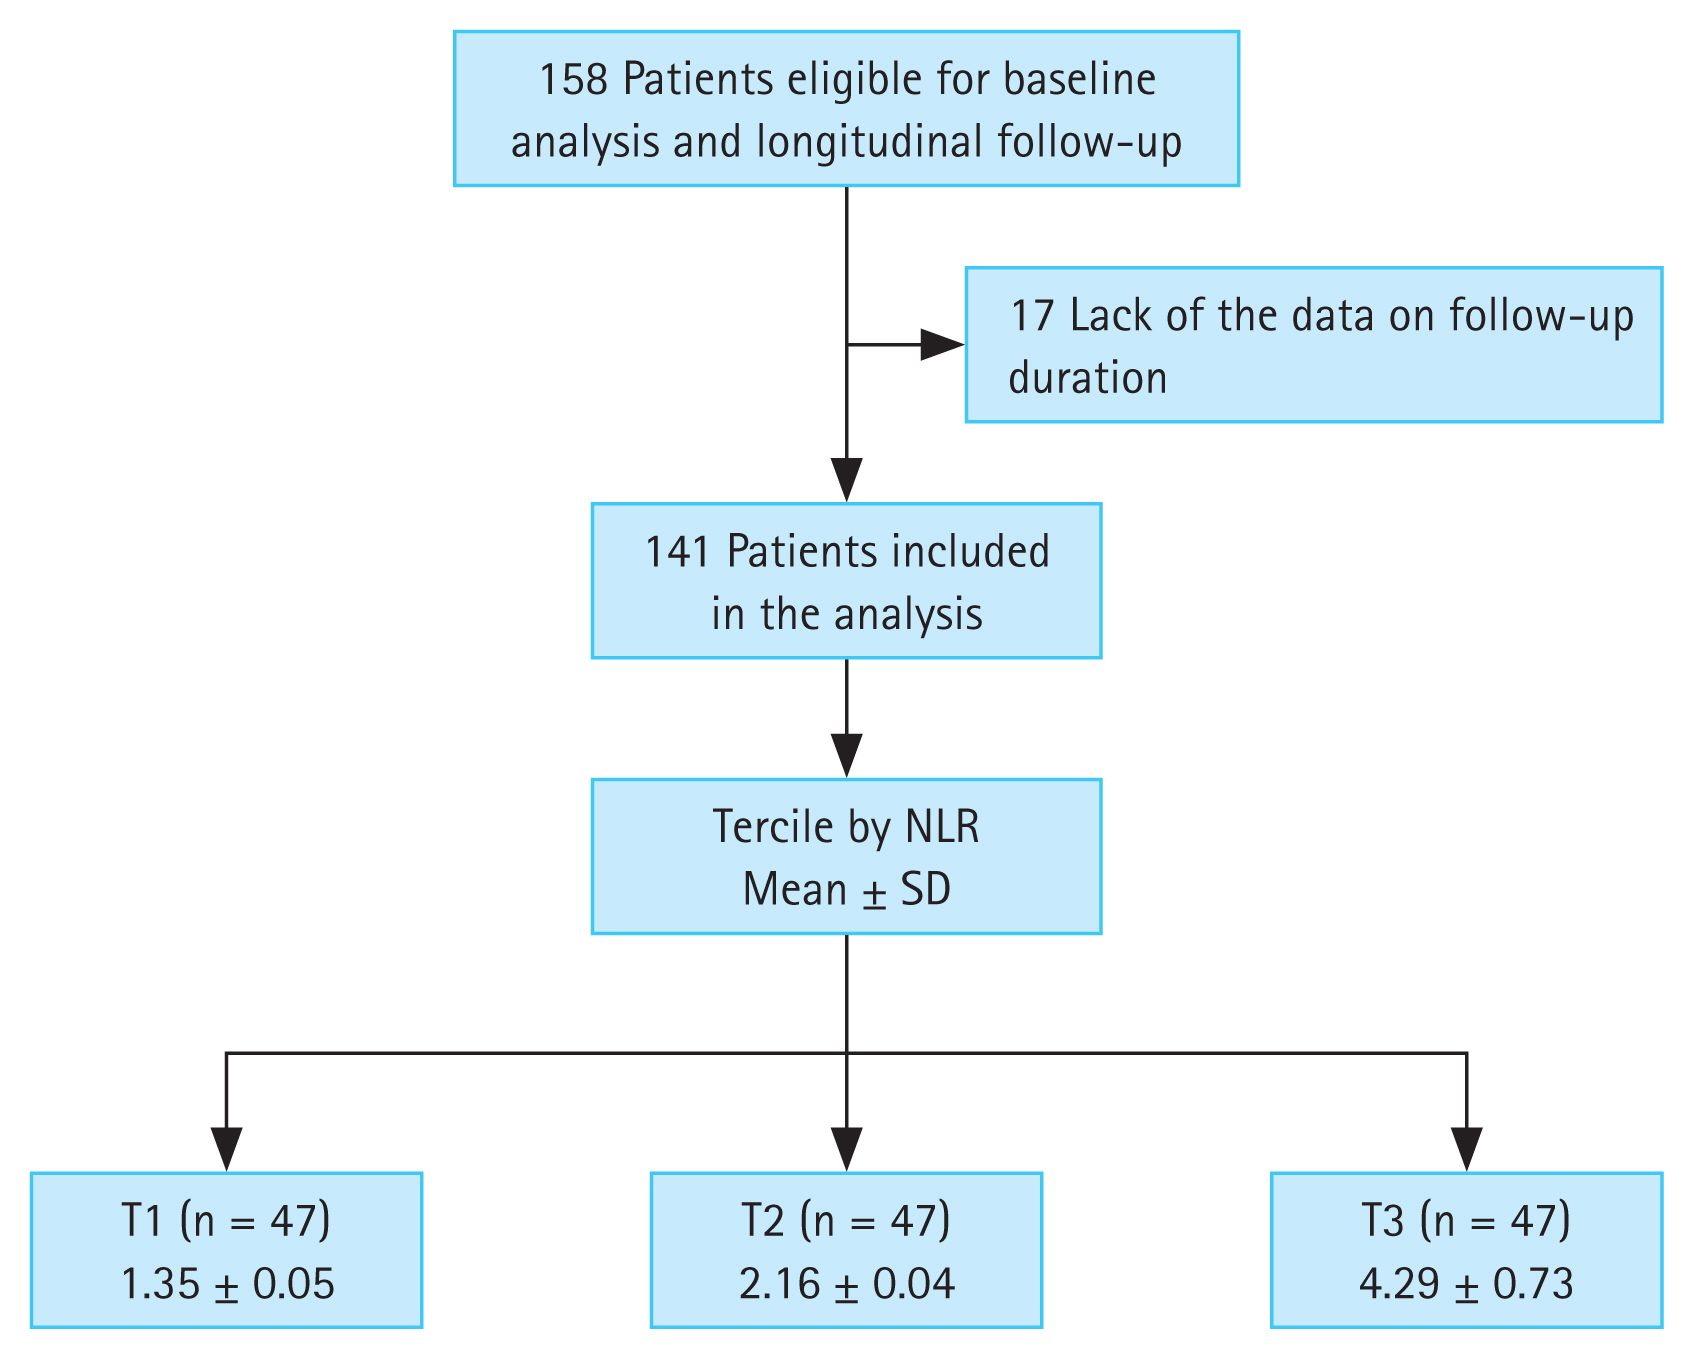
Flow diagram of the study participants. NLR, neutrophil-to-lymphocyte ratio; SD, standard deviation; T1, 1st tercile; T2, 2nd tercile; T3, 3rd tercile.
All procedures performed in the participants were in accordance with the ethical standards of the institutional and national research committees at which the studies were conducted and with the 1964 Helsinki Declaration and its later amendments or comparable ethical standards. The study protocol was approved by the Institutional Review Board (approval number: CNUH-2022-407). As this study was a retrospective study, informed consent was not obtained from the patients.
Study definitions and endpoints
This study investigated the predictive value of the NLR for CKD progression. NLR was analyzed at the day of enrollment and calculated by dividing the number of neutrophils by the number of lymphocytes. To examine the association between high NLR and adverse outcomes, the patients were divided into terciles (T1, T2, and T3) according to their NLR values.
Demographic details, such as age, sex, smoking status, and comorbid diseases, were obtained from the CNUH electric medical record database. Smoking status was classified as never, former, or current smoker. Anthropometric data, including height and weight, were collected at enrollment. Body mass index (BMI) was calculated as the initial body weight divided by the height squared (kg/m2). Blood pressure and venous samples, including baseline hemoglobin, albumin, total cholesterol, low-density lipoprotein (LDL) cholesterol, high-density lipoprotein (HDL) cholesterol, triglyceride, fasting glucose, hs-CRP and creatinine levels, were also obtained from the CNUH electric medical record database. The estimated glomerular filtration rate (eGFR) was calculated using the Chronic Kidney Disease Epidemiology Collaboration equation [13]. Proteinuria was measured by the amount of protein in the 24-h urine or the spot urine protein/creatinine ratio in patients whose 24-h urinary protein result was not present. The age-adjusted Charlson Comorbidity Index (ACCI) incorporates age as a correction variable for the final score by adding one point for every decade over 40 years of age [14]. CKD stages were determined using eGFR according to the Kidney Disease Improving Global Outcomes guidelines [15].
The primary outcome of interest was composite kidney event, which included a decline of kidney function (decline of eGFR of at least 50%) or initiation of renal replacement therapy (RRT) during follow-up periods. The secondary outcome was all-cause mortality during follow-up periods.
Statistical analyses
Continuous variables are expressed as means ± standard deviations. Categorical variables (e.g., smoking status) are expressed as number of participants and percentage. All patients were divided into three groups in accordance with the tercile values of the absolute NLR. According to the absolute NLR values, the patients were classified as T1 (n = 47, NLR 1.35 ± 0.05), T2 (n = 47, NLR 2.16 ± 0.04), and T3 (n = 47, NLR 4.29 ± 0.73) (Fig. 1). Significant differences among the three NLR groups were examined using the chi-squared test for categorical data and the Wilcoxon rank-sum test for nonparametric data. Multivariate linear regression models were analyzed to elucidate the associations between NLR and other clinical parameters. The results of multivariate linear regression models were presented as β coefficient estimate and 95% confidence intervals (CIs). We investigated whether a high NLR was related to the composite endpoints by applying the Cox proportional hazards model when defining a lowest NLR group (T1) as a reference. The results of the Cox proportional hazard models were presented as hazard ratios (HRs) and 95% CIs. Statistical significance was defined as p value < 0.05. Data were analyzed using IBM SPSS statistical analysis software for Windows (version 22.0; IBM Corp., Armonk, NY, USA).
RESULTS
Baseline characteristics of the study population
Table 1 shows the baseline characteristics according to NLR groups. The median age of the 141 patients (86 males and 55 females) in this study was 56.47 years (range, 26–74 y). The median follow-up duration was 5.45 years.

Baseline characteristics of the study participants according to NLR
The three groups did not differ in terms of age, sex, ACCI score, smoking status, BMI, systolic blood pressure (SBP), or diastolic blood pressure. Laboratory findings showed that hemoglobin, albumin, total cholesterol, LDL-cholesterol, HDL-cholesterol, and hs-CRP levels were not significantly different among the groups. The amount of proteinuria and creatinine levels were highest in the participants with the highest NLR and lowest in the participants with the lowest NLR. In contrast, eGFR was lowest in the participants with the highest NLR and highest in the participants with the lowest NLR. Nineteen patients (13.5%) had CKD stage 1, 20 (14.2%) had CKD stage 2, 60 (42.6%) had CKD stage 3, and 42 (29.8%) had CKD stages 4 and 5. Patients with advanced CKD (stage ≥ 3b) were more commonly distributed in the T3 group than in the T1 group.
Multivariate linear regression analysis was performed to analyze the association between variables (containing covariates with p < 0.05 in a univariate analysis, Table 1) and NLR, but there was no correlation between the independent variables and NLR (Table 2).
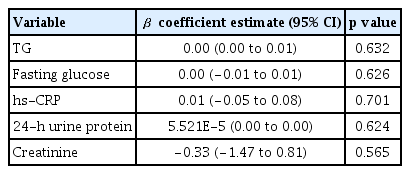
Multivariate linear regression analysis to evaluate the association between independent variables and the NLR
Association between NLR and the primary outcome
To address the association between NLR and composite kidney events, Kaplan–Meier survival was analyzed using NLR (Fig. 2). Multivariate Cox models after sequential adjustments confirmed this association, and Model 4 was fully adjusted (Table 3). The incidence rate of composite kidney events, which included decline in kidney function (decline in eGFR of at least 50%) or initiation of RRT, was significantly higher in the T3 group (26 of 47 patients, 55.3%) than in the T1 group (8 of 47 patients, 17.0%) (HR, 4.34; 95% CI, 1.88–10.02; p = 0.001) (Fig. 2A, Table 3; Model 1). In the fully adjusted model, the HR between T3 and T1 was 3.33 (95% CI, 1.43–7.76; p = 0.005) (Table 3; Model 4).
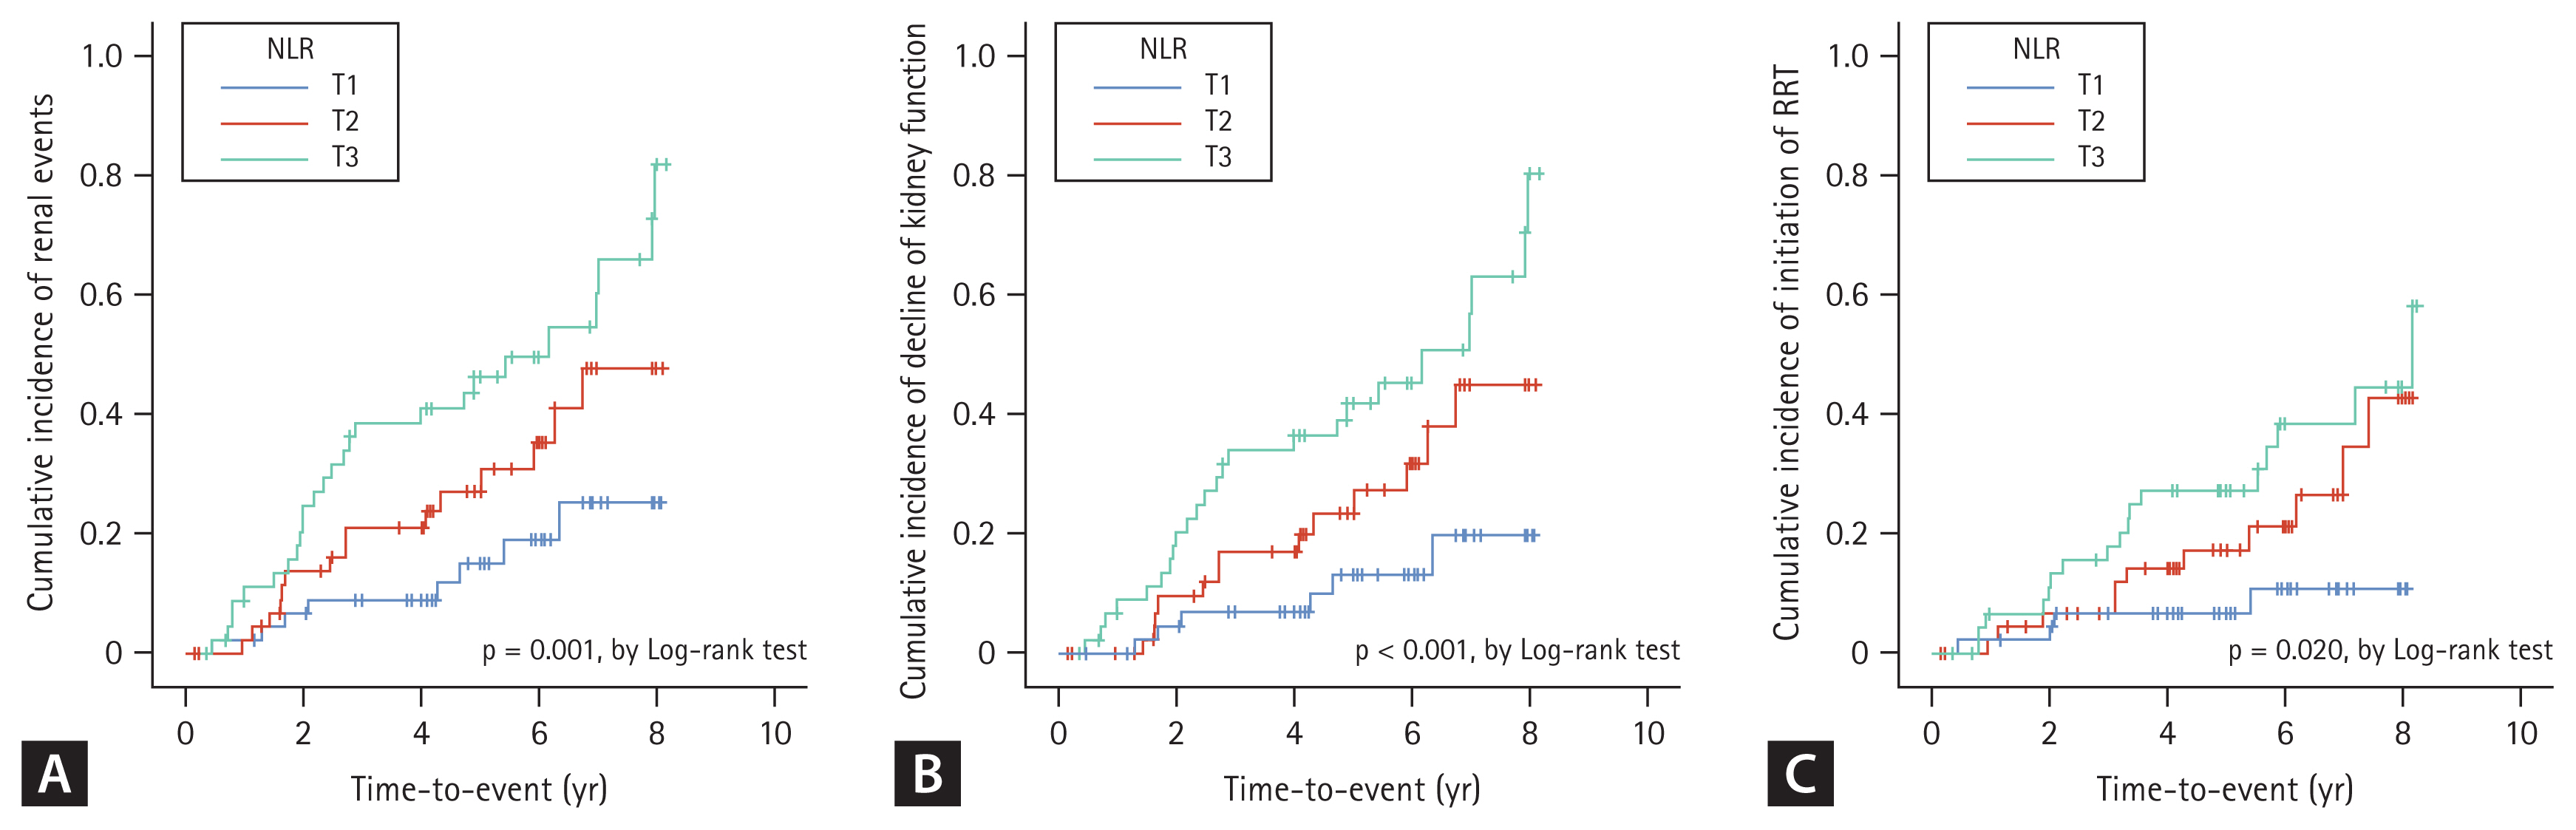
Kaplan–Meier survival curve for cumulative incidence of renal events by NLR. (A) Cumulative incidence of renal events according to NLR. (B) Cumulative incidence of decline of kidney function according to NLR. (C) Cumulative incidence of initiation of RRT according to NLR. NLR, neutrophil-to-lymphocyte ratio; RRT, renal replacement therapy; T1, 1st tercile; T2, 2nd tercile; T3, 3rd tercile.
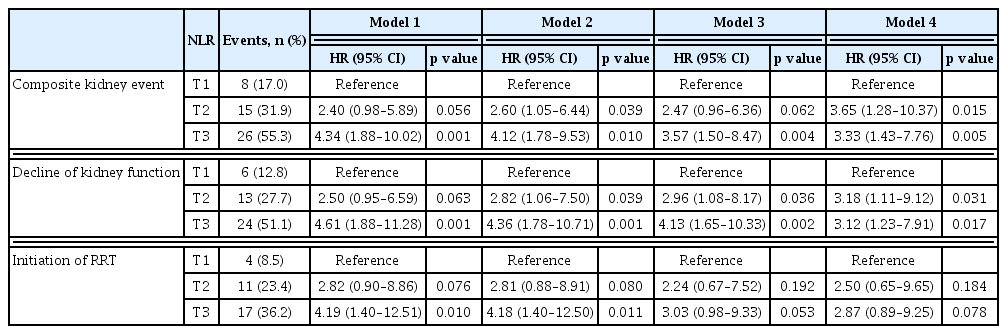
HR for the primary outcome according to NLR
The incidence rate of the primary outcome components is shown in Fig. 2B and C. In the unadjusted model, the incidence rate of decline in kidney function and initiation of RRT was higher in the T3 group than in the T1 group (HR, 4.61; 95% CI, 1.88–11.28; p = 0.001 and HR, 4.19; 95% CI, 1.40–12.51; p = 0.010) (Fig. 2B, C, Table 3; Model 1). However, in a fully adjusted model, the decline in kidney function was associated with high NLR (HR, 3.12; 95% CI, 1.23–7.91; p = 0.017), but the initiation of RRT was not associated with high NLR (HR, 2.87; 95% CI, 0.89–9.25; p = 0.078) (Table 3; Model 4).
Association between NLR and the secondary outcome
There was no significant between-group difference in the incidence of all-cause mortality (5 of 47 patients, 10.6%, in the T3 group and 2 of 47 patients, 4.3%, in the T1 group; HR, 2.11; 95% CI, 0.41–10.89; p = 0.373) (Fig. 3, Table 4; Model 1). In addition, in the fully adjusted model, the HR between T3 and T1 was 3.13 (95% CI, 0.52–18.90; p = 0.213) (Table 4; Model 4).

Kaplan–Meier survival curve for cumulative incidence of all-cause mortality according to NLR. NLR, neutrophil-to-lymphocyte ratio; T1, 1st tercile; T2, 2nd tercile; T3, 3rd tercile.
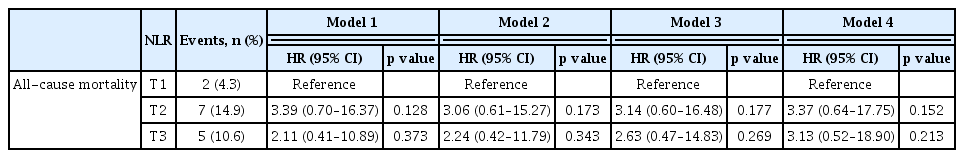
HR for the secondary outcome according to NLR
DISCUSSION
In this study, we evaluated 141 patients with CKD for a possible association between CKD progression and NLR, which is an indicator of inflammation. Patients who had higher NLR level had higher proteinuria, higher creatinine level, lower eGFR, and higher frequency of advanced CKD (stages 3b to 5). In the Cox proportional hazards model, the higher NLR group had a higher incidence of composite kidney event, especially a decline in kidney function. The same result was shown in the fully adjusted model (age, sex, aged-adjusted CCI score, smoking status, BMI, SBP, serum creatinine level, and proteinuria). These results indicate that NLR reflects the status of a patient who may have more comorbidities within a more advanced stage of CKD and suggests that NLR can be a biomarker for predicting CKD progression. However, there was no difference for the incidence rate of initiation of RRT and mortality among the NLR groups because the number of participants was remarkably small and the follow-up period was significantly short.
Several studies have shown that NLR is an important indicator of inflammation in patients with CKD [11,12,16]. An et al. [16] showed that NLR levels were higher in patients on peritoneal dialysis (PD) than in healthy counterparts and found that cardiovascular and all-cause mortality was higher in patients on PD with higher NLR and CRP levels. In our study, CRP levels were higher in the T2 and T3 groups than in T1 group, but the difference in CRP levels between the T2 and T3 groups was not significant. Moreover, multivariate linear regression models showed no correlation between CRP and NLR levels. Okyay et al. [12] showed that the NLR levels of patients on PD, on hemodialysis, and with predialytic CKD were higher than that of healthy controls. They also showed that the NLR levels were positively correlated with other inflammatory markers, such as hs-CRP and IL-6 levels, and negatively correlated with serum albumin levels [12]. Another study revealed that higher TNF-α levels in patients with end-stage kidney disease (ESKD) were associated with higher NLR levels [2]. However, this study is different from other studies in that patients with non-dialysis CKD were divided into NLR terciles for group comparison.
In addition, recent studies have suggested that NLR is an indicator of inflammation and a predictor of CKD progression. Kocyigit et al. [11] showed that patients with higher NLR levels had higher baseline hs-CRP levels and faster eGFR decline following the initiation of RRT. However, the study population was patients with stage 4 CKD, and patients with higher NLR levels and more rapid progression to ESKD had a lower baseline level of eGFR [11]. In addition, baseline kidney function was a key factor in reaching the endpoint of the study [11]. Tatar et al. [17] studied 165 patients aged > 65 years and found that the incidence rate of mortality and initiation of RRT were higher in patients who had increased NLR values over time. They also found that patients with eGFR < 29 mL/min/1.73 m2 had higher NLR values and higher rates of mortality and initiation of RRT [17]. This study certainly has a unique perspective as it involves patients with early-stage CKD, including CKD stage 1, and imposes no age restrictions. However, the diverse distribution renal function among patients may act as bias.
The present study has some limitations. First, the study participants were recruited at a single regional hospital; thus, the selection of patients was limited, and the sample size was small. Second, the study population comprised only Korean patients, and whether these findings can be generalized to other ethnic groups is unknown. A larger and multinational cohort study will be required to avoid study bias and to analyze a more accurate association between NLR level and kidney function decline in patients with CKD. Third, a single initial measurement of the NLR at enrollment may not provide sufficient accuracy for predicting kidney outcomes, and multiple measurements over a defined period of time may offer more accurate predictive value. Finally, and importantly, the retrospective nature of our study poses inherent limitations. This design may have introduced confounding variables and potential biases due to incomplete data. Notably, retrospective studies cannot establish causality, but rather associations. In spite of these limitations, our findings provide valuable insights into the potential role of NLR in predicting CKD progression and should stimulate further studies in this field.
In conclusion, a higher NLR level is associated with higher proteinuria, higher serum creatinine level, lower eGFR, and higher frequency of advanced CKD. Consequently, the high NLR reflects the more advanced stage of CKD and suggests a role for NLR as a biomarker for predicting CKD progression.
KEY MESSAGE
1. An elevated NLR is associated with increased proteinuria, elevated serum creatinine level, and reduced eGFR.
2. Higher NLR values may indicate a more advanced stage of CKD. Therefore, NRL can be a potential biomarker for predicting CKD progression.
Notes
Conflicts of interest
The authors disclose no conflicts.
CRedit authorship contributions
Jim Kim: methodology, investigation, data curation, formal analysis, writing - original draft, visualization; Su Hyun Song: methodology, data curation; Tae Ryom Oh: investigation, data curation, formal analysis, validation, software; Sang Heon Suh: data curation, validation, writing - review & editing, visualization; Hong Sang Choi: validation, software, writing - review & editing, visualization; Chang Seong Kim: formal analysis, software, writing - review & editing, supervision; Seong Kwon Ma: validation, writing - review & editing, visualization, supervision; Soo Wan Kim: validation, writing - review & editing, visualization, supervision; Eun Hui Bae: conceptualization, resources, writing - review & editing, supervision, project administration, funding acquisition
Funding
This research was supported by the Basic Science Research Program through the National Research Foundation of Korea (NRF) grant funded by the Korea government, MSIT (NRF-2019R1A2C1003971) and by a grant (BCRI22040) of Chonnam National University Hospital Biomedical Research Institute.