Long-term cardiovascular events in hypertensive patients: full report of the Korean Hypertension Cohort
Article information

Abstract
Background/Aims
This study evaluated the long-term cardiovascular complications among Korean patients with hypertension and compared them with that of controls without hypertension.
Methods
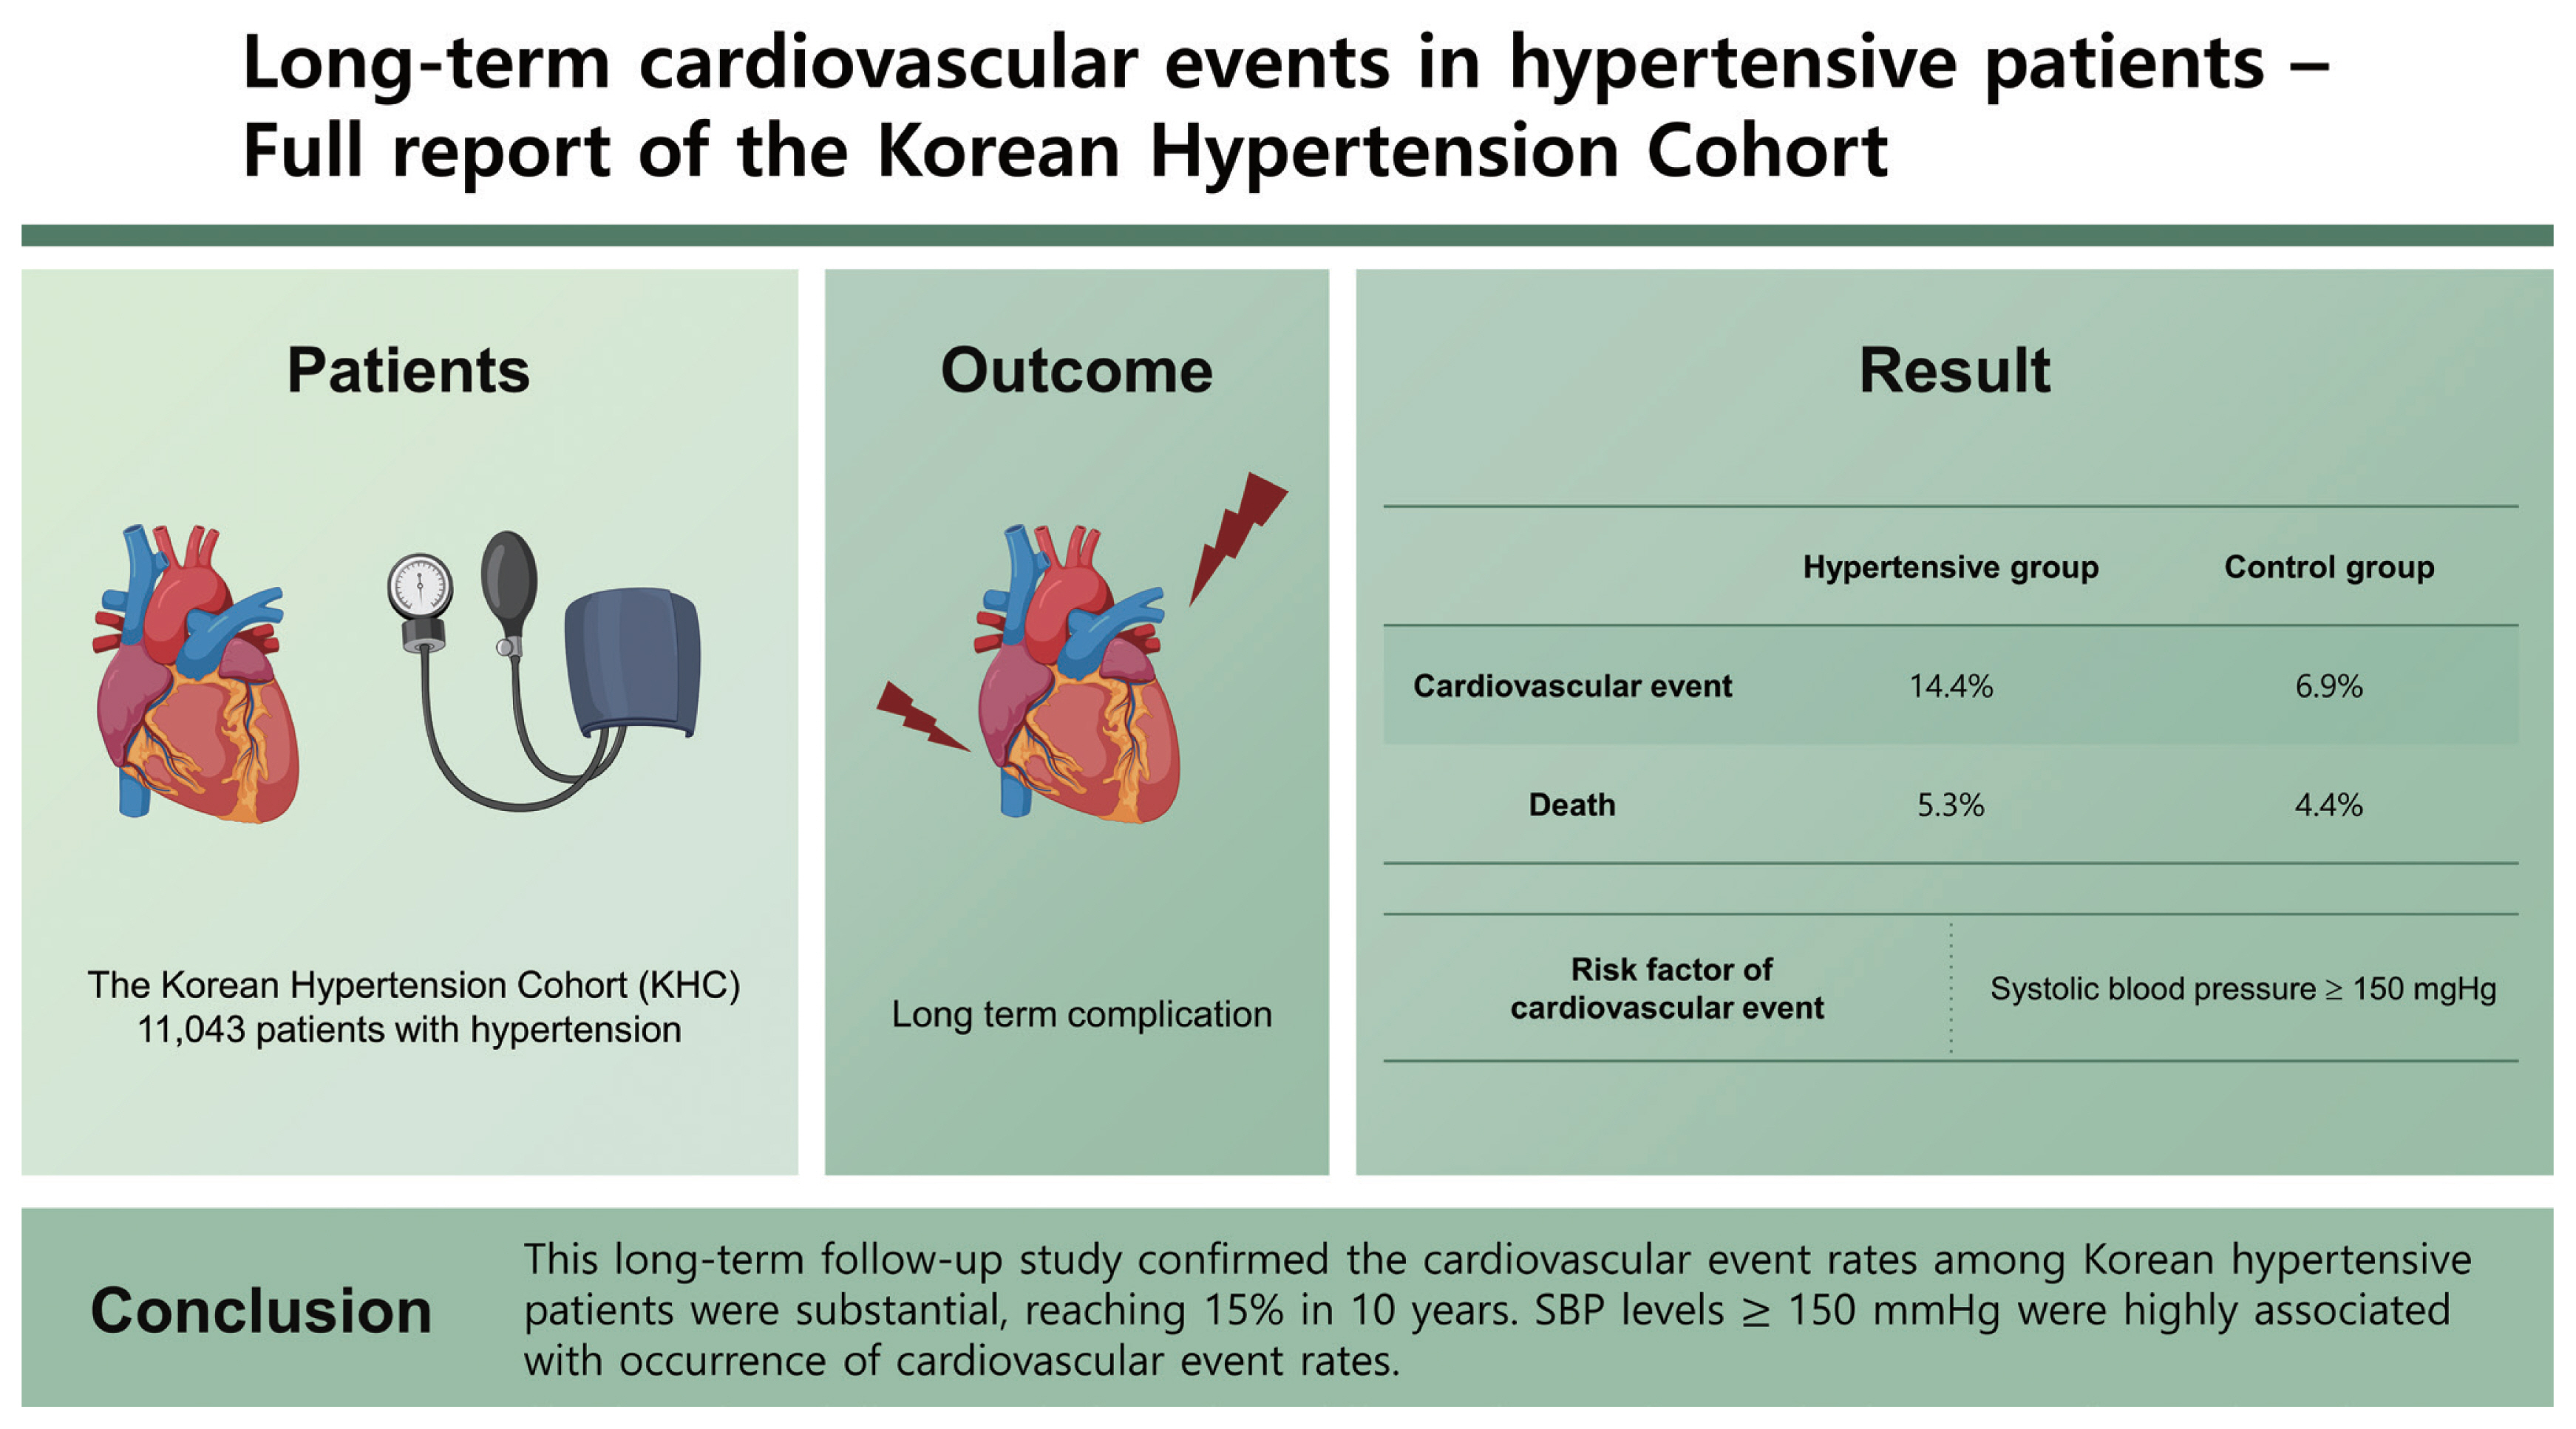
The Korean Hypertension Cohort (KHC) enrolled 11,043 patients with hypertension and followed them for more than 10 years. Age- and sex-matched controls without hypertension were enrolled at a 1:10 ratio. We compared the incidence of cardiovascular events and death among patients and controls without hypertension.
Results
The mean age was 59 years, and 34.8% and 16.5% of the patients belonged to the high and moderate cardiovascular risk groups, respectively. During the 10-year follow-up, 1,591 cardiovascular events (14.4%) with 588 deaths (5.3%) occurred among patients with hypertension and 7,635 cardiovascular events (6.9%) with 4,826 deaths (4.4%) occurred among controls. Even the low-risk population with hypertension showed a higher cardiovascular event rate than the population without hypertension. Although blood pressure measurements in the clinic showed remarkable inaccuracy compared with those measured in the national health examinations, systolic blood pressure (SBP) ≥ 150 mmHg was significantly associated with a higher risk of cardiovascular events.
Conclusions
This long-term follow-up study confirmed the cardiovascular event rates among Korean hypertensive patients were substantial, reaching 15% in 10 years. SBP levels ≥ 150 mmHg were highly associated with occurrence of cardiovascular event rates.
INTRODUCTION
Hypertension is the most significant contributors to cardiovascular disease [1]. In a large-scale pooled cohort study of an Asian population, hypertension was a significant risk factor for stroke and ischemic heart disease [2]. After the success of intensive blood pressure (BP) control in the Systolic Blood Pressure Intervention Trial (SPRINT), hypertension guidelines emphasize strict BP control for maximal cardiovascular prevention [3–5]. A meta-analysis by the Blood Pressure Lowering Treatment Trialists’ Collaboration even suggested no ‘floor level’ for reducing BP [6,7]. However, recent report in the Antihypertensive and Lipid-Lowering Treatment to Prevent Heart Attack Trial (ALLHAT) study suggested that low diastolic blood pressure (DBP) under 80 mmHg might increase coronary events [8]. Elderly hypertensive patients enrolled in clinical trials, such as Hypertension in the Very Elderly Trial (HYVET) and Strategy of Blood Pressure Intervention in the Elderly Hypertensive Patients (STEP) trials, were relatively healthy, therefore low DBP associated with stiff blood vessels did not exert remarkable influence in outcomes [9,10]. However, large pulse pressure and isolated systolic hypertension is frequently observed in the real-world situation, which hinders intensive systolic blood pressure (SBP) lowering [11]. Therefore, real-world evidences are necessary to confirm the findings of clinical trials especially the optimal SBP/DBP combinations. Additionally, the differences in ethnicity and healthcare resources and the development of new medications affect the results of hypertension control.
Therefore, we designed the Korean Hypertension Cohort (KHC) study to integrate detailed clinical and long-term follow-up data from six national tertiary hospitals and the National Health Insurance System-health screening (NHIS-HEALS) system. We primarily aimed to evaluate the incidence of cardiovascular events and death according to the SBP/DBP combinations and also compared these with data of controls without hypertension.
METHODS
Study design and data collection
The KHC study enrolled 11,043 patients with hypertension who visited tertiary university hospitals for the first time and was had hypertension as a primary diagnosis from 2006 to 2011. The study design has been published previously [12]. The primary composite outcome of this study was all cause death and major cardiovascular events including heart failure, myocardial infarction, peripheral arterial disease, hemorrhagic stroke, ischemic stroke, and end stage renal disease. Moreover, sample size was calculated based on the risk reduction of SPRINT to determine the role of intensive BP lowering compared to conventional BP control, although the target BP goals were modified from those in the SPRINT [13].
The eligibility criteria included patients with hypertension who were regularly followed up at least three times out of four time points (1, 2–6, 7–12, 13–24 months) for a minimum of 2 years with laboratory evaluation and prescribed antihypertensive medications. Exclusion criteria were described in the design paper [12]. We followed up using 2-year hospital records linked with the NHIS-HEALS data from 2004 to 2018.
Furthermore, the study also included a control population without hypertension at a 1:10 ratio (100,000 persons) from the NHIS-HEALS sample cohort sex- and age-matched case-to-case [14]. Hypertension was excluded by filtering the primary and additional disease codes. Among the NHIS-HEALS sample cohort, the control population was selected according to the patients who underwent the national health examination more than twice to sufficiently compare cardiovascular risk factors. The flow diagram of the KHC is summarized in Fig. 1.

Flow diagram of Korean Hypertension Cohort. NHIS-HEALS, National Health Insurance System-health screening; NHE, National health examination.
The entire analysis process of the linked data sources was conducted in the NHIS data analysis office. External exportation of the data and additional extraction of personal information were not permitted. The authors are restricted from sharing the data underlying this study because The Korean NHIS owns the data. The study protocols were reviewed and approved by the Institutional Review Boards of each participating hospital, including the coordinating center (Seoul National University Hospital H-1810-056-977; Seoul National University Bundang Hospital B-1901-519-409). The dataset was anonymized to the researchers by the NHIS and the requirement for informed consent was waived.
Definition of cardiovascular diseases and risk factors
Hypertension was defined as an SBP/DBP ≥ 140/90 mmHg without antihypertensive treatment or taking antihypertensive treatment. Clinical cardiovascular diseases, subclinical organ damage, and cardiovascular risk factors were defined according to the 2018 Korean Society of Hypertension guidelines for the management of hypertension [15]. The high cardiovascular risk group was defined as patients with clinical cardiovascular disease, chronic kidney disease, or diabetes mellitus. The moderate cardiovascular risk group was defined as patients with increased vascular stiffness, left ventricular hypertrophy, or metabolic syndrome excluding diabetes mellitus. Increased vascular stiffness was defined as the presence of atherosclerotic plaques, increased pulse wave velocity, or a decreased ankle-brachial index. The low cardiovascular risk group was defined as patients who did not belong to either the high or moderate risk groups. For the NHIS claim data analysis, operational definitions of cardiovascular diseases were followed as in Choi [16].
Blood pressure measurement
BP was primarily measured by clinicians using mercury sphygmomanometers more than twice after 3 to 5 minutes of rest using standard technique. Clinic BP data were collected at baseline, and after 1, 2–6, 7–12, and 13–24 months. If the patients visited multiple times during each time interval, BP values most adjacent to the time point (1, 6, 12, 24 months) were collected. Furthermore, BP measured in the NHIS-HEALS was collected at years 3 and 5 if hypertensive patients received a national health examination. If the examination results at years 3 and 5 were unavailable, the average BP values at the 2-year interval were collected.
Statistical analysis
The baseline characteristics, including demographics, physical and laboratory findings, risk factors, and management are presented as frequencies and percentages or means and standard deviations. Clinical characteristics between the hypertensive patients and non-hypertensive controls were compared using the chi-squared test for categorical variables and Student’s t test for continuous variables. The incidence rates were estimated using the total number of outcomes during the follow-up. For the cardiovascular outcome evaluation, we used a Cox proportional risk model between-group comparisons. Hazard ratios (HRs) and their corresponding 95% confidence intervals (CIs) were calculated from Cox proportional hazards analysis. Time to occurrence of the cardiovascular events was analyzed using Kaplan-Meier curves [17]. Comparisons were considered statistically significant if two-tailed p values were less than 0.05. Statistical analyses were performed using SAS version 9.4 (SAS Institute, Cary, NC, USA).
RESULTS
Baseline characteristics of the cohort
The baseline characteristics of the cohort population according to hypertension status are shown in Table 1. The mean age was 59 years, 50.6% of the patients were male, 30.4% received no previous hypertension treatment, and 34.8%, 16.5%, and 48.7% belonged to the high, moderate, and low cardiovascular risk groups, respectively (Supplementary Table 1). The initial BP was 148.0 ± 18.5/88.0 ± 15.4 mmHg. The average number of antihypertensive medications was 1.82 ± 0.90 tablets per day. Calcium channel blockers and angiotensin receptor blockers were prescribed to nearly 60% of the hypertensive population, and 34% were prescribed statins and aspirin. In the control group without hypertension, the initial BP was 121.0 ± 15.4/78.0 ± 10.0 mmHg.
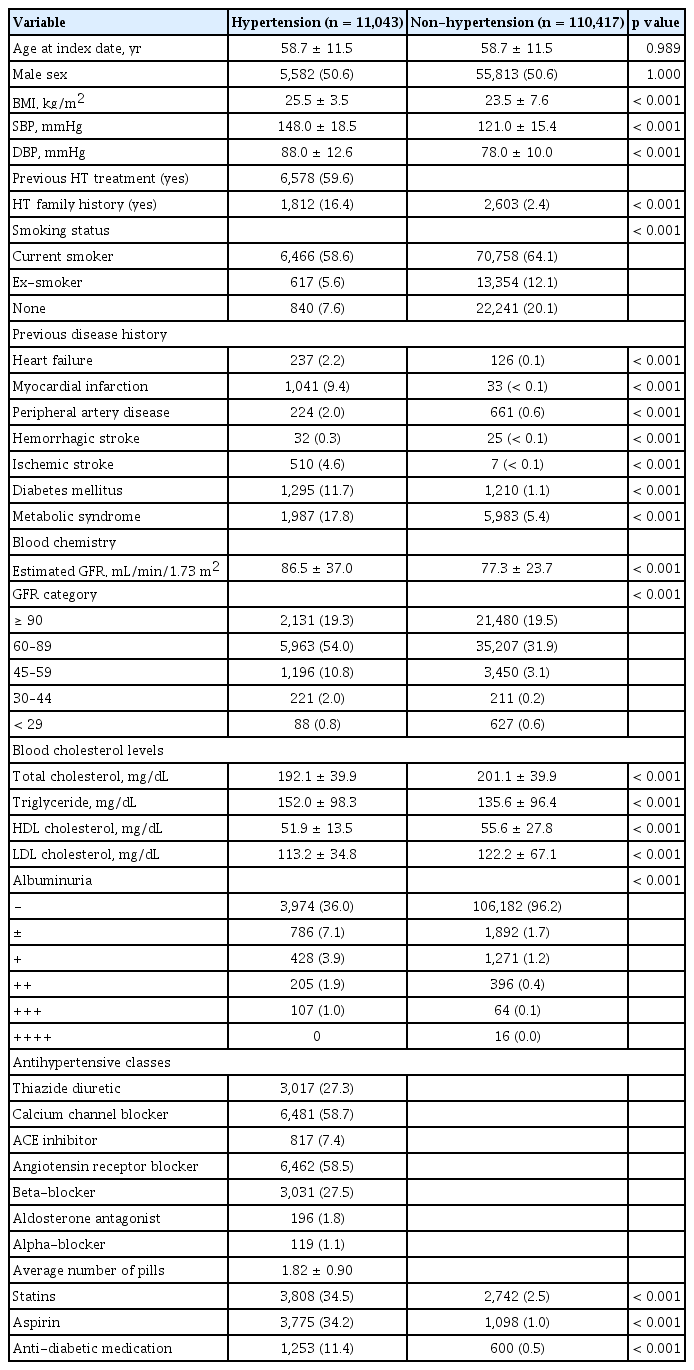
Baseline characteristics
Cardiovascular events according to hypertension status
A total of 1,591 cardiovascular events (14.4%) with 588 deaths (5.3%) in the population with hypertension and 7,635 cardiovascular events (6.9%) with 4,826 deaths (4.4%) in the control group without hypertension occurred during a follow-up period of 10.0 years (3,529 ± 790 days in the population with hypertension and 3,567 ± 570 days in the control group without hypertension) (Table 2). Cardiovascular event rates in the population with hypertension were more than twice those in the population without hypertension (Supplementary Table 2). The HR was the greatest within 1 year (5.61; 95% CI, 4.83 to 6.52) but was maintained at 5 years (HR, 2.75; 95% CI, 2.59 to 2.93) and 10 years (HR, 1.85; 95% CI, 1.77 to 1.93) of follow-up (Supplementary Table 3). All individual cardiovascular events invariably occurred at a higher rate in the population with hypertension (Fig. 2, Supplementary Table 4) than in the controls. Furthermore, higher rates of cardiovascular events and death were associated with a higher cardiovascular risk at baseline (Table 2), and even the low-risk population with hypertension showed a higher cardiovascular event rate than the population without hypertension. Two-year and 5-year cardiovascular event rates are presented in Supplementary Tables 5 and 6.
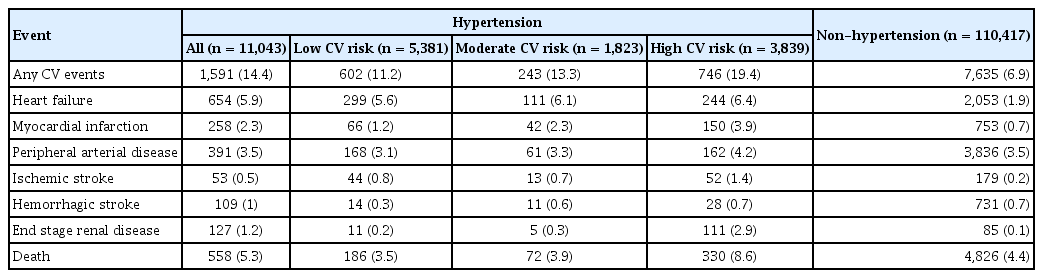
Ten-year CV events according to the baseline cardiovascular risk
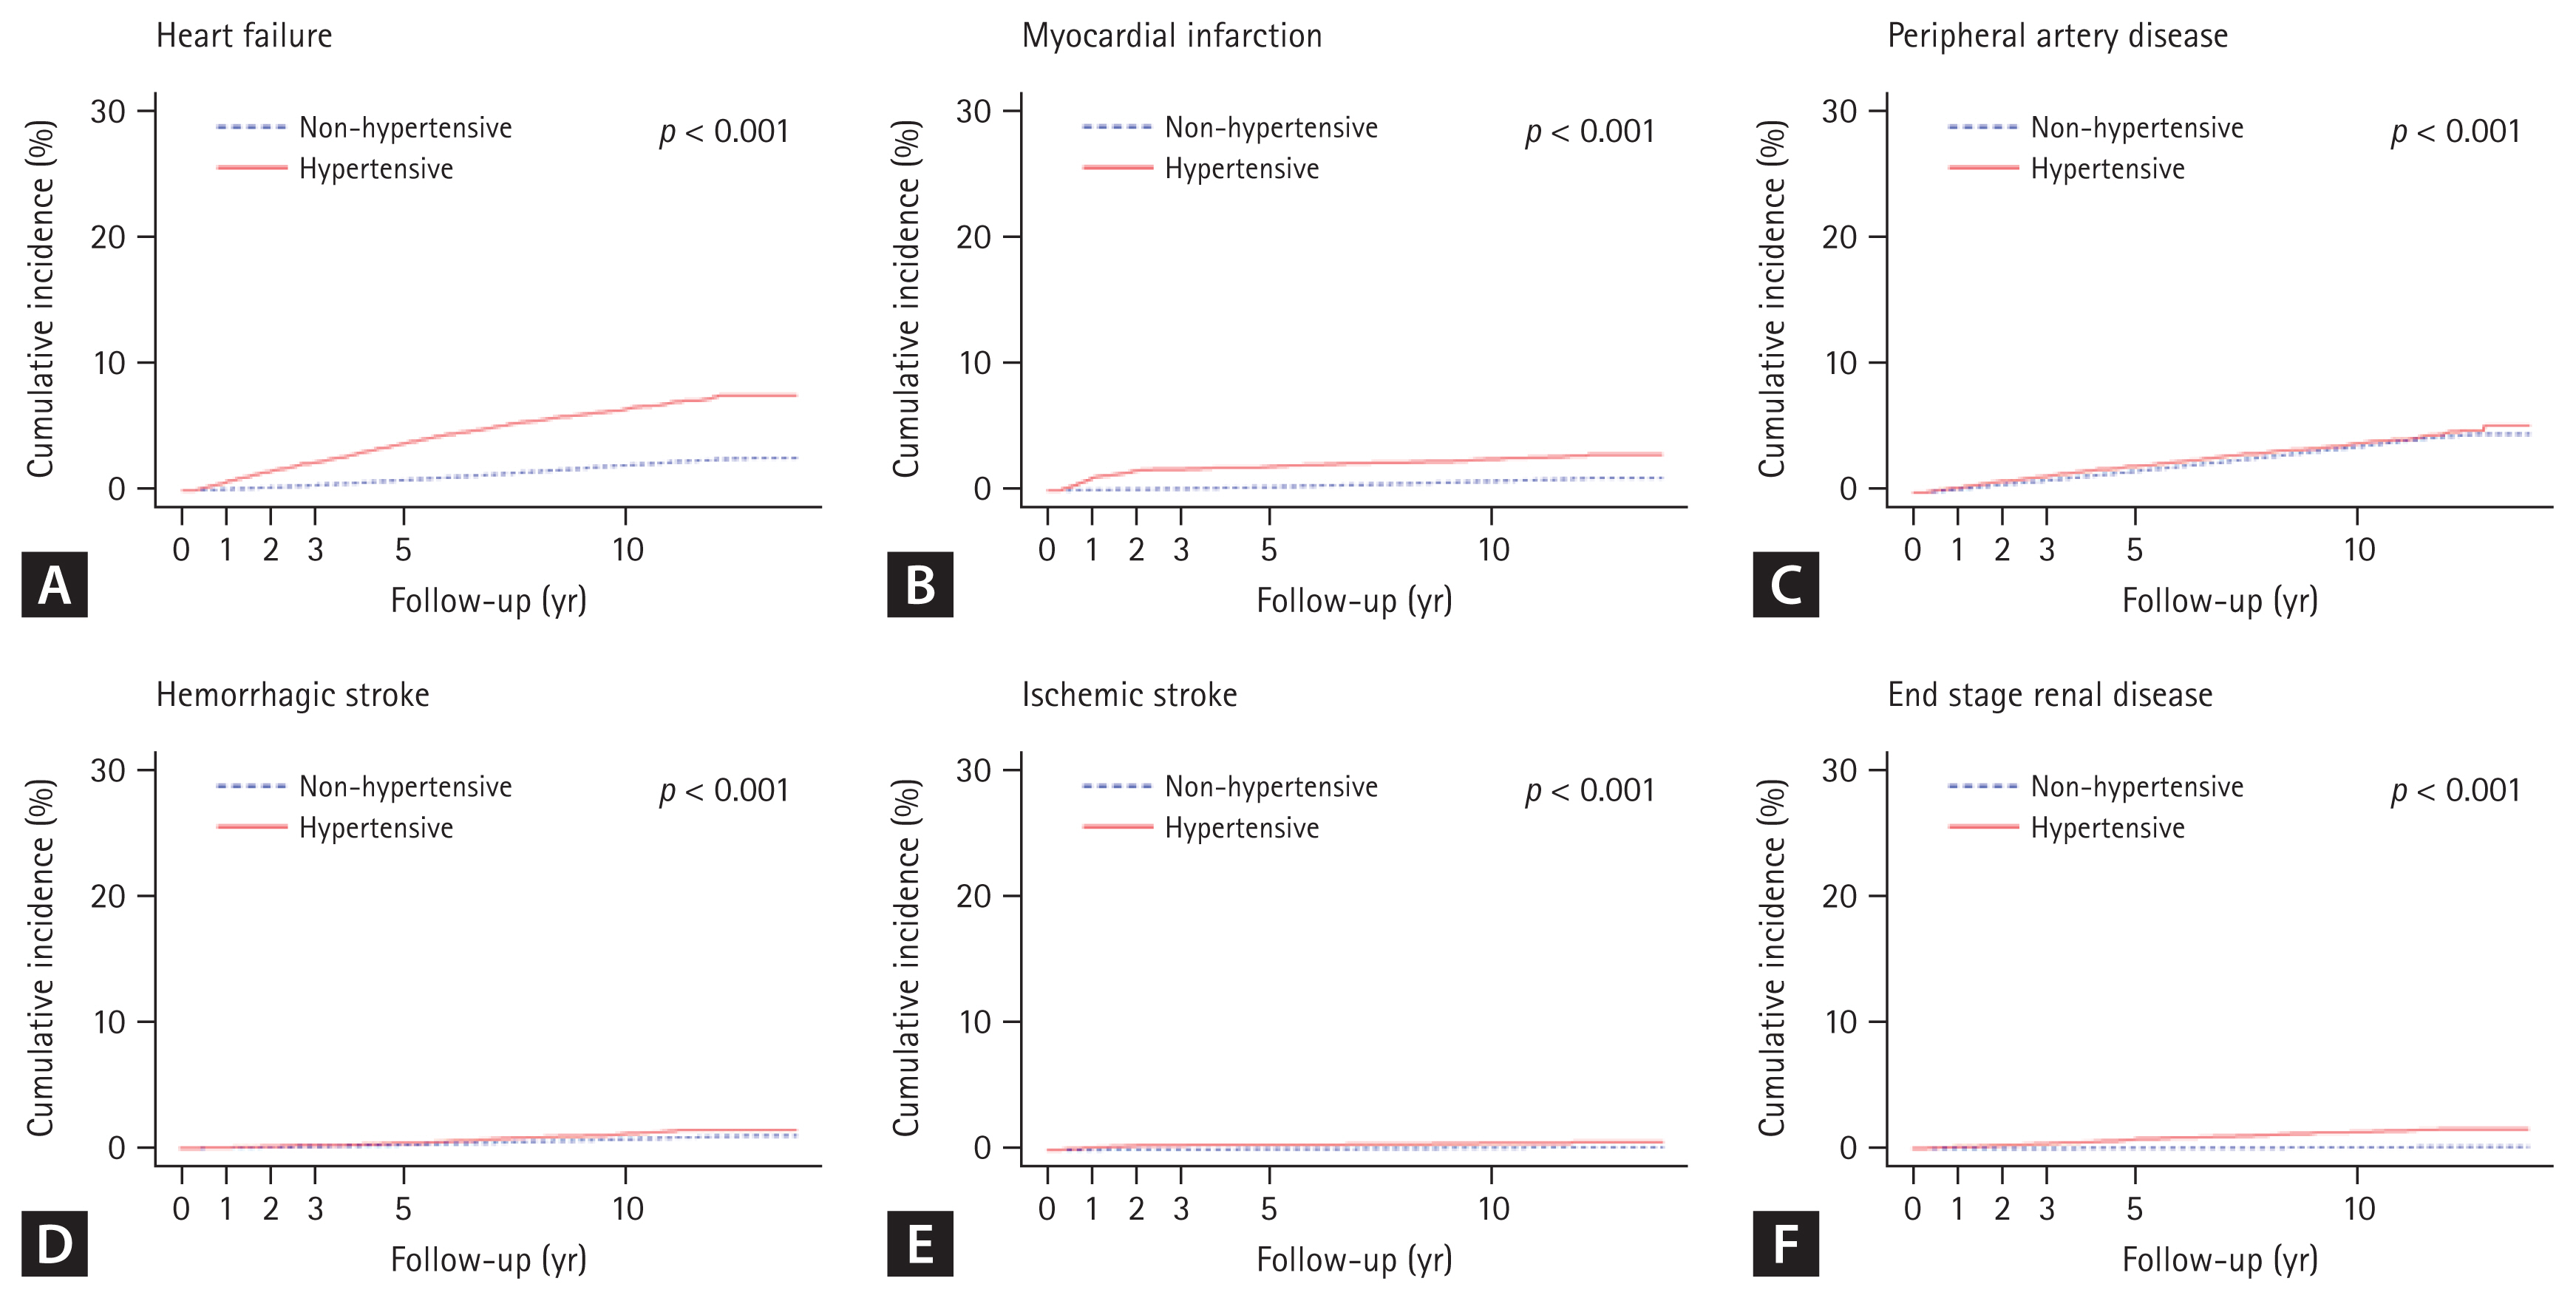
Cumulative incidence of cardiovascular events in the hypertensive group and non-hypertensive controls. (A) Heart failure. (B) Myocardial infarction. (C) Peripheral arterial disease. (D) Hemorrhagic stroke. (E) Ischemic stroke. (F) End stage renal disease.
Blood pressure changes during follow-up
To minimize the measurement error in the clinic setting, we averaged the BP measurements after 6 months to 2 years of follow-up (6 months, 1 year, and 2 years). BPs in the population with hypertension continuously decreased during 2 years of hospital data follow-up and the NHIS-HEALS data follow-up after that. Most reductions in SBP and DBP occurred in the first 6 months and maintained thereafter. SBP were decreased from 149.4 ± 18.4 to 130.6 ± 13.8 mmHg and DBP were decreased from 88.6 ± 12.5 to 78.0 ± 9.0 mmHg, significantly (Supplementary Fig. 1A). There was no significant difference in BP reduction between men and women (Supplementary Fig. 1B). However, younger aged groups showed consistently higher BP throughout the study period, although the BP difference between age groups reduced (Supplementary Fig. 1C). Remarkably, SBP was reduced in similar levels across cardiovascular risk groups. However, DBP was lower in the high-risk group compared with the lower risk groups, although the extent of DBP reduction was greater in the lower risk group than that of the high-risk group (Supplementary Fig. 1D). Overall, 79% of hypertensive patients had controlled their SBP below 140 mmHg after 6 months of the enrollment (Supplementary Table 7). After 2 years of hospital data follow-up, we observed that SBP and DBP consistently decreased in the NHIS-HEALS data (Supplementary Fig. 2). A total of 1,649 (15%) patients with hypertension received the NHIS-HEALS adjacent within 3 months of the clinic BP measurement at year 2. Therefore, we could indirectly compare the difference between the clinic BP and the NHIS-HEALS BP. Interestingly, in the BP range 130–139/80–89 mmHg, the clinic and NHIS-HEALS BP were almost identical. However, in the higher BP ranges, the clinic BP tended to be higher, and in the lower BP ranges, BP tended to be in a lower range than those recorded in the NHIS-HEALS (Supplementary Fig. 3).
Cardiovascular events according to BPs in patients with hypertension
Next, we evaluated the incidence of cardiovascular events according to clinic BPs after 6 months of enrollment. The patients with hypertension were initially divided into six SBP groups of < 120, 120–129, 130–139, 140–149, 150–159, and ≥ 160 mmHg and into DBP groups of < 60, 60–69, 70–79, 80–89, 90–99, and ≥ 100 mmHg (Supplementary Tables 7 and 8). However, the lowest and highest groups were small in number. Therefore, we merged the two lowest groups and the two highest groups creating four SBP and four DBP groups for the analysis. Interestingly, age was positively correlated with SBP but showed a negative correlation with DBP. In the unadjusted survival analysis, higher SBP ≥ 150 mmHg was associated with a higher rate of cardiovascular events. SBP of 140 to 149 mmHg showed a modestly higher incidence of combined cardiovascular events and death than the lower two SBP groups (Fig. 3A–3C). In contrast, lower DBP (< 70 and 70–79 mmHg) was significantly associated with a higher rate of cardiovascular events than the higher two DBP groups (Fig. 3D–3F). Then, we analyzed the incidence of cardiovascular events according to pulse pressure quintiles. Although the largest pulse pressure group showed higher event rates, the difference between each pulse pressure groups were not clearly demarcated compared with SBP or DBP groups (Supplementary Fig. 4). Because SBP and DBP are not independent values in each individual, we presented the cardiovascular event rates as 16 combinations of SBP and DBP groups. In subgroup analysis, the combined effect of SBP and DBP on cardiovascular events was higher in the elderly, the high-risk hypertension patients than the non-elderly, and the moderate to low-risk hypertension patients, respectively (Fig. 4).

The combined effect of systolic and diastolic blood pressure on cardiovascular events. (A) Major cardiovascular events or death according to systolic blood pressure (SBP) categories. (B) Major cardiovascular events according to SBP categories. (C) Death according to SBP categories. (D) Major cardiovascular events or death according to diastolic blood pressure (DBP) categories. (E) Major cardiovascular events according to DBP categories. (F) Death according to DBP categories. aStatistically significant difference compared with other groups (p < 0.001).
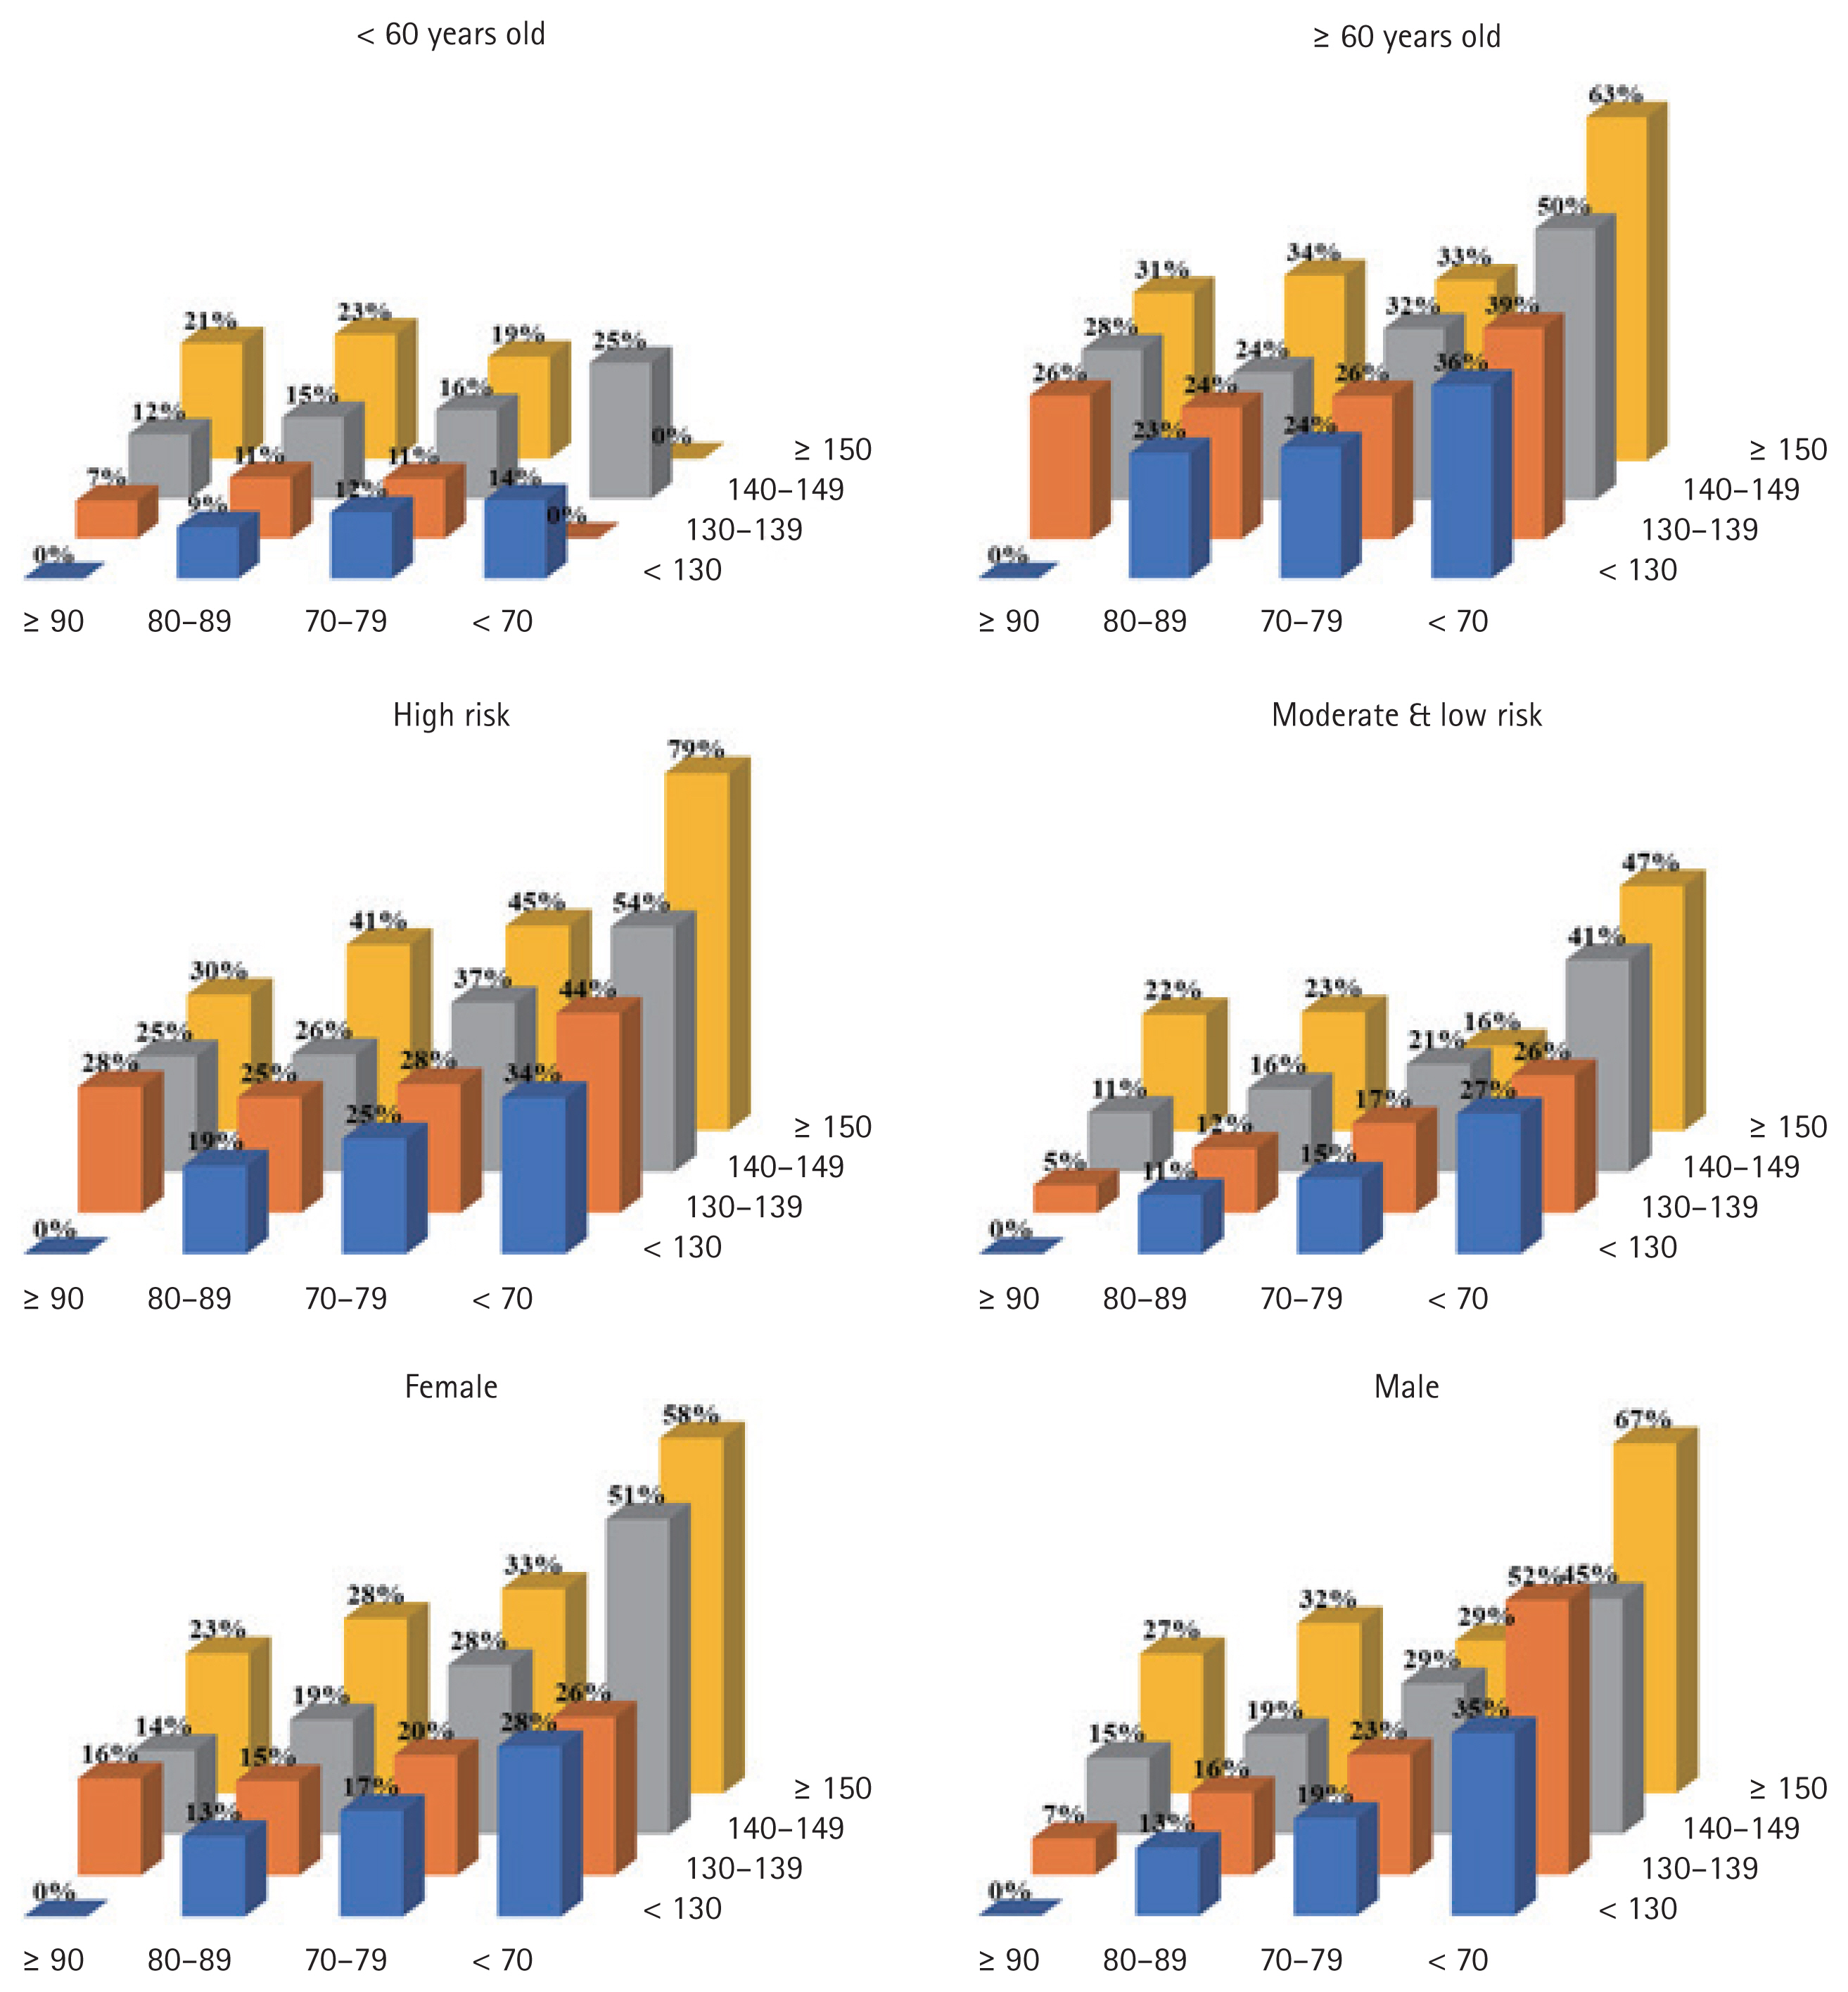
Combined effect of systolic and diastolic blood pressure on cardiovascular events according to age, gender, and blood pressures.
DISCUSSION
We presented the actual burden of cardiovascular complications in hypertensive patients through large-volume, long-term follow-up. Cardiovascular event rates among Korean hypertensive patients were substantial, reaching 15% in 10 years of follow-up. Event rates in the hypertensive patients were more than twice those in the population without hypertension, and a higher rate of cardiovascular events was associated with a higher cardiovascular risk at baseline. Even the low-risk population with hypertension showed a higher cardiovascular event rate than the population without hypertension. Although clinic BP measurement in the real-world showed remarkable inaccuracy compared with those measured in the national health examinations, higher SBP ≥ 150 mmHg had a distinctively higher risk than lower SBP groups. Our results provide valuable information to fill the gap between the published clinical guidelines and real-world practice in hypertensive patients.
Regarding, the remarkable findings in hypertension-induced cardiovascular event of this study, there are two points to consider. First, the event rate in the Korean population was higher than expected. Some may still consider that lean, less diabetic Asian hypertensive patients might be less susceptible to cardiovascular complications; however, this has been proven untrue. However, the event rates observed in this KHC were no less than those in Western cohorts [18]. A previous report from the Asia Pacific Cohort Studies Collaboration compared cardiovascular complications associated with hypertension between Asian populations and Caucasians living in Asia [19]. In particular, the burden of stroke is higher than that of ischemic heart disease among the morbidity and mortality of CVD in Korea, along with other Asian countries [20,21]. Such data is opposite from European countries where coronary heart disease occupies a higher prevalence than stroke [22,23]. A previous study by Park et al. [24] suggested that hypertension showed a significant increase in odds ratio in overall cerebrovascular disease and its subtypes than other risk factors in the Korean population. Thus, it can be interpreted that the influence of hypertension on cardiovascular diseases is bigger than Western countries. Second cardiovascular events occurred soon after diagnosis of hypertension. Recently, many guidelines and long-term follow-up studies emphasize early BP control in high-risk hypertensive patients. The primary evidence came from the Valsartan Antihypertensive Long- Term Use Evaluation (VALUE) trial comparing valsartan- and amlodipine-based regimens in high-risk patients [25]. Early BP control within 6 months after enrollment was a powerful determinant of almost all endpoints. Moreover, immediate responders defined as those with lowered SBP by ≥ 10 mmHg at 1month had significant advantages for combined cardiac events, stroke, and death. Similar findings were reported in the UK primary care research database [26]. SBP > 150 mmHg, time to treatment intensification > 1.5 months and follow-up interval > 2.7 months were all associated with higher event rates. These results suggest that significant complications can occur in high-risk groups soon after the diagnosis of hypertension.
Another remarkable finding of this study is that the risk of cardiovascular events was significantly higher in patients with SBP ≥ 150 mmHg but only a modest increase was shown in those with a SBP 140 to 149 mmHg compared with those with SBP < 140 mmHg. This finding may conflict with the results of intensive BP lowering in SPRINT [27,28]. The leading cause of this difference probably stems from the measurement methods of BP; the KHC collected the hospital BP data, predominantly measured by clinicians in the office during usual care. BP measured during usual care was higher than that measured strictly following the guidelines by about 12/6 mmHg [29], and this same tendency was also observed in this study. In the BP range of 130–139/80–89 mmHg, the usual clinic and the NHIS-HEALS BP which followed the standard method were almost identical. However, in the higher BP ranges, the clinic BP tended to be higher by 12/8 mmHg [30]. Considering that SBP measured by the automated BP measurement method was substantially lower than routine office SBP by 5 to 15 mmHg [31], the findings of this study were not discordant with those of SPRINT, which was similarly observed in a population study based on the NHIS-HEALS sample cohort and the UK primary care research database [26]. Indeed, in the subgroup analysis, high-risk or male patients with SBP < 130 mmHg showed lower cardiovascular event rates than those with SBP in the 130 to 139 mmHg range.
Interestingly, lower DBP < 70 mmHg was significantly associated with a higher incidence of cardiovascular events regardless of SBP, and a DBP of 70–79 mmHg showed a modestly higher incidence of cardiovascular events than higher DBP. Especially if the patients’ SBP values were in the hypertensive range (≥ 140 mmHg), those with DBP < 70 mmHg showed remarkably high cardiovascular event rates. Because SBP and DBP are not independent values in each person, the decision to reduce BP further if SBP is in the 140 to 149 mmHg range but DBP is in the 70 to 79 mmHg range remains challenging. The findings of this study suggested that further reduction might not be beneficial in older, high-risk, and male patients if DBP decreased below 70 mmHg [32]. Similar patterns were observed in the ON-going Telmisartan Alone and in combination with Ramipril Global Endpoint Trial (ONTARGET) and Telmisartan Randomized AssessmeNt Study in ACE iNtolerant subjects with cardiovascular Disease (TRANSCEND) trials with an increased risk for myocardial infarction and hospital admission for heart failure [33]. A recent analysis from the ALLHAT study similarly reported the same results in coronary events, although there was no J-curve between stroke risk and SBP or DBP [8]. Of course, there is still a debate as to whether the J-curve is the result of reverse causation or unobserved residual confounding [34]. However, it may be true that hypertensive patients with low DBP have a higher risk. The main mechanism is coronary perfusion occurring during diastole, thus impaired with low DBP [35]. Nevertheless, if DBP remained in the 70 to 79 mmHg range, those subgroups also showed the benefit of further SBP lowering. Notably, a more prominent observer error in the lower BP ranges is possibly related to interpreting the Korotkoff sounds [36,37]. Therefore, in isolated systolic hypertension, clinicians should accurately measure DBP for optimal management. We think that the results of this study more accurately reflect everyday clinical situations than those of SPRINT. Therefore, if BP was not measured strictly following the correct method, intensive BP lowering might cause adverse effects due to over-treatment, which is frequently observed when applying evidence from clinical trials to real-world clinical settings without meticulous patient monitoring [38]. Although a recent meta-analysis again confirmed the key role of BP lowering in cardiovascular prevention irrespective of baseline BP, we do not agree with the suggestion that the need for and the burden of exact BP measurement is reduced [6]. We believe that precise BP measurement especially DBP in a clinic situation, facing high patient burden in a limited time, is important for maximizing the benefits of lowering BP.
Limitations
First, the KHC is not a clinical trial but a patient cohort that used linked patients’ hospital data and NHIS-HEALS data. Therefore, patient assessments, management, and follow-up regimens were not standardized and varied between the included institutions. Notably, the BP measurement methods were not standardized but followed the values from each hospital. Moreover, although we performed the multivariate analysis to minimize the confounding factors, we cannot rule out the possibility that errors from non-random allocations may affect the analysis results, such as those regarding the optimal visit intervals. Second, we only registered patients from six national university hospitals, which are therefore tertiary clinics, because the current Korean Personal Information Protection Act permits only data linking national hospitals and NHIS-HEALS data.
Moreover, moderate to high-risk hypertensive patients were targeted for enrollment to obtain sufficient outcome data for a limited follow-up period; however, we planned to follow the patients for 10 years to the best of our ability. Therefore, the KHC did not represent the general Korean population with hypertension. As a results, the cardiovascular events rate observed in this cohort might be higher than the actual event rates in general hypertensive patients in Korea. However, the event rate was separately presented according to the patient’s cardiovascular risk level, which might be equally applicable to community clinics. Furthermore, most enrolled hypertensive patients were gradually referred back from the tertiary hospital to community clinics during follow-up. Therefore, the treatment results may be more affected by the patient’s intrinsic risk rather than differences in treatment patterns in tertiary hospitals, if present.
Conclusion and perspectives
The KHC study provides important information on the long-term outcomes according to the patients’ BP and cardiovascular risk. Our study shows that the cardiovascular event rates among Korean hypertensive patients were substantial, reaching 15% in 10 years of follow-up. Although clinic BP measurement in the real-world showed remarkable inaccuracy compared with those measured in the national health examinations, higher SBP ≥ 150 mmHg presented significantly higher cardiovascular events. Several ancillary studies using the KHC are now underway, which will ultimately help establish HT management strategies reflecting Asian ethnic characteristics.
KEY MESSAGE
1. Cardiovascular event rates among Korean hypertensive patients were substantial, reaching 15% in 10 years.
2. Even the low-risk population with hypertension showed a higher cardiovascular event rate than the population without hypertension.
3. Systolic blood pressure levels over 150 mmHg were highly associated with occurrence of cardiovascular event rates.
Acknowledgments
This study was supported by the Ministry of Health and Welfare (grant number NA20-001 to HYL). This research was supported by the National Evidence-based Healthcare Collaborating Agency (NECA) and the Korean Society of Hypertension. We declare no competing interests.
Notes
No potential conflict of interest relevant to this article was reported.