Neuromuscular blocking agents and opioids are major risk factors for developing pressure injuries in patients in the intensive care unit
Article information

Abstract
Background/Aims
Patients in the intensive care unit (ICU) are at high risk for developing pressure injuries, which can cause severe complications and even increase the mortality risk. Therefore, prevention of pressure injuries is most important. In this study, we investigated the risk factors of pressure injury development in patients admitted to the ICU.
Methods
We retrospectively analyzed patients ages > 18 years admitted to the medical ICU in a tertiary hospital between January and December 2019. We collected patient baseline characteristics, medications received, mechanical ventilation or hemodialysis use, laboratory findings, and date of pressure injury onset and characteristics.
Results
We analyzed 666 patients who did not have pressure injuries at ICU admission. Pressure injuries developed in 102 patients (15%). The risk of pressure injury development increased as the administration days for neuromuscular blocking agents (NMBAs; odds ratio [OR], 1.138; p = 0.019) and opioids (OR, 1.084; p = 0.028) increased, and if the patient had problem with friction and shear (OR, 2.203; p = 0.011).
Conclusions
The prolonged use of NMBAs and opioids can increase the risk of pressure injury development. Because these medications are associated with immobilization, using both should be minimized and patient early mobilization should be promoted. Among the Braden subscales, “friction and shear” was associated with the development of pressure injuries in ICU patients.

INTRODUCTION
Pressure injuries, also known as “pressure ulcers,” are lesions of the skin or mucosa and underlying tissues that are caused by external pressure [1,2]. Patients in the intensive care unit (ICU) are known to have a high risk for developing pressure injuries [3]. In a recent, large-scale, 1-day point prevalence study, the prevalence of ICU-acquired pressure injuries was 16.2% in 1,117 ICUs in 90 countries worldwide [4]. Once these pressure injuries occur, they are difficult to cure and can prolong hospitalization stay, increase health care costs, cause complications such as infection and pain, and lower patient quality of life [5–7]. Recently, an increase in mortality has been reported in patients who had developed pressure injuries during ICU admission; the mortality rate increased even more in patients who had a higher stage of ulcer [4,8]. Therefore, screening high-risk patients and preventing pressure injury development are important. Factors such as age, sex, hemodynamic instability, vasopressor use, albumin level, disease severity, ICU length of stay, mechanical ventilation, nutrition deficiency, and immobilization can affect pressure injury development [9–12]. With regard to the relationship between nutritional status and the development of pressure injury, a recent prospective observational study has shown that the achievement of calorie and protein goals in the first 72 hours of ICU admission may confer a protective effect against pressure injuries in critically ill patients [13,14].
The Braden scale, which was not designed for ICU patients, is widely used to predict pressure injury development in hospitalized patients, including those in the ICU. By this model, high-risk patients receive more intensive care to prevent ulcer development [15–18]. The Braden scale consists of six subscales that evaluate a patient’s sensory perception, activity level, mobility, nutrition status, skin exposure to moisture, and friction and shear forces [19]. However, many studies have reported that this scale has poor predictive validity for screening high-risk ICU patients [15,20,21]. In particular, according to the recent systematic review and meta-analysis of the value of pressure injury risk assessment scales, the Braden scale was not the best risk assessment tool in critically ill patients [22].
Some reports have indicated that the duration of mechanical ventilator use is related to the increased risk of pressure injury development, mainly due to patients’ immobilization [3,23,24]. However, other factors can increase immobilization, such as medication. Therefore, in this study we identify the risk factors for the development of pressure injury in ICU patients, especially the influence of mechanical ventilation and the medications that sedate or paralyze patients.
METHODS
Study patients
We conducted this retrospective cohort study at a single-center tertiary hospital in Korea. We collected all the patients ages 18 years or older who were admitted to the medical ICU from January to December 2019. Among 825 patients, we enrolled 666 patients in the study, excluding those whose pressure injury was confirmed at the time of admission or the next day after. We enrolled only the case of the first ICU admission per patient.
Prevention and management guidelines
The guidelines for the prevention and management of pressure injuries used in this center are as follows. The Braden scale consists of 6 subscales with a total score of 23. Patients with pressure injury scores of < 18 were classified in the high-risk group. The ICU nurses evaluated and recorded the Braden scale at least three times a day, once per duty shift, after evaluating for the first time at admission for every patient. Patients in the high-risk group received preventive nursing activities, including assessing and managing the patient’s skin conditions, repositioning the patient every 2 hours and using air cushions for pressure redistribution, providing nursing incontinence care, and educating about and encouraging the following of the prevention guidelines. Patients who already had developed pressure injuries were reported to the attending physician and, if necessary, consulted to the relevant departments, including the advanced practice wound/ostomy/continence nurses. In addition, the ICU nurse evaluated and classified the location, stage, and size of the pressure injury according to the National Pressure injuries Advisory Panel (NPUAP) clinical guidelines, re-evaluating them daily [6].
Data collection
We compared the patients who developed pressure injuries to those who did not. We collected the following patient data from electronic medical records: age; sex; height, weight, body mass index (BMI) and body surface area; dates of hospital and ICU admission and discharge; date of death; medications received during ICU stay (e.g., vasopressors, sedatives, opioids, neuromuscular blocking agents [NMBAs], steroids); mechanical ventilator and continuous renal replacement therapy application during ICU stay; date of pressure injury diagnosis; ulcer size, location, and stage; details of the nursing intervention; Braden scale scores; blood pressure, pulse, and respiratory rates; temperature; percutaneous oxygen saturation; Glasgow Coma Scale score; Richmond Agitation Sedation Scale (RASS) score; muscle strength; and serial values of hemoglobin, albumin, white blood cells, blood urea nitrogen, creatinine, and C-reactive protein.
Statistical analysis
Variables are presented either as means with standard deviations or medians with an interquartile range, as appropriate. We used the Student’s t test to compare the continuous variables and the chi-square or Fisher’s exact tests to compare the categorical variables. We used multivariable logistic regression analysis to identify the risk factors correlated with the development of pressure injury. We deleted the covariate with the highest p value repeatedly until only 10 covariates remained with p values less than 0.15. Following that, we performed a multivariable logistic regression analysis with just 10 covariates that had a reasonable relationship with pressure injury. We compared the areas under the receiver operating characteristic (AUROC) curves to predict ulcer development among the Braden scale and a simplified Braden scale. All p values were two tailed; p values of < 0.05 were considered statistically significant. We used SPSS version 25.0 (IBM Corp., Armonk, NY, USA) and MedCalc (MedCalc Software Inc., Mariakerke, Belgium) for all statistical analyses.
Ethical statement
The study protocol was reviewed and approved by the Institutional Review Board of the Asan Medical Center (IRB 2020-0112), which waived the requirement for informed consent because of the retrospective nature of this study.
RESULTS
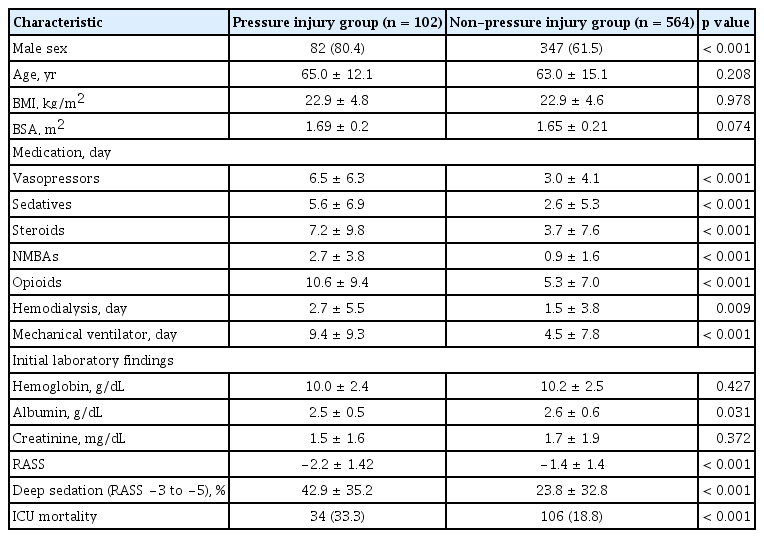
Of the 666 patients, 102 (15%) developed pressure injuries during their ICU stay, and 564 patients did not (Table 1). When comparing the patients with and without pressure injuries, the proportion of men were higher (80.4% vs. 61.5%, p < 0.001) in the pressure injury group. No differences in age and BMI occurred between the two groups. The mean administration days of vasopressors (6.5 days vs. 3.0 days), sedatives (5.6 days vs. 2.6 days), steroids (7.2 days vs. 3.7 days), NMBAs (2.7 days vs. 0.9 days), and opioids (10.6 days vs. 5.3 days) were longer in the pressure injury group (all p < 0.001). In addition, the mean days of hemodialysis (2.7 days vs. 1.5 days, p = 0.009) and mechanical ventilator use (9.4 days vs. 4.5 days, p < 0.001) were longer in the pressure injury group. At the time of admission, albumin level (2.5 vs. 2.6, p = 0.031) was slightly lower in the pressure injury group, but hemoglobin, and creatinine levels were not significantly different. The proportion of duration for which patients were in deep sedation (RASS, −3 to −5) during the entire ICU stay was significantly higher (42.9% vs. 23.8%, p < 0.001) and the ICU mortality rate (33.3% vs. 18.8%, p < 0.001) was higher in the pressure injury group.
Patient baseline characteristics
In the 102 patients with pressure injuries, the median time from ICU admission to ulcer development was 8 days (Table 2). The patients’ mean body weight on the day of development decreased by 1.3 kg from the day of admission. A total of 84.3% developed one pressure injury during ICU stay, 12.7% of patients developed two pressure injuries, and 2.9% developed three pressure injuries. Among the 121 pressure injuries, the sacrococcygeal area was the most common site for ulcer development (72.7%). Among the 117 pressure injuries with information about the initial stage, stage II ulcers were the most common (45.3%), followed by deep-tissue injury (30.8%) at the time of diagnosis, and 14.0% were healed when the patients left the ICU (Supplementary Table 1).

Pressure injury characteristics of 102 patients
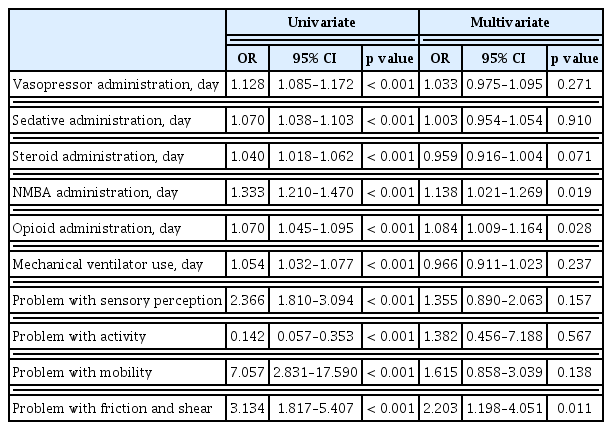
We used multivariate logistic regression analysis to analyze the factors influencing pressure injury development (Table 3). The risk of pressure injury development increased by 13.8% (p = 0.019) and 8.4% (p = 0.028) as the administration days of NMBAs and opioids increased. In addition, pressure injury development risk increased with patient had problem with friction and shear (odds ratio [OR], 2.203; p = 0.011).
Multivariate logistic regression analysis of risk for pressure injury development
When comparing the Braden scale scores between the groups with and without pressure injuries, the scores were not different at the time of ICU admission (13.5 vs. 14.0, p = 0.117), but the lowest score was significantly lower in the pressure injury group (9.6 vs. 12.0, p < 0.001) (Supplementary Table 2). We performed a multivariate logistic regression analysis for pressure injury development with six subscales of the Braden scale, identifying only three subscales (sensory perception, mobility, friction/shear) as risk factors (Supplementary Table 3). As compared with the original Braden scale, the simplified Braden scale using these three subscales showed similar predictive validity (AUROC, 0.732 vs. 0.712, p = 0.1227) (Table 4).

Performance of the original Braden scale and the simplified Braden scale
DISCUSSION
The prevalence of pressure injuries identified in this study was 15.0%, a finding similar to a recent a 1-day point prevalence study of 16.8% [4]. In our study, we identified that the risk of pressure injury development in ICU patients is related to the number of days of NMBA and opioid use. NMBAs often are used in addition to analgesics and sedatives for severe acute respiratory distress syndrome to achieve lung-protective ventilation, improve oxygenation, or maintain a prone position [25,26]. NMBAs are known to cause various adverse events, but studies about their effects on pressure injuries are rare [27]. Use of a mechanical ventilator has been reported to be a risk factor in previous studies [3,23,24]. However, in our study, mechanical ventilator use did not increase the risk of pressure injury development directly, but the administration of NMBAs was highly associated with development. This finding may be explained by patients’ immobilization and loss of sensory perception when receiving NMBAs. Physicians administer NMBAs in patients with hypoxemia or hemodynamic instability. However, whether hypoxemia and hypoperfusion influence localized pressure injury development is still controversial [28–31]. As NMBA use increases by 1 day, the development of pressure injuries increases by 14.0%.
Among the 102 patients who developed pressure injuries, 99 (97.1%) received cisatracurium, and the other three received vecuronium or rocuronium. Because cisatracurium is removed through Hofmann elimination without renal or hepatic metabolism, this drug does not have a cumulative effect [25]. However, amino steroidal drugs such as rocuronium and vecuronium do have cumulative effects, especially in hepatic or renal dysfunction. In the current study, only three patients received rocuronium and vecuronium for just 1 to 2 days, so we could not determine whether amino steroidal drugs have a greater effect on pressure injury development than does cisatracurium.
We also found that prolonged use of opioids increases the risk of the development of pressure injury, whereas sedatives did not. In this study, the mean total administration days for opioids and sedatives was 6.13 and 3.09 days, respectively, in which opioid use was doubled. Because a protocol-based, analgesia-first approach is recommended in patients with mechanical ventilation, the duration of opioid administration was lengthened, and the concentration also was increased to maintain proper RASS scores [32]. In addition, opioids themselves can reduce patients’ pain, discomfort, and sensory perception, thereby reducing mobility in the pressured area. Therefore, the effect of opioids rather than of sedatives on pressure injuries was increased. Proper pain management for patients is essential in the ICU, but long-term use is associated with pressure injuries. Therefore, active mobilization must be performed for patients with prolonged opioid use.
When we validated the Braden scale in this study, the AUROC was 0.712 (0.676 to 0.746), and the optimal cutoff point was 11. When the Braden scale was first reported in 1987, the model’s predictive sensitivity was 100%, and the specificity was 64% to 90% at the cut-off point of 16 [33]. When we set the cut-off point to 16 in this study, the sensitivity was 100%, but the specificity was 6.0%, which was extremely low. According to a meta-analysis by Wei et al. [18], in 11 studies that validated the Braden scale in ICU patients, the overall weighted area under the curve (AUC) was 0.7812 ± 0.0331, and the cut-off point was 11 to 18 points, which varied in each study. As such, the clinical applicability and optimal cut-off point of the Braden scale in ICU patients have been controversial [21]. In our study, we found that some subscales of the Braden scale were not associated with the development of pressure injury in the ICU. Therefore, we simplified the model with three subscales of the Braden scale that have been confirmed to be associated with the development of pressure injury and found that no significant difference in predictive validity existed between the simplified and original models (AUROC, 0.732 vs. 0.712, p = 0.1227). One study has reported that, among the six subscales of the Braden scale, moisture had low interrater reliability [34]. As the moisture subscale is divided into “constantly,” “often,” “occasionally,” or “rarely moist,” no objective indicator exists, and nurses may find it difficult to judge and choose the scores. In addition, the activity subscale determines whether a patient can walk or sit on a chair, which is not suitable for ICU patients. For the nutrition subscale, as ICU patients usually receive enteral or parenteral nutritional support, it is difficult for nurses to check how much of the recommended calories per day each patient receives. For these reasons, because the Braden scale was not made for ICU patients, its application in the ICU is limited, and even a simplified scale showed similar predictive validity.
This study has several limitations. First, because we targeted only patients admitted to a single-center medical ICU, our findings do not represent all ICU patients. As the causes for admission to the medical ICU mainly were sepsis, shock, or respiratory failure, the patients’ baseline characteristics were different from those admitted to the surgical or neurosurgical ICUs or from neurologic patients. Deschepper et al. [2,35] demonstrated that the typical heterogeneity of an ICU population impedes the development of a universal prediction scale, and the same investigators demonstrated in another study the potential risk factors for pressure injury acquisition differ significantly depending on the type of ICU admission, either medical, surgical-elective, or surgical-emergency. Therefore, the prevalence and risk factors for pressure injuries can be different in other ICUs. Second, in this center, even though the nurses were educated and trained on the NPUAP guidelines, the proportion of pressure injuries diagnosed as Stage I was quite small. Because the incidence of Stage I pressure injuries can be underestimated, their total prevalence also can be underestimated. Third, as a retrospective study, we did not monitor the performance of pressure injury prevention for each patient. Furthermore, we don’t have any information regarding the underlying condition at the time of ICU admission. As a result, determining the association between the development of pressure injuries and underlying disorders is challenging in this study. As these factors can also affect the development of pressure injuries, future studies should include them. Despite these limitations, our study is meaningful in that it is the first to reveal a statistical relationship between NMBAs or opioids and the occurrence of pressure injuries. To prevent ulcer development, ICU physicians should evaluate daily whether patients require NMBAs or opioids and discontinue these medications as soon as possible.
In conclusion, prolonged use of NMBAs and opioids can increase the risk of developing pressure injuries. Since these medications can be associated with immobilization, minimizing their use and promoting early patient mobilization are important. In addition, among the Braden subscales, “friction and shear” was associated with the development of pressure injury in ICU patients.
KEY MESSAGE
1. As the day of neuromuscular blocking agents and opioids administration increased, the risk of pressure injury development increased by 13.8% and 8.4%, respectively.
2. Among the Braden subscales, “friction and shear” was associated with the development of pressure injury in intensive care unit patients.
Notes
No potential conflict of interest relevant to this article was reported.