Association between secondhand smoke exposure and new-onset hypertension in self-reported never smokers verified by cotinine
Article information

Abstract
Background/Aims
There is no study assessing the effect of changes of secondhand smoke (SHS) exposure and new-onset hypertension. We investigated the effect of a change of SHS exposure status on new-onset hypertension in self-reported and cotinine-verified never smokers.
Methods
Out of individuals enrolled in the Kangbuk Samsung Health Study between 2011 and 2016, 87,486 self-reported and cotinine-verified never smokers without hypertension at baseline visit were included with a median follow-up of 36 months. Individuals were divided into four groups on the basis of their SHS exposure status at baseline and at follow-up: no, new, former, and sustained SHS exposure groups.
Results
The incidence rates per 10,000 person-year of new-onset hypertension in no, new, former, and sustained SHS exposure groups were 84.7, 113.3, 102.0, and 123.7, respectively (p < 0.001). A multivariable Cox-hazard analyses showed that new and sustained SHS exposure groups increased their hazard ratio (HR) for new-onset hypertension compared to no SHS exposure group (HR, 1.31; 95% confidence interval [CI], 1.08 to 1.60 for new SHS exposure group; and HR, 1.24; 95% CI, 1.06 to 1.45 for sustained SHS exposure group). However, being part of the former SHS exposure group did not increase the risk of new-onset hypertension (HR, 0.91; 95% CI, 0.81 to 1.03).
Conclusions
This study showed that either new, or sustained SHS exposure, but not former SHS exposure, increased the risk for new-onset hypertension in self-reported never smokers verified as nonsmokers by urinary cotinine. These findings show the possibility that changing exposure to SHS even for a relatively short period can modify the risk of new-onset hypertension in self-reported and cotinine-verified never smokers.
INTRODUCTION
Secondhand smoke (SHS) exposure as well as active smoking are known to increase the risk of various diseases and deaths worldwide, so various legislation, including the expansion of non-smoking areas, has continued to be passed at the government level to reduce SHS exposure. The prevalence of SHS exposure in Korea has been also decreasing due to the expansion of smoking-free areas in public places and to public health concerns [1]. Meanwhile, since the assessment of smoking status is generally based on self-reported questionnaires, there may be limitations in the ability of investigators to accurately assess the actual smoking status of individuals. Consequently, the public health effects of SHS exposure also may be underestimated or overestimated. Cotinine has been used as an easily available biochemical marker for evaluating actual smoking status. Our earlier studies using urinary cotinine have reported a misclassification between self-reported smoking status and cotinine-verified smoking status [2-4].
Hypertension is a major risk factor for various cardiovascular diseases. Although SHS exposure in never-smokers was significantly associated with hypertension in most previous studies, the studies have been based on self-reporting in assessing smoking status [5-11]. Recently, we reported a study on the link between SHS exposure and hypertension using self-reported questionnaire and urinary cotinine verification, which also showed a significant relationship between the two [12]. However, because the design of previous studies including ours, were cross-sectional, a causal relationship between SHS exposure and hypertension could not be confirmed.
Therefore, this longitudinal study was conducted to assess the association between SHS exposure and new-onset hypertension in self-reported and cotinine-verified never smokers over the median 3-year follow-up period, and to evaluate the association between changes in SHS exposure during the follow-up period and new-onset hypertension.
METHODS
Study population
The Kangbuk Samsung Health Study (KSHS) has been ongoing since 2002 and includes a cohort of individuals over the age of 18 years who underwent comprehensive health screening examinations at the Total Healthcare Centers in Seoul and Suwon in Kangbuk Samsung Hospital. The majority of participants enrolled in the study visited annually or biennially, and were employees of companies or local government organizations and their spouses. In Korea, the Industrial Safety and Health Law stipulates that all employees receive free health screening examinations every year or every 2 years. As urinary cotinine measurement began in 2011, this study included all subjects who participated in the KSHS, who visited at least twice for health promotion and screening at both Total Healthcare Centers from 2011 to 2016.
Of a total of 265,627 individuals, 161,984 who conducted the urinary cotinine measurement were initially enrolled. Among them, 74,498 were excluded from this study for the following reasons: 1,313 individuals with missing data for self-reported smoking status; 14,798 individuals with hypertension or missing data for blood pressure (BP) at baseline; 54,236 self-reported former or current smokers at baseline; 1,896 cotinine-verified smokers at baseline; 2,022 self-reported former or current smokers at follow-up; and 233 cotinine-verified smokers at follow-up (Fig. 1). After exclusions, 87,486 self-reported and cotinine-verified never smokers without hypertension at baseline were included. The median follow-up in this study was 36 months (interquartile range, 24 to 48).

Flow chart for sample selection criteria.
This study was approved by the Institutional Review Board of Kangbuk Samsung Hospital (IRB No: 2018-06-028). As the KSHS data has been managed as both anonymous and deidentified, informed consent was waived.
BP measurements
The methodology of standardized questionnaires, and anthropometric and laboratory data has been previously described in detail [2,3].
Vigorous exercise status was defined as < 5 times/week versus ≥ 5 times/week according to the answer to a question “During the last 7 days, on how many days did you do vigorous physical activities like heavy lifting, digging, aerobics, or fast bicycling?” Alcohol consumption was defined as the amount of alcohol consumed per day (g/day) calculated by asking for the frequency of alcohol beverage consumption and the amount of alcohol consumed per time.
During each visit, the participants were asked which arm they usually measured BP on, and seated BP was measured three times at the heart level at a resting state for 5 minutes or longer after urination before the measurement, with an automated oscillometric device (53000-E2, Welch Allyn, New York, NY, USA), at least every 2 minutes by well-trained nurses. The 2nd and 3rd of the three measurements were averaged to get the systolic blood pressure (SBP) and diastolic blood pressure (DBP). New-onset hypertension was defined as high BP (SBP ≥ 140 mmHg and/or DBP ≥ 90 mmHg) or currently taking antihypertensive medication at follow-up.
Diabetes was defined as a fasting blood glucose level ≥ 7.0 mmol/L (126 mg/dL), hemoglobin A1c level ≥ 6.5%, having a history of self-reported, physician-diagnosed diabetes, or the current use of antidiabetic medication.
Assessments of smoking status
The self-reported questionnaire survey was conducted on every visit and urinary cotinine tests were typically performed on every visit, but some subjects did not take urinary cotinine tests depending on the type of the health examination package.
On the day of the examination, urinary cotinine test was conducted after 10 hours of a smoking-free period with the DRI Cotinine Assay (Microgenics Corp., Fremont, CA, USA) by an automated chemistry analyzer (Cobas c702, Roche Diagnostics, Tokyo, Japan). The test had a detection limit of 34 ng/mL and all tests were performed according to the manufacturer’s instructions. The intra-assay coefficients of variation for quality control specimens of lower levels and higher levels were 4.16%–8.59% and 1.89%–2.28%, and the inter-assay coefficients of variations were 5.08%–9.8% and 1.98%–4.28% during study period. The Laboratory Medicine Department at Kangbuk Samsung Hospital has been accredited by the Korean Society of Laboratory Medicine (KSLM) and the Korean Association of Quality Assurance for Clinical Laboratories (KAQACL). The laboratory also participates in the survey proficiency testing provided by the College of American Pathologists (CAP).
Self-reported never smokers were defined as individuals who had never smoked or had smoked fewer than five packs in their lives, based on the standardized self-reported questionnaires. Cotinine-verified smoking was defined as having urinary cotinine ≥ 50 ng/mL [13]. Self-reported and cotinine-verified never smoker was defined as self-reported never smoker with urinary cotinine level < 50 ng/mL.
According to the self-reported questionnaires, SHS exposure was defined as current exposure to passive smoke indoors at home and in the workplace (Supplementary Fig. 1). Daily time, weekly frequency, and total duration of SHS exposure were collected. According to presence/absence of SHS exposure at baseline and at follow-up, individuals were divided into four groups: No SHS exposure group as individuals without SHS exposure both at baseline and at follow-up; new SHS exposure group, as those without SHS exposure at baseline and with SHS exposure at follow-up; former SHS exposure group as those with SHS exposure at baseline and without SHS exposure at follow-up; sustained SHS exposure group, as those with SHS exposure both at baseline and at follow-up.
Statistical analyses
Continuous variables are expressed as mean ± standard deviation or median (IQR), and categorical variables are presented as numbers with percentages (%). Serum triglycerides (TG), high-sensitivity C-reactive protein (hsCRP), and alcohol consumption were log-transformed for analysis; however, data in tables is presented as untransformed original data for easy interpretation. The characteristics of the four SHS exposure groups were compared using analysis of variance (ANOVA) test or chi-square test. Post hoc comparisons between the four groups were assessed with Scheffe’s multiple comparison. The characteristics of the two groups according to the presence/absence of new-onset hypertension were assessed with Student t test or chi-square test. To evaluate the effects of the four SHS exposure groups on new-onset hypertension, crude, and multivariable Cox-hazard regression analyses were used. Adjusted covariates included in the multivariable model included statistically significant variables in the univariable model and also included exercise, a generally accepted variable that affects hypertension. Multivariable model 1 was adjusted for age, sex, body mass index, waist circumference, vigorous exercise, alcohol consumption, and presence/absence of diabetes. Multivariable model 2 was adjusted for the variables in the model 1 and creatinine, uric acid, total cholesterol, low density lipoprotein cholesterol, high density lipoprotein cholesterol, TG, and hsCRP. In addition, sensitivity analyses using propensity-score matching (PSM) on the basis of the variables in Table 1 were performed to control the potential influence of confounding factors. Weight change was assessed by subtracting weight at baseline from that at follow-up, and was categorized as weight reduction (> 1 kg), no change, weight gain (> 1 kg) for subgroup analyses. IBM SPSS version 24 (IBM Corp, Armonk, NY, USA) was used for the statistical analyses and two-tailed p value < 0.05 was considered statistically significant.
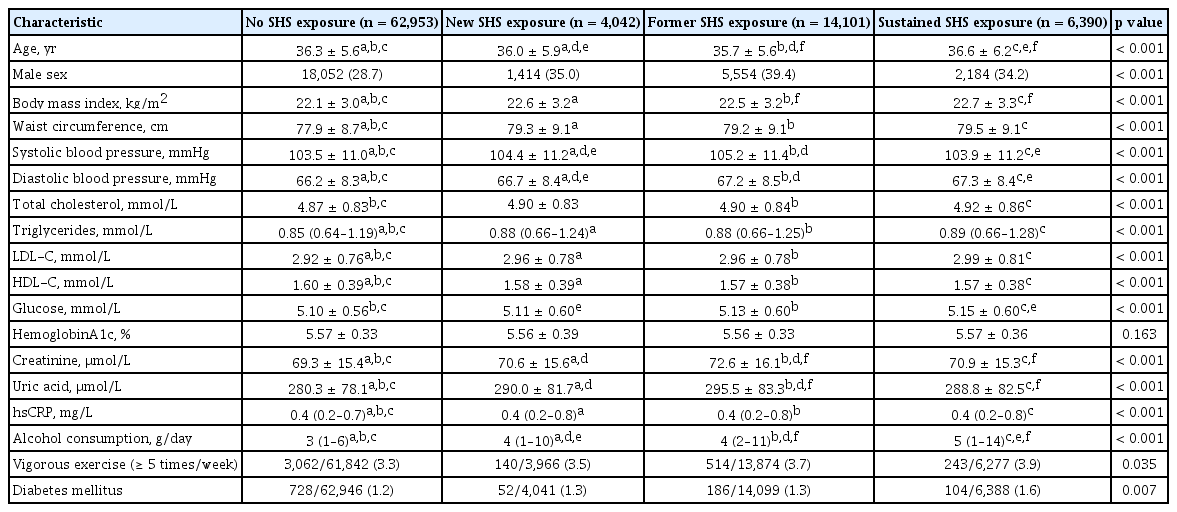
Baseline characteristics of the four SHS exposure groups in the overall population
RESULTS
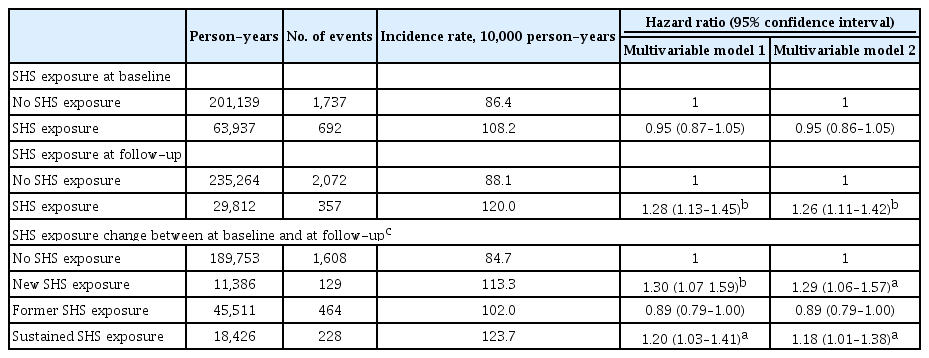
Incidence of new-onset hypertension according to presence or absence of SHS exposure at baseline and at follow-up
Of the 87,486 individuals, mean ± standard deviation age was 36 ± 5.6 years, of which 68.9% were women. The prevalence of SHS exposure at baseline and at follow-up was 23.4% and 11.9%, respectively; the prevalence of the four SHS exposure groups for no SHS exposure, new SHS exposure, former SHS exposure and sustained SHS exposure was 72.0%, 4.6%, 16.1%, and 7.3%, respectively.
The overall incidence of new-onset hypertension was 2.8%. The overall incidence rate per 10,000 person-year (PY) of new-onset hypertension was 91.6; the incidence rate per 10,000 PY of new-onset hypertension in the group with SHS exposure at baseline was higher than in the group without SHS exposure at baseline (108.2 vs. 86.4, p < 0.001) (Supplementary Fig. 2A); that in the group with SHS exposure at follow-up was also higher than in the group without SHS exposure at follow-up (120.0 vs. 88.1, p < 0.001) (Supplementary Fig. 2B). The incidence rates per 10,000 PY of new-onset hypertensions among the four SHS exposure groups according to the change of SHS exposure at baseline and at follow-up differed significantly, being 84.7, 113.3, 102.0, and 123.7 for no SHS exposure, new SHS exposure, former SHS exposure, and sustained SHS exposure groups, respectively (p < 0.001) (Fig. 2).

Incidence rates per 10,000 person-year of new-onset hypertension among the four secondhand smoke (SHS) exposure groups. No SHS exposure group was defined as individuals without SHS exposure both at baseline and at follow-up; New SHS exposure group as those without SHS exposure at baseline and with SHS exposure at follow-up; Former SHS exposure group as those with SHS exposure at baseline and without SHS exposure at follow-up; Sustained SHS exposure group as those with SHS exposure both at baseline and at follow-up. PY, person-year. aChi-square test.
Comparisons of the baseline characteristics of the four SHS exposure groups
As shown in Table 1, all variables except hemoglobin A1c significantly differed among the four SHS exposure groups. Compared with individuals with no SHS exposure, individuals with sustained SHS exposure were older whereas those with new and former SHS exposure were younger. Meanwhile, individuals with new, former, and sustained SHS exposure were more obese and were more likely to be men and have higher frequency of alcohol consumption, vigorous exercise and diabetes, and unfavorable renal and lipid profiles, compared with those with no SHS exposure. The comparisons of the characteristics among the four SHS exposure groups are presented in Supplementary Tables 1 and 2. The baseline characteristics between individuals with and without new-onset hypertension in the overall population showed significant difference in all variables except vigorous exercise (Supplementary Table 3).
Effects of SHS exposure at baseline and at follow-up on new-onset hypertension
The results of multivariable Cox-hazard regression analyses showed that the SHS exposure group at baseline did not significantly increase the risk of new-onset hypertension compared with no SHS exposure at baseline (hazard ratio [HR], 0.95; 95% confidence interval [CI], 0.87 to 1.05; and HR, 0.95; 95% CI, 0.86 to 1.05 in multivariable model 1 and 2, respectively) (Table 2). Meanwhile, SHS exposure at follow-up significantly increased the risk of new-onset hypertension compared to no SHS exposure group at follow-up in multivariate models (HR, 1.28; 95% CI, 1.13, 1.45; and HR, 1.26; 95% CI, 1.11 to 1.42 in the multivariable model 1 and 2, respectively) (Table 2). Longer daily time and total duration of SHS exposure at baseline showed a significant trend for the risk of new-onset hypertension, whereas the relationships between daily time, weekly frequency, and total duration of SHS exposure at follow-up and the risk of new-onset hypertension were stronger and more obvious (all p for trends < 0.001) (Table 3).
Multivariable Cox-hazard regression analyses for the effects of SHS exposure on new-onset hypertension in the overall population
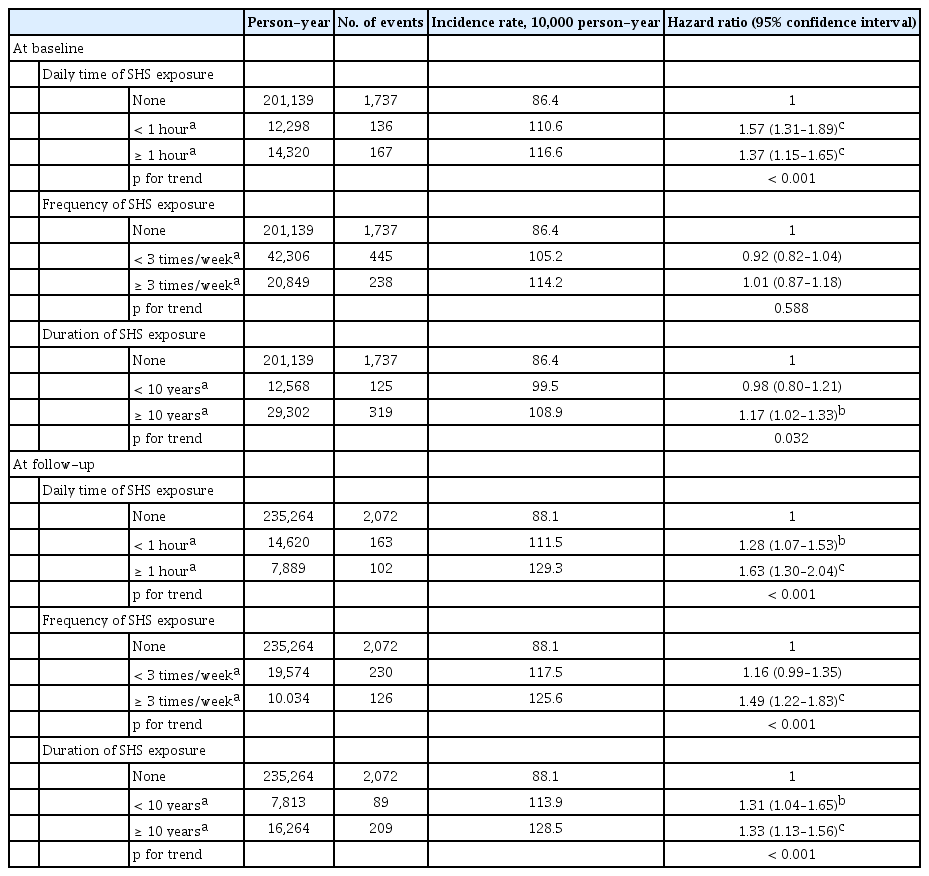
Multivariable Cox-hazard regression analyses for the effects of frequency and duration of SHS exposure at baseline and at follow-up on new-onset hypertension in the overall population
There were significant differences in SBP and DBP change between at baseline and at follow-up among the four SHS exposure groups in the overall population as well as in individuals without taking antihypertensive medication (Table 4). In particular, in individuals without taking antihypertensive medication at follow-up, compared to no SHS exposure group, SBP at follow-up in the former SHS exposure group significantly decreased (1.38 mmHg vs. 1.07 mmHg, p < 0.05), while DBP at baseline at follow-up in the new SHS exposure group numerically increased (0.99 mmHg vs. 1.27 mmHg, p = 0.08). Moreover, the mean change of SBP in the new SHS exposure group was numerically higher than that in the former SHS exposure group (1.49 mmHg vs. 1.07 mmHg, p = 0.05).

Mean changes of systolic and diastolic blood pressure between at baseline and at follow-up among the four SHS exposure group
Effects of SHS exposure among the four SHS exposure groups according to the change of SHS exposure status between at baseline and at follow-up on new-onset hypertension
Compared with no SHS exposure group, both new and sustained SHS exposure groups significantly increased the risk of new-onset hypertension in the multivariable analyses (HR, 1.30; 95% CI, 1.07 to 1.59; and HR, 1.20; 95% CI, 1.03 to 1.41 in model 1; HR, 1.29; 95% CI, 1.06 to 1.57; and HR, 1.18; 95% CI, 1.01 to 1.38 in model 2) (Table 2). Meanwhile, the former SHS group was not significantly associated with the risk of new-onset hypertension in the multivariable analyses (HR, 0.89; 95% CI, 0.79 to 1.00 in model 1; and HR, 0.89; 95% CI, 0.79 to 1.00 in model 2) (Table 2). Sensitivity analyses using PSM showed similarity to the main findings of the entire population of this study (Supplementary Table 4).
Longer daily time and higher weekly frequency of SHS exposure at follow-up in new SHS exposure group significantly increased the risk of new-onset hypertension in the multivariable model 2 (Supplementary Table 5). In particular, individuals with SHS exposure for more than an hour a day and more than three times a week at follow-up in the new SHS exposure group increased their risk of new-onset hypertension by 87% and 69%, respectively, compared to those with no SHS exposure (Supplementary Table 5). Sustained SHS exposure group also significantly increased the risk of new-onset hypertension with longer daily time and total duration of SHS exposure, and the RRs of new-onset HT were significantly high, even if they were exposed to SHS for less than 1 hour a day, less than three times a week or less than 10 years (HR, 1.87; 95% CI, 1.39 to 2.50; HR, 1.65; 95% CI, 1.26 to 2.15; and HR, 1.80; 95% CI, 1.19 to 2.73) (Supplementary Table 5).
Subgroup analyses according to the three weight change categories showed that compared to the no SHS exposure group, the only former SHS exposure group in the weight reduction category (> 1 kg) significantly decreased the risk of new-onset hypertension (HR, 0.70; 95% CI, 0.51 to 0.95); the new and sustained SHS exposure groups in no weight change category significantly increased the risk of new-onset hypertension (HR, 1.76; 95% CI, 1.13 to 2.75; and HR, 1.50; 95% CI, 1.06 to 2.11) but the former SHS exposure group did not (HR, 1.10; 95% CI, 0.84 to 1.43); all the three SHS exposure groups in the weight gain category (> 1 kg) did not change the risk of new-onset HT (Supplementary Table 6).
There was no gender interaction for the association between SHS exposure and new-onset hypertension (p for interaction = 0.558).
DISCUSSION
Our study shows that new and sustained SHS exposures in self-reported and cotinine-verified never smokers significantly increase the risk of new-onset hypertension during the median 3-year follow-up period, while e former SHS exposure does not increase the risk of new-onset hypertension.
Previous studies have reported that smoking causes structural and functional changes in arteries including increased arterial stiffness and atherosclerosis [14], but the biochemical mechanisms that underlie the effects of smoking on BP are still unclear. Most previous studies have shown that sympathetic activation by nicotine in cigarettes primarily contributes to increased BP [15,16], whereas other studies have reported that sympathetic inhibition via activation of baroreflex and vasodepressor effects of carbon monoxide from cigarette emission can offset BP increase [17,18]. In addition, there is as yet a lack of research on how thousands of toxic constituents in cigarettes affect BP. Consequently, chronic smoking is likely to have various biochemical effects on BP and the vasculatures. Even with regard to SHS exposure, several studies have shown putative mechanisms linking SHS exposure to BP including muscle sympathetic activation and structural and functional vascular changes [19-21].
There have been other epidemiological studies investigating the association between chronic smoking and BP/hypertension, and theses have shown inconsistent results [2,22-25]. Meanwhile, epidemiological studies linking SHS exposure to hypertension have reported positive associations between SHS exposure and hypertension [5-10,26]. Recently, we also reported that a significant relationship exists between SHS exposure and hypertension in self-reported and cotinine-verified never smokers [12]. However, because all of the aforementioned studies are cross-sectional, a causal relationship between SHS exposure and hypertension cannot be confirmed. Also, all of the other studies except our own were based on self-reported questionnaire, so they may have errors in the misclassification of actual smoking status. Particularly in Korea, due to Confucian culture which is still socially prevalent, it is more likely that actual smokers may falsely claim to be never smokers in self-reported questionnaire.
There are several notable differences in the current study from earlier ones. First, we not only evaluated the effect of the presence of SHS exposure at baseline and follow-up on the risk of new-onset hypertension, but also the effect of changes in SHS exposure during the follow-up period. Our results of evaluating the link between SHS exposure and new-onset hypertension based on each baseline and follow-up in Table 3 were inconsistent. However, because these results did not reflect changes in SHS exposure during follow-up, these discrepancies would not determine the relationship between SHS exposure and new-onset hypertension. A major finding in the present study was that people previously exposed to SHS did not increase the risk of new-onset hypertension if they were not exposed to SHS within 3 years. On the other hand, exposure to SHS within 3 years, even if individuals had never been exposed before, increased the risk of new-onset hypertension by about 30%, and sustained SHS exposure increased the risk of new-onset hypertension by about 20%. In our study, the mechanism for explaining the results that the former SHS exposure group did not increase the risk of new-onset hypertension is unclear. One potential mechanism would not exclude the reversibility of the aforementioned biological effects of smoking. However, no studies have so far evaluated the biological effects of new-onset hypertension and changes in SHS exposure, which may require further researches. Another mechanism would be the behavior factors including weight change. The present study showed a significant difference in weight change during follow-up among the four SHS exposure groups (1.1 ± 3.3, 1.1 ± 3.4, 1.4 ± 3.5, and 1.0 ± 3.3 kg in the no, new, former, and sustained SHS exposure groups, respectively; p < 0.001). Nevertheless, the new, former, and sustained SHS exposure in individuals with weight gain did not change the risk of new-onset hypertension compared to the no SHS exposure, but only former SHS exposure in those with no weight change did not change the risk of new-onset hypertension and also the former SHS exposure in those with weight reduction significantly reduced the risk of new-onset hypertension. These findings suggest the importance of avoiding SHS exposure even for a few years and reducing the amount and number of SHS exposures, along with weight control, in order to reduce the risk of hypertension. Our results also showed relatively higher risk for new-onset hypertension in the new SHS exposure group than in the sustained SHS exposure group. The possible reason for this finding would be as follows. According to our cross-sectional research published previously [12], the prevalence of hypertension in the group with SHS exposure was higher than that in the group without (6.7% vs. 5.1%, p < 0.001). We excluded hypertensive individuals at baseline in order to assess new-onset hypertension, suggesting that individuals with SHS exposure at baseline could be more resistant to new-onset hypertension by sustained SHS exposure. Second, the present study included cotinine verification in order to identify never smokers and to minimize the misclassification of self-reported never smokers. Although controversy still exists over a cut-off point for cotinine in discriminating current from never smokers, a generally accepted 50 ng/mL of urinary cotinine was used [13]. In our previous studies, this cut-off provided high sensitivity (84.8% to 90.0%) and specificity (98.2%) for assessing smoking status [2,20], with low misclassification rates of cotinine-verified current smokers among self-reported never smokers (1.7% to 1.8%) [2,3].
This study has several limitations. First, because the KSHS data was based on individuals who underwent health promotion and screening examination and over 80% of them were employees of various companies or local government organizations, most of the subjects in this study were middle-aged and apparently relatively healthy. Therefore, as described in our previous studies, they may not be representative of the overall Korean population. Moreover, we excluded hypertensive individuals at baseline, which may be a selection bias. Second, BP in individuals enrolled from 2012 to 2016 was measured three times and was averaged. Meanwhile, since only one BP measurement was taken at baseline for those enrolled in 2011 (n = 20,668), there might be a possibility of misclassification of hypertension at baseline. However, results for the association between SHS exposure and new-onset hypertension in the 66,818 individuals after excluding 20,668 individuals who enrolled in 2011, were similar to the main results for the overall population in our study (data not shown). Third, the median follow-up duration was relatively short at three years. However, since the KSHS is still underway, longitudinal studies with a longer follow-up period will still be possible in the future. Fourth, we were unable to assess the duration of no more SHS exposure during follow-up in the former SHS exposure group using our standardized questionnaire. Fifth, although the present study includes comprehensive data, potential confounding factors could still exist, including diet and genetic variation influencing nicotine metabolism and hypertension. Lastly, since information on SHS exposure is based on self-reported questionnaires in our study, there may be limitations in actually quantifying the amount of SHS. Nevertheless, this study is valuable in that it is the first and largest to evaluate the association between changes in SHS exposure and new-onset hypertension in never smokers using cotinine as well as self-reporting to more accurately classify never smokers.
In conclusion, this longitudinal study showed that the sustained SHS exposure, but not former SHS exposure, increased the risk for new-onset hypertension in self-reported and cotinine-verified never-smokers. Furthermore, although the follow-up period was relatively short, new SHS exposure also increased the risk of new-onset hypertension. In other words, minimizing exposure to SHS is necessary to reduce the incidence of new-onset hypertension, and also that even if exposure to SHS has previously been experienced, it does not increase the incidence of new-onset hypertension unless there is subsequent exposure. Although this study was not carried out to shot the results of an intervention, these findings suggest the possibility that changing exposure to SHS even over a relatively short period of 3 years can modify the risk of new-onset hypertension.
KEY MESSAGE
1. In this longitudinal study, either new, or sustained secondhand smoke (SHS) exposure, but not former SHS exposure, increased the risk for new-onset hypertension in self-reported and cotinine-verified never smokers.
2. These findings show the possibility that changing exposure to SHS even for a relatively short period can modify the risk of new-onset hypertension in self-reported and cotinine-verified never smokers.
Notes
No potential conflict of interest relevant to this article was reported.