Trends in hospital visits and healthcare costs of gout and seropositive rheumatoid arthritis in Korea from 2010 to 2017 using National Healthcare Claims
Article information

Abstract
Background/Aims
We examined temporal trends in the rate of gout and seropositive rheumatoid arthritis (RA) hospital visits and healthcare costs in Korea.
Methods
We conducted a serial cross-sectional analysis of Korean national healthcare claims. We calculated the annual increase in hospital visits (emergency department [ED] visits, outpatient visits, and hospitalizations) and total healthcare costs per visit.
Results
From 2010 to 2017, the annual rates of ED visits, outpatient visits, and hospitalizations for gout increased from 6.28 to 21, from 638.38 to 1059.55, and from 12.37 to 15.6 per 100,000 persons, respectively. Before 2013, ED visits for gout were most common in patients over 70 years old, but they were most common in those aged between 30 and 49 years after 2013. The number of patients with ED visits, outpatient visits, and hospitalizations for RA from 2010 to 2017 increased from 1.25 to 1.87, from 219.04 to 307.49 and from 8.44 to 12.32 per 100,000 persons, respectively. However, there was no increase in the prevalence of ED visits for RA in any age group except for those older than 70 years. The cost per ED visit for gout significantly decreased from 496.3 to 273.6 US dollar during the study period. There was no significant change in the cost per ED visit for RA between 2010 and 2017.
Conclusions
There was a large increase in ED visits for gout during the study period. Further studies are needed to analyze the reason behind increased ED visits for gout and suggest ways on how to improve gout care.

INTRODUCTION
Gout and rheumatoid arthritis (RA) are the two most common forms of chronic inflammatory arthritis worldwide, with both being characterized by acute flares. Although these diseases can be optimally treated in an outpatient setting, both still require emergency department (ED) visits or hospitalizations in some cases, leading to substantial healthcare costs. With the development of biologic drugs and the standardization of treatment strategies, the hospitalization rate of RA has been declining. One study found that the hospitalization rate of Canadian patients with RA decreased by 49% from 2000 to 2011, while it decreased from 13.9 to 4.6 per 100,000 adults in the United States from 1993 to 2011 [1,2]. On the other hand, the number of patients with hospitalization for gout doubled from 3.8 to 7.6 per 100,000 Canadian adults and from 4.4 to 8.8 per 100,000 United States adults, reflecting an increase in prevalence and poor quality of care since suboptimal management of chronic diseases is often reflected in ED visit statistics. One study using US Nationwide Emergency Department Sample data showed that acute gout accounted for 0.2% of all ED visits and $166 million in ED charges in 2008 [3]. A more recent study reported a 14% increase from 2006 to 2012 [4], while another study found that both the absolute number of ED visits and the cost per visit increased over time in the United States [5]. Hyperuricemia and gout have a high prevalence in Asian countries [6], and the financial burden of RA is constantly increasing. Despite this, only a few studies have examined the pattern of healthcare utilization or ED visits for gout or RA in this region.
The objective of the present study was to examine temporal trends in hospital visits and healthcare costs for gout using a nationally representative sample as well as to compare them with equivalent trends for seropositive RA. RA was chosen for comparison because both gout and RA are ambulatory sensitive care conditions, and the use of ED or hospitalization might reflect suboptimal disease control.
We hypothesized that, over the past decade, gout and RA showed contrasting trends in this regard and that each condition could serve as the other’s internal comparison group.
METHODS
Data source
South Korea has a universal health coverage system in which claims data from the Health Insurance Review & Assessment Service (HIRA) account for 90% of the total population in Korea [7]. In addition, Statistics Korea provides public data that are whole databases (DB) and electronic files that are electronically created or acquired and managed by public institutions. We requested data for the diseases of interest provided publicly by HIRA (https://data.go.kr). Through this method, medical statistics data for each disease of interest were provided as well as data on the number of patients, claims, and charges for each hospital visit, distribution by gender, age, hospital type, and year of visit for the disease of interest. However, we could not check the raw data related to the patient for each claim, such as information on medications used, blood tests, and whether to use the hospital before or after. This study was approved by the Institutional Review Board of Hallym University Dongtan Sacred Heart Hospital (IRB approval number: HDT 2020-05-015).Informed consent was waived by the board.
Study population and identification of gout and seropositive RA
We included all patients who had gout or seropositive RA as a primary diagnosis and had visited hospitals for treatment between January 1, 2010 and December 31, 2017. The term “hospital visits” refers to ED visits, outpatient visits, and hospitalizations. ED visits were identified when an emergency medical care fee was charged. The data included patients who had attended primary care, secondary care, or tertiary care hospitals. We collected data from patients of both sexes who were aged more than 20 years and had placed at least one claim for a diagnosis of gout or seropositive RA. The diagnostic codes used were M10 for gout and M05 for seropositive RA according to the Korean Standard Classification of Disease, which is similar to the International Classification of Diseases, 10th Revision (ICD-10). The National Health Insurance Service (NHIS) in Korea covers medical costs for diagnostic tests, treatment (surgery, intervention, medication), and hospital care (outpatient, inpatient, or ED visits).
Estimation of prevalence, rate of hospital visits, and healthcare costs
Since the rate of hospital visits may be affected by variation in prevalence, the prevalence for each year was first analyzed. The annual prevalence rates of gout and seropositive RA from 2010 to 2017 were calculated based on the number of individual patients divided by the total population in that year. The data of the total population were assessed using the Korean Statistical Information Service (http://kosis.kr/index/index.do). These are future population estimates published in March 2019 by Statistics Korea. The population is confirmed from 2010 to 2016, and the data for 2017 are the results of median estimates (basic estimates) combining median households by population change factors (birth, death, and international migration). The annual rates of ED visits, outpatient visits, and hospitalizations for each disease were also calculated. These data are presented as the number of patients per 100,000 Koreans. Sex- and age-specific annual prevalence rates were also obtained. Age was stratified into six groups (20–29, 30–39, 40–49, 50–59, 60–69, and ≥ 70 years). We calculated the healthcare cost per visit by dividing the total healthcare cost of ED visits, outpatient visits, and hospitalizations by the visit number for each visit. The healthcare cost is shown as US dollar (USD), with 1 USD equaling 1,110 Korean won.
Statistical analysis
The annual prevalence trends of gout and seropositive RA were analyzed using the Mann-Kendall trend test, which is used to analyze data collected over time that reflect consistently increasing or decreasing trends. All statistical analyses were performed using R software version 3.5.3 (R Foundation for Statistical Computing, Vienna, Austria), and the Mann-Kendall trend test was performed using the ‘Kendall’ packages. Prevalence is represented with a 95% confidence interval (CI). Statistical significance was set at p < 0.05.
RESULTS
During the study period (2010–2017), the datasets included a total of 2,777,017 gout patients and 801,590 seropositive RA patients (raw data) (Supplementary Table 1).
Annual prevalence of gout and seropositive RA from 2010 to 2017
The annual sex- and age-specific prevalence of gout and seropositive RA from 2010 to 2017 are shown in Fig. 1. The annual prevalence of gout was 2,433 (95% CI, 2,428 to 2,438) per 100,000 persons in 2010 and 3,917 (95% CI, 3,911 to 3,923) per 100,000 persons in 2017. In male patients, the annual prevalence of gout was 4,638 (95% CI, 4,629 to 4,648) per 100,000 persons in 2010 and 7,505 (95% CI, 7,494 to 7,517) in 2017. In females, the annual prevalence of gout was 283 (95% CI, 281 to 285) per 100,000 persons in 2010 and 400 (95% CI, 397 to 402) in 2017. The prevalence was highest among men over 70 years of age, although the increase in prevalence over time did not reach statistical significance (p = 0.06). On the other hand, the prevalence significantly increased in all other age groups over time (p < 0.05). Similar to males, females over 70 years old had the highest prevalence.

Sex- and age-specific prevalence of gout and seropositive rheumatoid arthritis. (A) Annual age-specific prevalence of gout (male). (B) Annual age-specific prevalence of gout (female). (C) Annual age-specific prevalence of seropositive rheumatoid arthritis (male). (D) Annual age-specific prevalence of seropositive rheumatoid arthritis (female).
The annual prevalence of seropositive RA was 1,147 (95% CI, 1,143 to 1,150) per 100,000 persons in 2010 and 1,665 (95% CI, 1,661 to 1,669) per 100,000 persons in 2017. In males, the annual prevalence was 417 (95% CI, 414 to 420) per 100,000 persons in 2010 and 641 (95% CI, 638 to 645) in 2017. In females, the annual prevalence of seropositive RA was 1,858 (95% CI, 1,852 to 1,864) per 100,000 persons in 2010 and 2,668 (95% CI, 2,661 to 2,675) in 2017. Before 2014, the prevalence in male seropositive RA was highest in the 60 to 69 age group, while after 2014, it was highest among those older than 70 years. The prevalence of seropositive RA in women significantly increased over the study period in all age groups (p < 0.001). Its prevalence was the highest among those aged 60 to 69 years. Prevalence did not change among the 20 to 39 years age group; however, it increased significantly in other age groups (p < 0.05).
Annual rate of ED visits, outpatient visits, and hospitalizations for gout and seropositive RA from 2010 to 2017
The annual rates of hospital visits for gout and seropositive RA are shown in Fig. 2. In 2010, the annual rates of ED visits, outpatient visits, and hospitalizations for gout were 6.28 (95% CI, 6.02 to 6.53), 638.38 (95% CI, 635.84 to 640.91), and 12.37 (95% CI, 12.02 to 12.73) per 100,000 persons, respectively. In 2017, the annual rates of ED visits, outpatient visits, and hospitalization were 21.01 (95% CI, 20.56 to 21.45), 1,059.55 (95% CI, 1,056.41 to 1,062.69), and 15.6 (95% CI, 15.22 to 15.98) per 100,000 persons, respectively. The number of ED visits, outpatient visits, and hospitalizations increased significantly from 2010 to 2017 (p < 0.001, p < 0.001, and p = 0.002, respectively). In particular, the number of ED visits for gout increased 3.8 times from 2010 to 2017. The ED visit rate for gout spiked in 2016, with a 51% increase over the previous year, and it increased more than the prevalence of gout (Supplementary Table 2). This increase in ED visit rate per prevalence was more pronounced in males and in the 50 to 59 years age group.
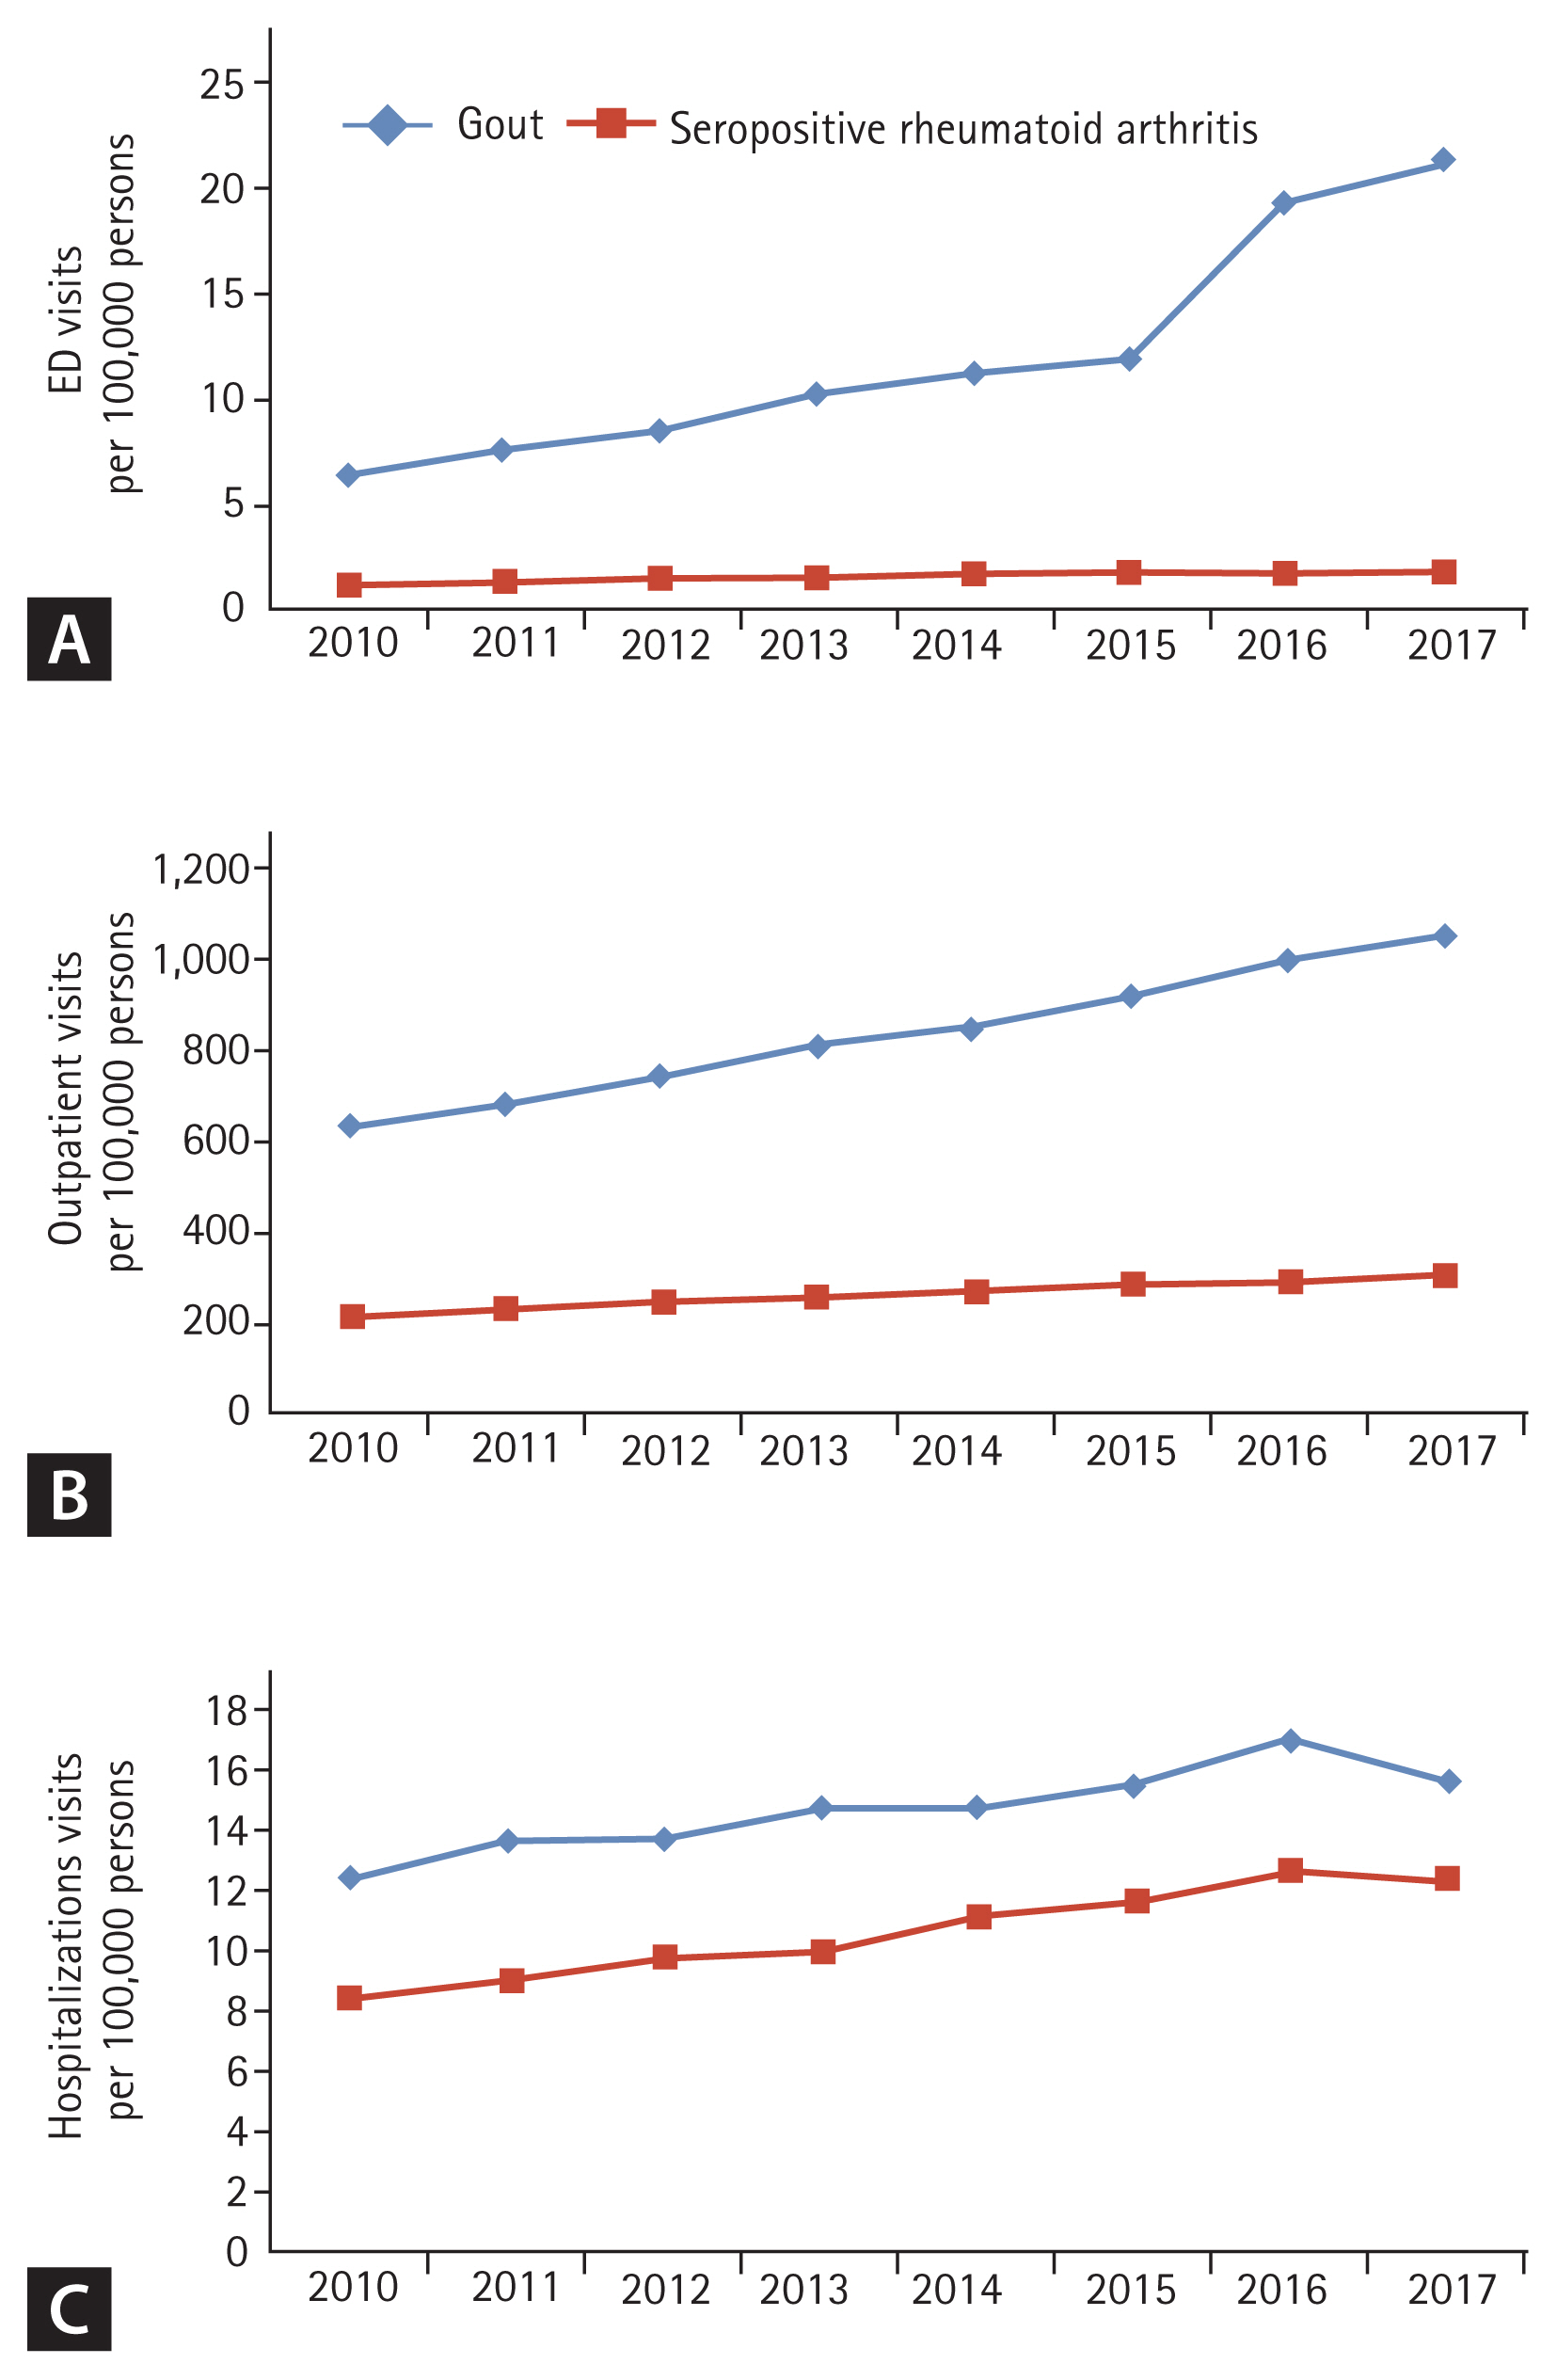
Annual rates of (A) emergency department (ED) visits, (B) outpatient visits, and (C) hospitalizations for gout and seropositive rheumatoid arthritis.
The annual sex- and age-specific rates of hospital visits for gout and seropositive RA are shown in Tables 1–3. Before 2013, ED visits for gout were most common among patients over 70 years old, but after 2013, they were most common among those aged 30 to 39 years (Table 1). ED and outpatient visits for gout increased in all age groups during the study period. The number of claims, instead of the number of patients, for ED and outpatient visits due to gout from 2010 to 2017 also showed a similar trend (Supplementary Table 3).
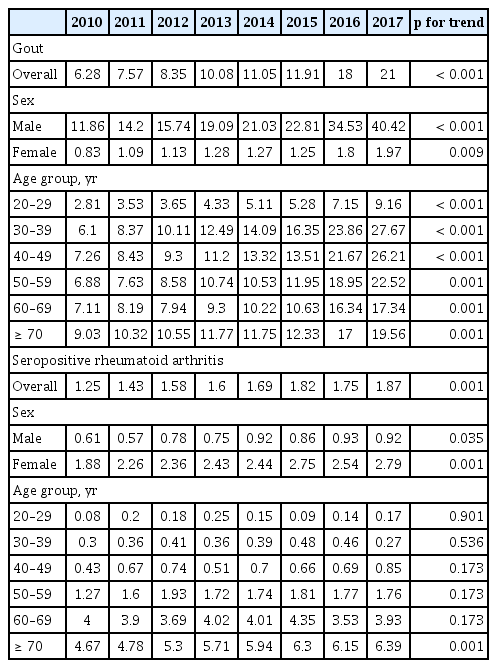
The number of patients visited emergency department for gout and seropositive rheumatoid arthritis per 100,000 persons
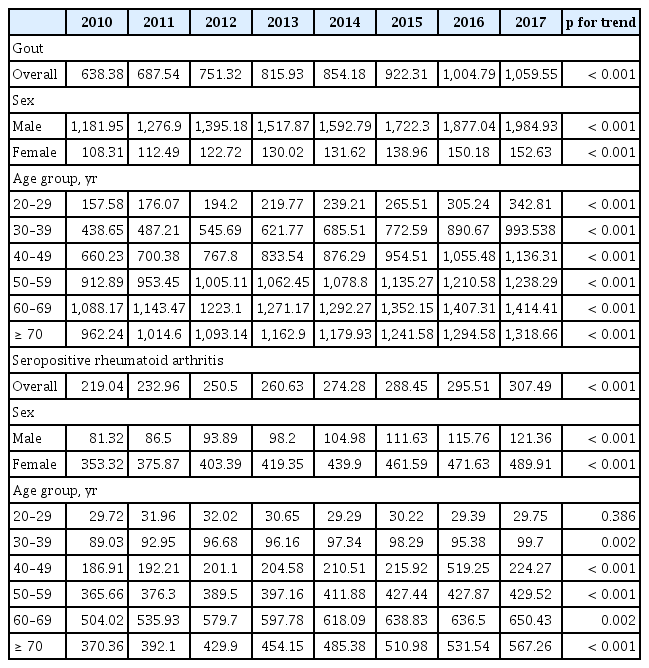
The number of patients visited outpatient clinics for gout and seropositive rheumatoid arthritis per 100,000 persons
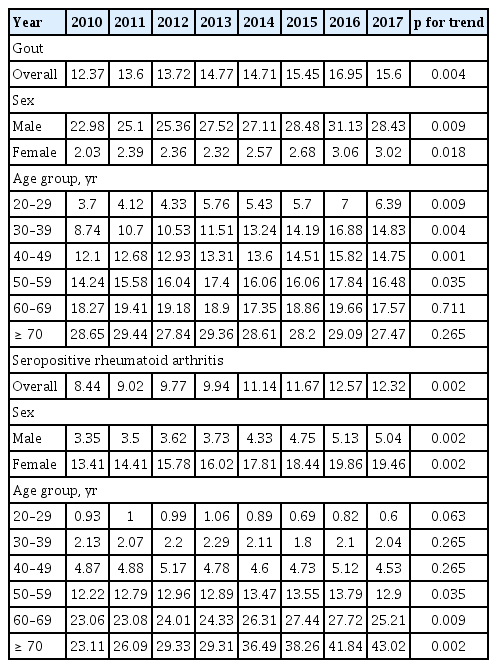
The number of patients hospitalized for gout and seropositive rheumatoid arthritis per 100,000 persons
In 2010, the annual rates of ED visits, outpatient visits, and hospitalizations for RA were 1.25 (95% CI, 1.14 to 1.36), 219.04 (95% CI, 217.55 to 220.52), and 8.44 (95% CI, 8.15 to 8.73) per 100,000 persons, respectively. In 2017, the annual rates of ED visits, outpatient visits, and hospitalizations were 1.87 (95% CI, 1.73 to 2.00), 307.49 (95% CI, 305.8 to 309.18), and 12.32 (95% CI, 11.98 to 12.66) per 100,000 persons, respectively.
The annual rate of ED visits, outpatient visits, and hospitalizations for seropositive RA also increased significantly from 2010 to 2017 (p < 0.001 in all cases). ED visits for seropositive RA were most common among those over 70 years of age. The increases in ED visits and hospitalization rates were most pronounced in the older age groups (≥70 and ≥ 60 years, respectively).
Cost of outpatient care, hospitalizations, and ED visits for gout and seropositive RA
The annual healthcare costs per visit for ED visits, outpatient visits, and hospitalizations for gout and seropositive RA are shown in Fig. 3. In 2010, the mean cost per outpatient visit for gout patients was 27.6 USD. It significantly increased during the study period, with a mean cost per outpatient visit of 33.8 USD in 2017 (p = 0.01). The mean cost per hospitalization for gout significantly increased from 1,203.7 to 1,403.5 USD between 2010 and 2017 (p = 0.01). However, the mean cost per ED visit significantly decreased from 491.9 to 271.2 USD in 2010 and 2017 (p = 0.002). However, the total cost of ED visits for gout increased significantly from $13.18 million in 2010 to $35.71 million in 2017 (Supplementary Fig. 1).

Annual healthcare costs per visit for (A) emergency department (ED) visits, (B) outpatient visits, and (C) hospitalizations for gout and seropositive rheumatoid arthritis.
The annual cost of ED visits for seropositive RA did not change significantly between 2010 and 2017 (4,581.9 USD vs. 4,377.7 USD, respectively; p = 0.71), as well as the mean cost per hospitalization (2,986.2 USD vs. 2,854.7 USD, p = 0.39). However, the cost per outpatient visit almost doubled from 108 to 197.6 USD between 2010 and 2017 (p < 0.001).
DISCUSSION
Gout is one of the most common chronic diseases affecting adults, and its prevalence has almost doubled over the last few decades [8]. In a recent study, the prevalence and incidence of gout varied widely according to the population studied and methods employed but ranged from a prevalence of < 1% to 6.8% and an incidence of 0.58 to 2.89 per 1,000 person-years [9]. At the same time, it is a condition that can be effectively managed using currently available medications. However, suboptimal care for patients with gout leads to acute flares, which then results in ED visits or hospitalizations. Thus, the pattern of ED utilization and hospitalization might reflect the level of care for gout [3].
In the present study, the annual rate of ED visits for gout increased by 3.8 times from 2010 to 2017, while that of ED visits for seropositive RA increased by 1.49 times. Conversely, the annual increase in the hospitalization rate for gout was less pronounced at 26%. The increase in ED visits for gout was highest among those between 30 and 50 years of age, while that for seropositive RA was highest among those aged ≥ 70 years.
Two studies reported an increase in ED visits for gout in the United States [4,5]. A study using US National ED Sample data showed that ED visits and costs increased from 2009 to 2012, with total ED visit charges increasing by 47%. A serial cross-sectional analysis of the same DB showed that the rate of ED visits for gout increased by 14% between 2006 and 2012. The increase was most pronounced (29%) in those aged 45 to 54 years. On the other hand, a study within a single healthcare system in Hawaii reported that the rates of gout ED visits in 2017 trended downward and that they had significantly decreased since 2011 [10]. The rates of RA outpatient visits, which were used as an internal comparison group, also decreased in 2017, as did the rates of outpatient and inpatient visits for gout. Therefore, these results reflect a change in the overall healthcare utilization pattern, rather than a true decrease in ED visit rates among patients with gout. In addition, patients with gout had higher rates of ED visits than those with RA, suggesting that gout care may be suboptimal in Hawaii. To our knowledge, the present study is the first to examine the use of ED for gout in a Korean population. We found a larger increase in the annual rate of ED visits for gout than in previous studies done in the United States. In a study using the National Health Claims DB, the prevalence of gout in Korea nearly doubled from 2007 to 2015 (3.49 vs. 7.48 per 1,000 persons), and the incidence of gout was growing faster in the young population than in the older population [11]. However, the increase in ED visit rate for gout was higher even after taking the increase in prevalence into account. In particular, the cause of the spike from 2015 to 2016 was unclear. The Korea National Health and Nutrition Examination Survey (KNHANES) found that men in their fourth decade had the highest rate of alcohol intake and excessive caloric intake [12,13], which may partly explain the high ED visits in this age group. Although suboptimal hyperuricemic control might lead to frequent attacks and ED visits, the factors contributing to ED visits for gout have not been studied. Therefore, the factors that lead to ED visits for gout must be examined, including medication use and abrupt lowering of uric acid levels, which we plan to address in a future study. In a previous survey study of United States primary care physicians, only half of primary care providers reported optimal treatment practices for the management of acute gout [14]. In addition, non-compliance with the treatment guidelines by clinicians in real practice may lead to an increase in ED visits for gout, and it would be helpful to see if the physicians followed the guidelines for gout treatment in real practice [14–16]. Because interruption of urate-lowering therapy (ULT) during gout flare was also found to lead to ED visits for gout [16], it is important to educate gout patients who regularly take ULT regarding adherence.
During the study period, the annual healthcare cost per outpatient visit and hospitalization for gout increased, whereas the ED visit costs for gout decreased. This is in contrast to United States studies. It is hypothesized that recent increases in visits may be mostly due to acute attacks, which are more easily treated than other complications such as infection or adverse drug effects.
Among patients with seropositive RA, the rate of ED visits also increased during the observation period but was less pronounced than in those with gout. In the sex- and age-specific analysis, the ED visits for seropositive RA did not increase except for the oldest age group, suggesting that patients with RA were better managed in the outpatient setting than those with gout in younger age groups. The doubling of the cost per visit for outpatients with seropositive RA may have occurred because the drug cost increased after the use of biologic agents. Another study showed that the healthcare cost for RA in Korea nearly doubled from 2004 to 2013, which was in line with our results [17].
The present study had several limitations. We used the HIRA DB, which provides analyzed partial data for all patients with the disease of interest rather than the full data for each patient. Thus, we could not analyze risk factors for flares of gout, such as individual serum uric acid level, concomitant medications (allopurinol or febuxostat), or dietary intake, and it was not possible to confirm the reason for ED visit. Second, for the diagnosis of gout and seropositive RA, the ICD-10 codes could not be validated. Diagnostic codes based on claims data that are collected with the purpose of reimbursing healthcare services, and not for clinical purposes, may not match the actual disease. In particular, in the case of mild disease such as gout, it is possible that more information other than the actual diagnosis code was included. To confirm the diagnosis of the disease, an operational definition using prescribed medications may also be considered. Finally, because only seropositive RA was included, not all hospital visits for RA were identified. However, using the national health claims DB, we could assess the prevalence of healthcare usage for gout among the general Korean population. We plan to examine the factors associated with ED visits for gout patients in a future study, which would elucidate possible choices for optimization of treatment of gout and guide policy decisions. Many studies have addressed the prevalence of ED visits for gout in Western countries [2,5,10,18–20], but very little research has been carried out in Asian countries. The present study was the first to analyze hospital visits due to gout in Korea.
In conclusion, between 2010 and 2017, the prevalence of ED visits for gout increased more than that of ED visits for seropositive RA in the Korean population. The NHIS should consider this trend and focus on the optimal management of gout in the outpatient healthcare setting.
KEY MESSAGE
1. Between 2010 and 2017, the prevalence of emergency department (ED) visits for gout increased more than that of ED visits for seropositive rheumatoid arthritis in the Korean population.
2. Clinicians should consider this trend and focus on the optimal management of gout in the outpatient healthcare setting.
Supplementary Information
Notes
No potential conflict of interest relevant to this article was reported.
Acknowledgements
This research was supported by a grant from the Hallym University Research Fund.