Two-dimensional shear wave elastography for assessing liver fibrosis in patients with chronic liver disease: a prospective cohort study
Article information

Abstract
Background/Aims
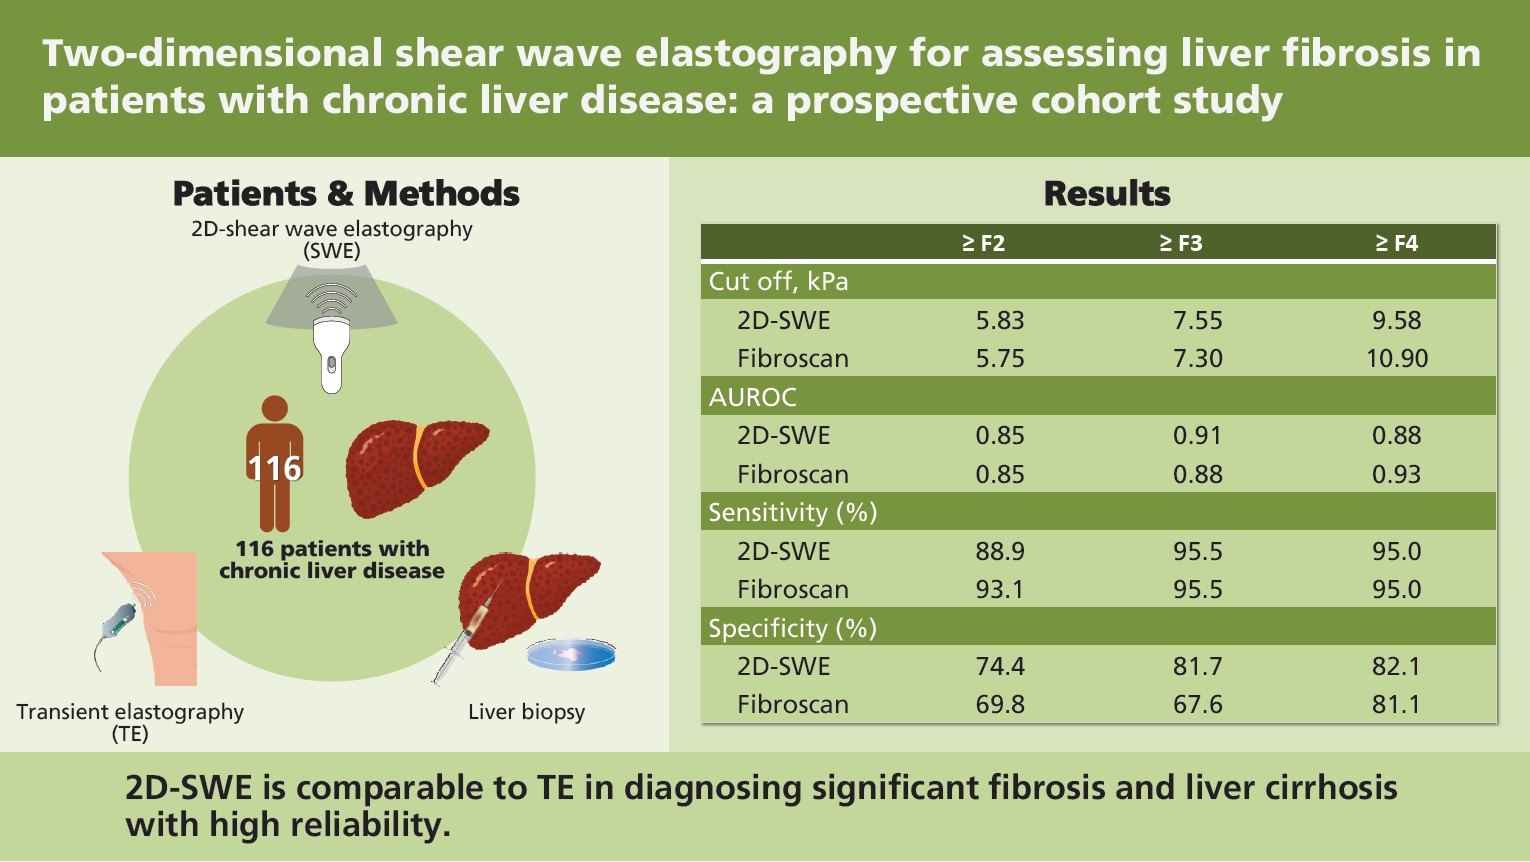
The objective of this study was to determine whether the newly developed two-dimensional shear wave elastography (2D-SWE, RS85, Samsung-shearwave imaging) was more valid and reliable than transient elastography (TE) for predicting the stage of liver fibrosis.
Methods
The study prospectively enrolled a total of 116 patients with chronic liver disease who underwent 2D-SWE, TE, laboratory testing, and liver biopsy on the same day from two tertiary care hospitals. One patient with unreliable measurement was excluded. The measurement of 2D-SWE was considered acceptable when a homogenous color pattern in a region of interest of at least 10 mm was detected at 10 different sites. Diagnostic performance was calculated using area under the receiver operating characteristic curve (AUROC).
Results
Liver fibrosis stages included F0 (18%), F1 (19%), F2 (24%), F3 (22%), and F4 (17%). Interclass correlation coefficient for inter-observer agreement in 2D-SWE was 0.994 (95% confidence interval [CI], 0.988 to 0.997). Overall, the results of 2D-SWE and stages of histological fibrosis were significantly correlated (r = 0.601, p < 0.001). For The 2D-SWE showed good diagnostic ability (AUROC, 0.851; 95% CI, 0.773 to 0.911) comparable to TE (AUROC, 0.859; 95% CI, 0.781 to 0.916) for the diagnosis of significant fibrosis (≥ F2), and the cut-off value was 5.8 kPa. AUROC and optimal cut-off of 2D-SWE for the diagnosis of liver cirrhosis were 0.889 (95% CI, 0.817 to 0.940) and 9.6 kPa, respectively. TE showed similar diagnostic performance in distinguishing cirrhosis (AUROC, 0.938; 95% CI, 0.877 to 0.974; p = 0.08).
Conclusions
2D-SWE is comparable to TE in diagnosing significant fibrosis and liver cirrhosis with high reliability.
INTRODUCTION
Chronic liver disease (CLD) is a global public health challenge that is silent and underestimated [1]. Regardless of its etiology, the most important question is whether it proceeds with liver cirrhosis or hepatocellular carcinoma. Liver cirrhosis may be accompanied by various complications due to portal hypertension. Therefore, it is very important to determine the degree of fibrosis in patients with CLD to predict their prognosis [2]. However, it is difficult to accurately evaluate the degree of fibrosis in the liver via ultrasonography or computed tomography [3]. Although liver biopsy is the gold standard for identifying the stage of fibrosis, it is invasive. Thus, it can lead to fatal complications such as major bleeding or even death [4]. The stage of liver fibrosis can also be mistaken due to sampling error or ambiguity due to inter-observer variations [5]. Histopathologic staging of liver fibrosis represents a moment in the course of the disease [5]. Clinicians cannot monitor the clinical changes unless repeated biopsy is performed, which is almost impossible [5]. For these reasons, the stage of liver fibrosis using non-invasive methods has been studied for a long time. Models of fibrosis using serum markers such as aspartate transaminase (AST)-to-platelet ratio index (APRI) [6], fibrosis-4 (FIB-4) [7], or Lok index [8] have been proposed. However, they are not widely used in routine practice due to their low correlation with actual fibrosis [9]. The development of elastography based on ultrasound has enabled a highly intuitive prediction of the severity of fibrosis compared with models based on serum markers [10]. Liver stiffness measured with elastography is reproducible and relatively consistent between inspectors compared with liver biopsy [11], enables longitudinal assessment for patients. It is well known that transient elastography (TE) (FibroScan, Echosens, Paris, France), the first technique developed to measure liver stiffness using ultrasound, is strongly correlated with the stage of histopathologic fibrosis [10,12] and portal hypertension [13]. However, TE is limited by the inability to identify the region of interest (ROI) directly during the examination and the need for additional equipment besides ultrasonography for measuring liver stiffness [14]. These drawbacks have led to the development of a new shear wave elastography (SWE) in two dimensions such as point SWE and real-time SWE [15]. Two dimensional-SWE (2D-SWE) is expected to show validity similar to TE [16–18]. Thus, the aim of this study was to determine whether the newly developed 2D-SWE, S-Shearwave Imaging (RS85) from Samsung Medison (Seoul, Korea) known to generate shear wave using multiple acoustic radiation forces to provide a reliability measurement index (RMI) map, can facilitate a more precise quantification of liver stiffness than TE.
METHODS
Patients
Between May and December 2018, a total of 116 patients with CLD in two referral hospitals were prospectively enrolled according to the study protocol. All patients were over 18 years old. They underwent liver biopsy, TE, and RS85 on the same day. Blood tests including platelet count, alanine transaminase (ALT), AST, total bilirubin, and prothrombin time (international normalized ratio) were done. Serum markers FIB-4 index and APRI for predicting liver fibrosis were calculated to compare thsir diagnostic performance with S-Shearwave Imaging. Exclusion criteria were: (1) decompensated cirrhosis with complications such as spontaneous bacterial peritonitis and variceal bleeding; (2) patients diagnosed with hepatocellular carcinoma or malignancy of biliary system; (3) inadequate liver biopsy samples; (4) coexistence of chronic disease involving kidney, heart, or respiratory system; and (5) elevated AST or ALT level greater than 200 IU/L. A total of 115 patients with CLD who met the eligibility criteria were included. This study was performed after obtaining ethics approval from the institutional clinical research ethics committee. Written informed consent was obtained from each participant (IRB No.2018-03-004-003, 2018-03-008).
Study procedure
S-Shearwave Imaging
S-Shearwave Imaging™ is a recently developed point SWE. It is an updated version of a previous one [19]. S-Shearwave Imaging can be used to assess liver stiffness in patients with CLD using a Samsung Medison, RS85 ultrasound system and a CA1-7A convex probe. S-Shearwave Imaging (referred to as 2D-SWE) yields an image containing both stiffness and RMI maps. The stiffness map shows a pattern of stiff (red color) and soft (blue color). The RMI map provides a relative reliable elasticity value in white to yellow but turns red to black if the value is not reliable (Fig. 1). It is calculated using the weighted sum of the residual of the weight equation and magnitude of the shear wave [19]. All patients underwent S-Shearwave Imaging test after at least 2 hours of fasting. The examination of the patient was carried out in a supine position with the right arm in maximal abduction. All measurements were conducted via an intercostal approach for the right lobe of the liver by two experienced physicians.
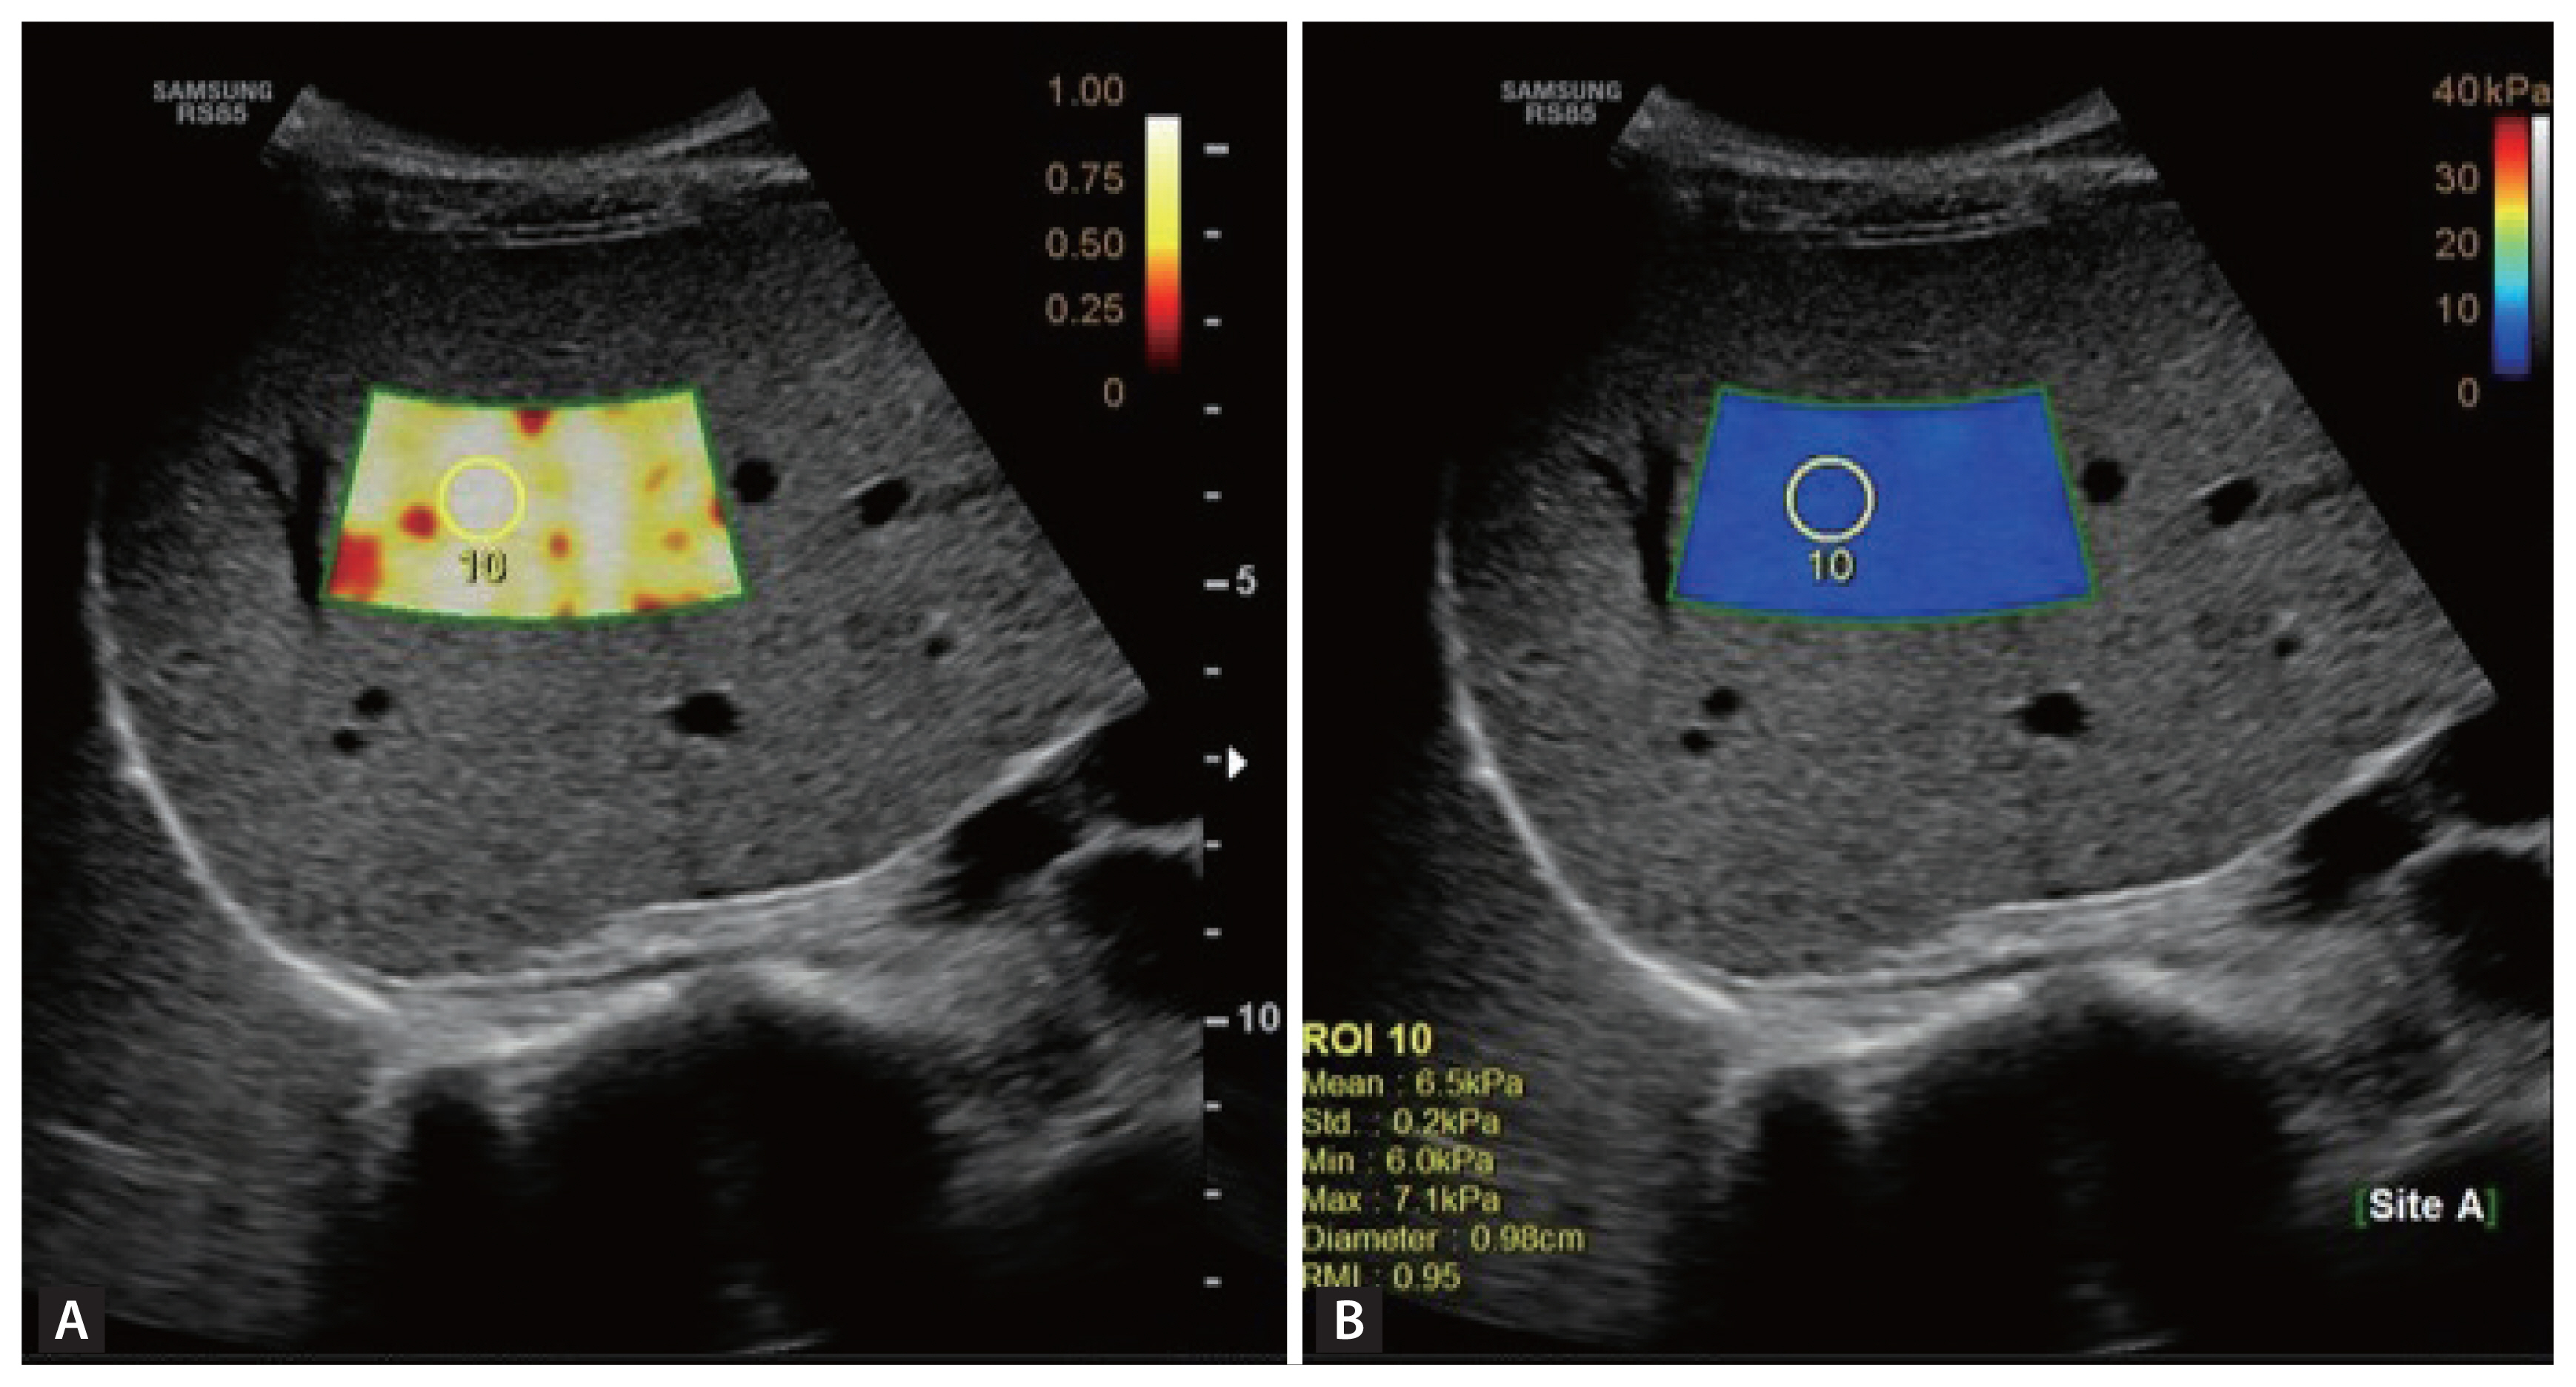
S-Shearwave Imaging (Samsung Medison) generated both (A) reliability measurement index (RMI) map and (B) stiffness map simultaneously. When a 1 cm circular region of interest (ROI) was selected guided by the RMI color-coded sample box above 0.8, the value of liver stiffness was captured from the stiffness map.
All measurements were based on the color pattern and RMI maps. S-Shearwave Imaging was considered reliable when the ROI showed a homogenous color pattern, and the RMI was above 0.8, and when the interquartile range (IQR) divided by the median value was less than 30% of the median liver stiffness based on 10 measurements in each patient. Ten consecutive mean 2D-SWE measurements were obtained in different shear-wave image frames. S-Shearwave Imaging was performed by two experienced physicians.
Transient elastography
TE was performed in all patients with a FibroScan (Echosens, Paris, France). The operator who performed S-Shearwave Imaging performed the TE examination. A total of 10 measurements were carried out and their median value was calculated. A reliable measurement was considered when the IQR/median value was less than 30% and the success rate was more than 60%. The method of TE was almost similar to Shearwave Imaging.
Liver biopsy
Liver biopsy was interpreted by a trained pathologist who was blinded to test results. Samples were considered “adequate” when they met the American Association for the Study of Liver Diseases (AASLD) criteria [20]. The amount of liver fibrosis was graded by the METAVIR system as follows: F0, absent fibrosis; F1, portal fibrosis; F2, periportal fibrosis; F3, architecture distortion without cirrhosis; and F4, cirrhosis [21].
Statistical analysis
All statistical analyses were performed using SPSS version 25.0 (IBM Co., Armonk, NY, USA), MedCalc Software (Mariakerke, Belgium), and R statistics (R Foundation for Statistical Computing, Vienna, Austria). Continuous variables are described as mean ± standard deviation (SD). Nominal variables are expressed as the number of samples and percentages. The adopted cut-off of p value was 0.05. Pearson’s correlation coefficients were calculated to identify the association between non-invasive tools. The inter-observer agreement was estimated with interclass correlation coefficient (ICC) when performing 2D-SWE test. Kruskal–Wallis tests were used to compare the liver stiffness value of 2D-SWE and TE according to the etiology of CLD. Diagnostic performance was evaluated by area under the receiver operating characteristic curve (AUROC) by dividing each stage into binary groups (≥ F2 and < F2, for example). The optimal cut-off value was calculated based on Youden index, sensitivity, and specificity. Positive and negative predictive ratios were calculated based on the cut-off value. ROC curves of 2D-SWE and TE were compared with the deLong method. Weighted AUROC was also used to evaluate the performance with an Obuchowski method using nonbinROC package of R statistics [22]. The penalty function was defined as the proportional difference in METAVIR stage. The penalty function was 0.25 when the step difference was 1, 0.5 when the difference was 2, 0.75 when the difference was 3 and 1 when the difference was 4 [23].
RESULTS
The analysis included 115 patients after excluding one patient who failed to show reliable measurement on S-Shearwave Imaging. There was no technically failed examination. Patients’ characteristics are summarized in Table 1. The mean ± SD of age was 49.4 ± 12.9 years. The study included 63 (55%) male patients. The most common etiology of CLD was non-alcoholic fatty liver disease (30%), followed by chronic hepatitis B (22%). Liver fibrosis stages included F0 (18%), F1 (19%), F2 (24%), F3 (22%), and F4 (17%). Mean values of liver stiffness by 2D-SWE and TE were 9.05 ± 5.34 and 10.54 ± 7.82 kPa, respectively. The liver stiffness measured using 2D-SWE showed positive correlation with TE (r = 0.717, p < 0.001), FIB-4 index (r = 0.493, p < 0.001). and APRI score (0.392, p < 0.001). Box plots of liver stiffness of 2D-SWE and TE according to each stage are shown in Fig. 2. Mean ± SD values of liver stiffness measured at each pathologic stage are listed in Table 2. The etiology of CLD did not affect the stiffness measured by 2D-SWE and TE (p = 0.780 and p = 0.890, respectively).
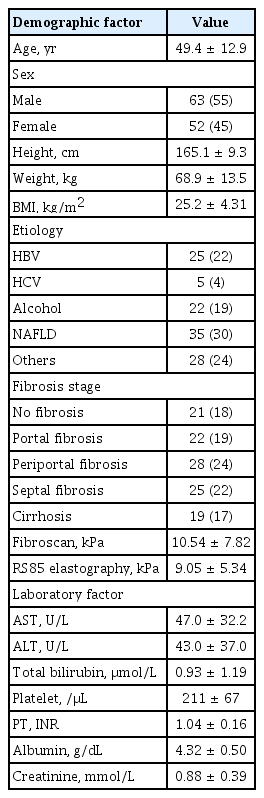
Baseline characteristics of patients (n = 115)

Box plots of (A) two-dimensional shear wave elastography (2D-SWE) and (B) transient elastography (TE) for each liver fibrosis METAVIR stage.
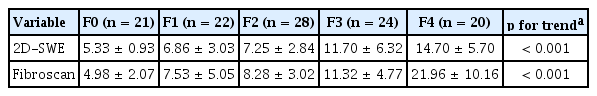
Liver stiffness measurement via 2D-SWE according to fibrosis stage
Thirty-eight patients were included in the inter-observer reproducibility study. The ICC was 0.994 (95% confidence interval [CI], 0.988 to 0.997). The correlation between the two examiners and the results of Bland-Altman analysis are shown in Fig. 3.
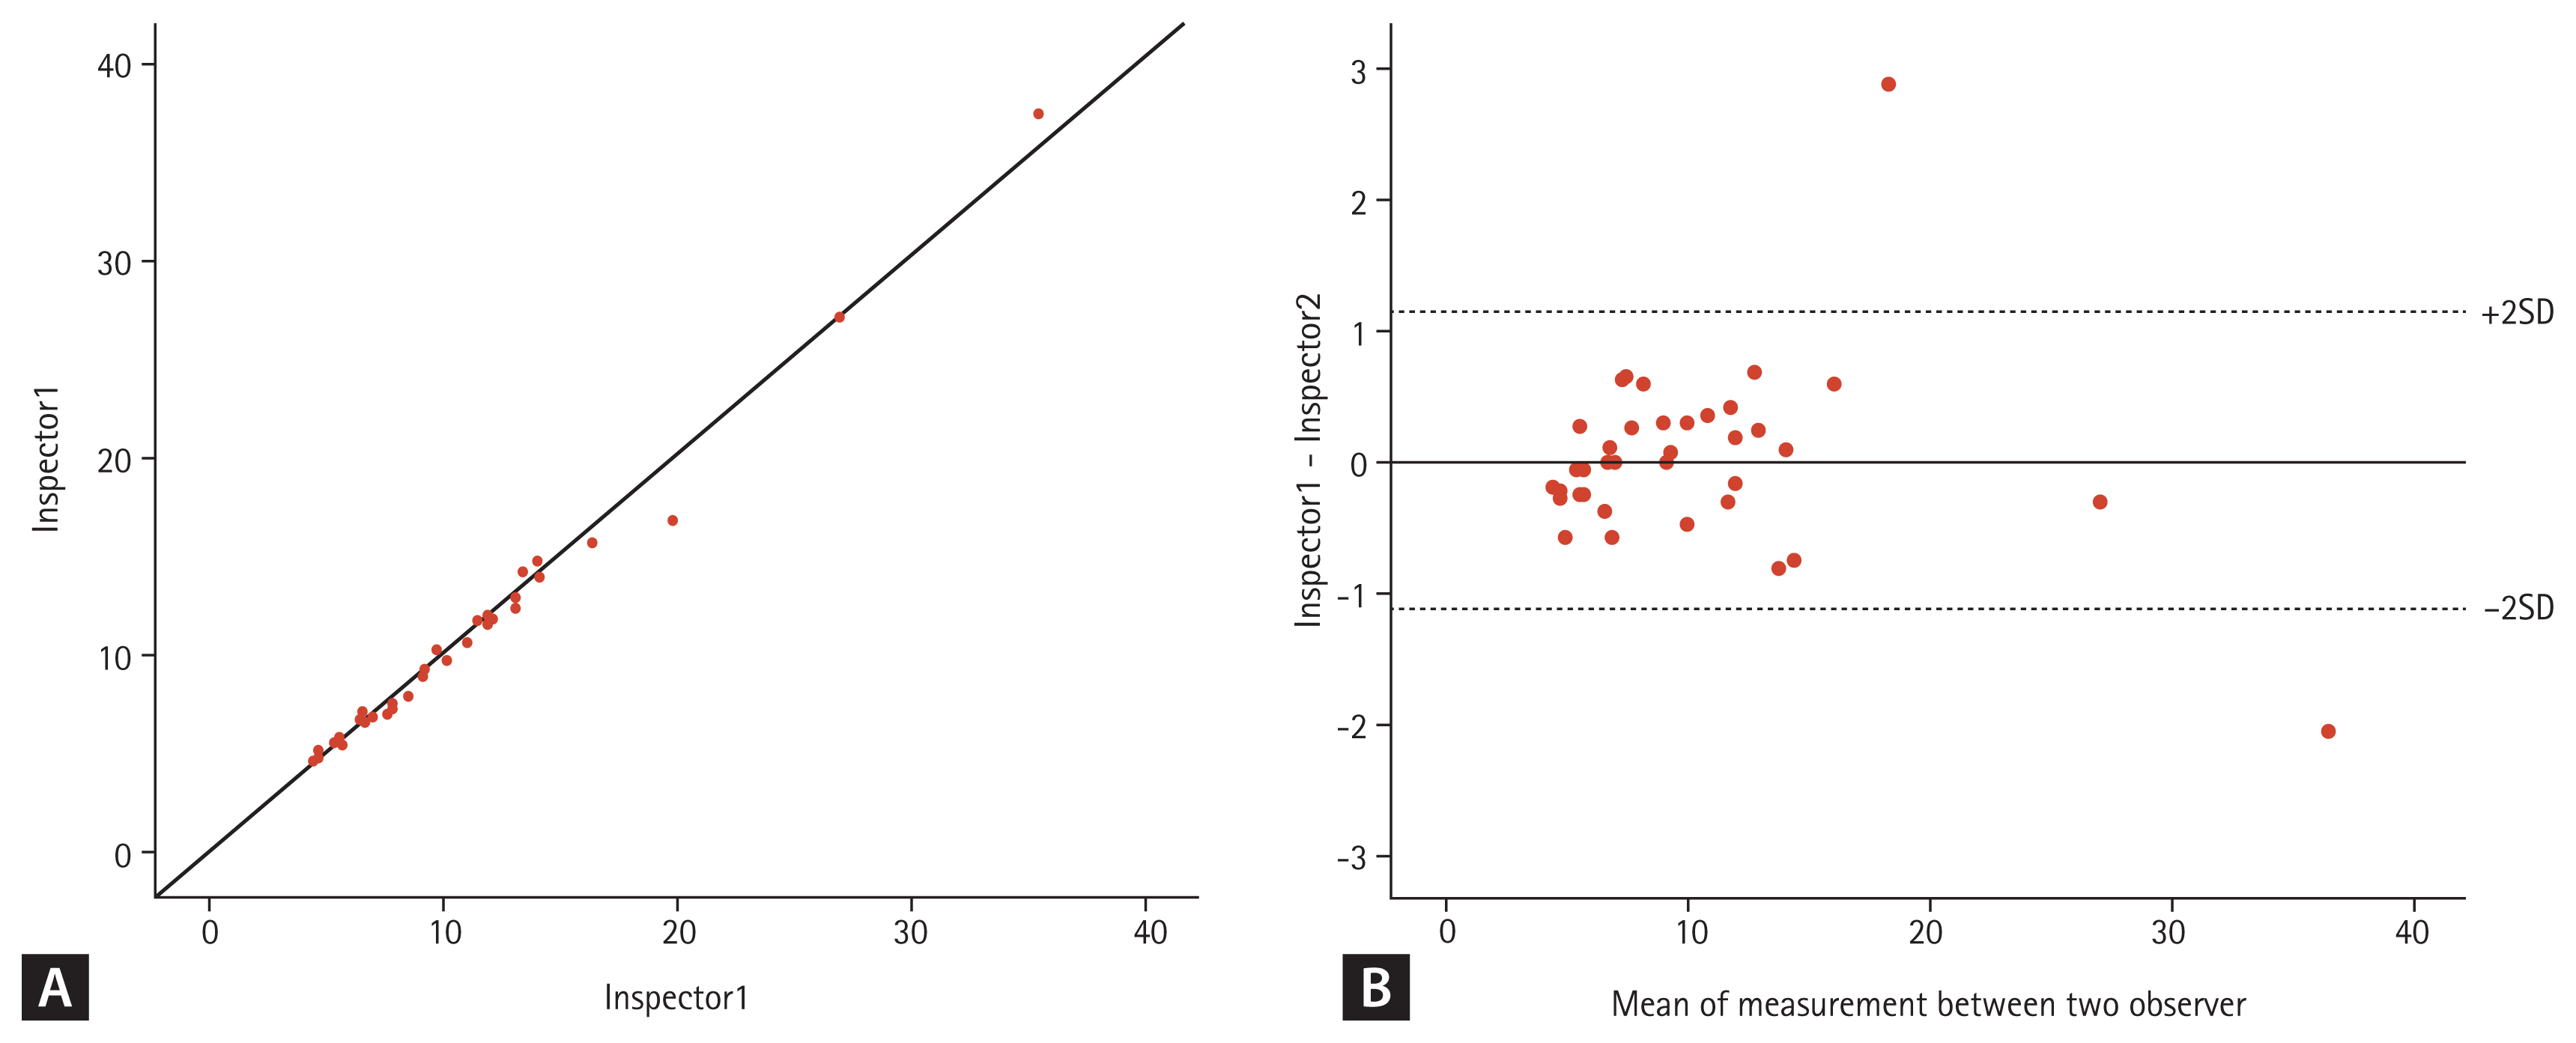
(A) Correlation between two examiners and (B) results of Bland-Altman analysis. SD, standard deviation.
The diagnostic ability of 2D-SWE for predicting each stage of fibrosis is summarized in Table 3. The AUROC for predicting ≥ F2 was 0.851 (95% CI, 0.773 to 0.911). The optimal cut-off value for predicting ≥ F2 was 5.83 kPa. The sensitivity and specificity of this estimated cut-off value were 88.9% and 77.4%, respectively. It showed higher predictability than APRI and FIB-4 index, which showed AUROCs of 0.683 (95% CI, 0.581 to 0.784; p = 0.002) and 0.732 (95% CI, 0.637 to 0.826; p = 0.014), respectively. AUROCs for predicting ≥ F3 and cirrhosis with 2D-SWE were 0.917 (95% CI, 0.851 to 0.960) and 0.889 (95% CI, 0.817 to 0.940), respectively, with cut-off values of 7.55 and 9.58 kPa, respectively. When applying the cut-off value of 9.58 kPa for diagnosing cirrhosis, the sensitivity and specificity were 95.0% and 82.1%, respectively. 2D-SWE distinguished cirrhosis more precisely than APRI (AUROC, 0.753; 95% CI, 0.653 to 0.852; p = 0.164) and FIB-4 index (AUROC, 0.854; 95% CI, 0.779 to 0.928; p = 0.436). We also calculated the adjusted AUROC using the Obuchowski method. The overall accuracy of 2D-SWE for predicting every stage of liver fibrosis was 0.943. Pairwise accuracies for predicting each stage of liver fibrosis are described in Table 4.
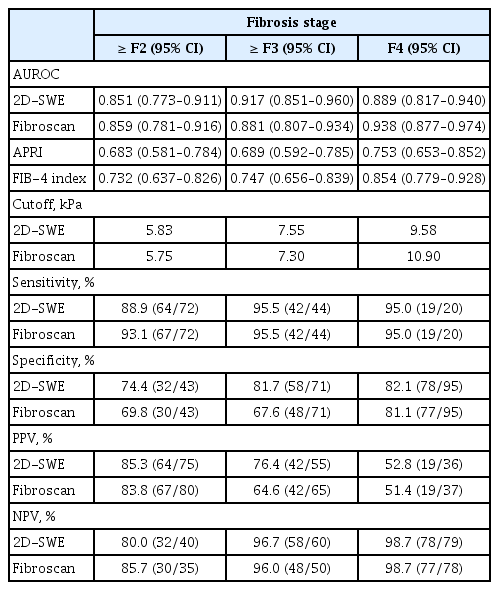
Diagnostic accuracy and optimal cutoff values of 2D-SWE and TE in liver fibrosis
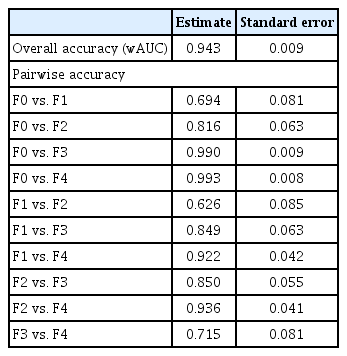
Diagnostic performance of RS85 using the Obuchowski method
The performance of 2D-SWE was comparable to that of TE in that 2D-SWE predicted liver fibrosis stage similar to TE. AUROCs for identifying ≥ F2 and ≥ F3 with TE were 0.859 (95% CI, 0.781 to 0.916) and 0.881 (95% CI, 0.807 to 0.934), respectively. The AUROC for predicting cirrhosis with TE was 0.938 (95% CI, 0.877 to 0.974). There was no significant difference in AUROC for predicting each stage of liver fibrosis between 2D-SWE and TE (F2, F3, F4 were p = 0.793, p = 0.140, and p = 0.078, respectively). The ROC curves of 2D-SWE and TE for predicting each stage are shown in Fig. 4.
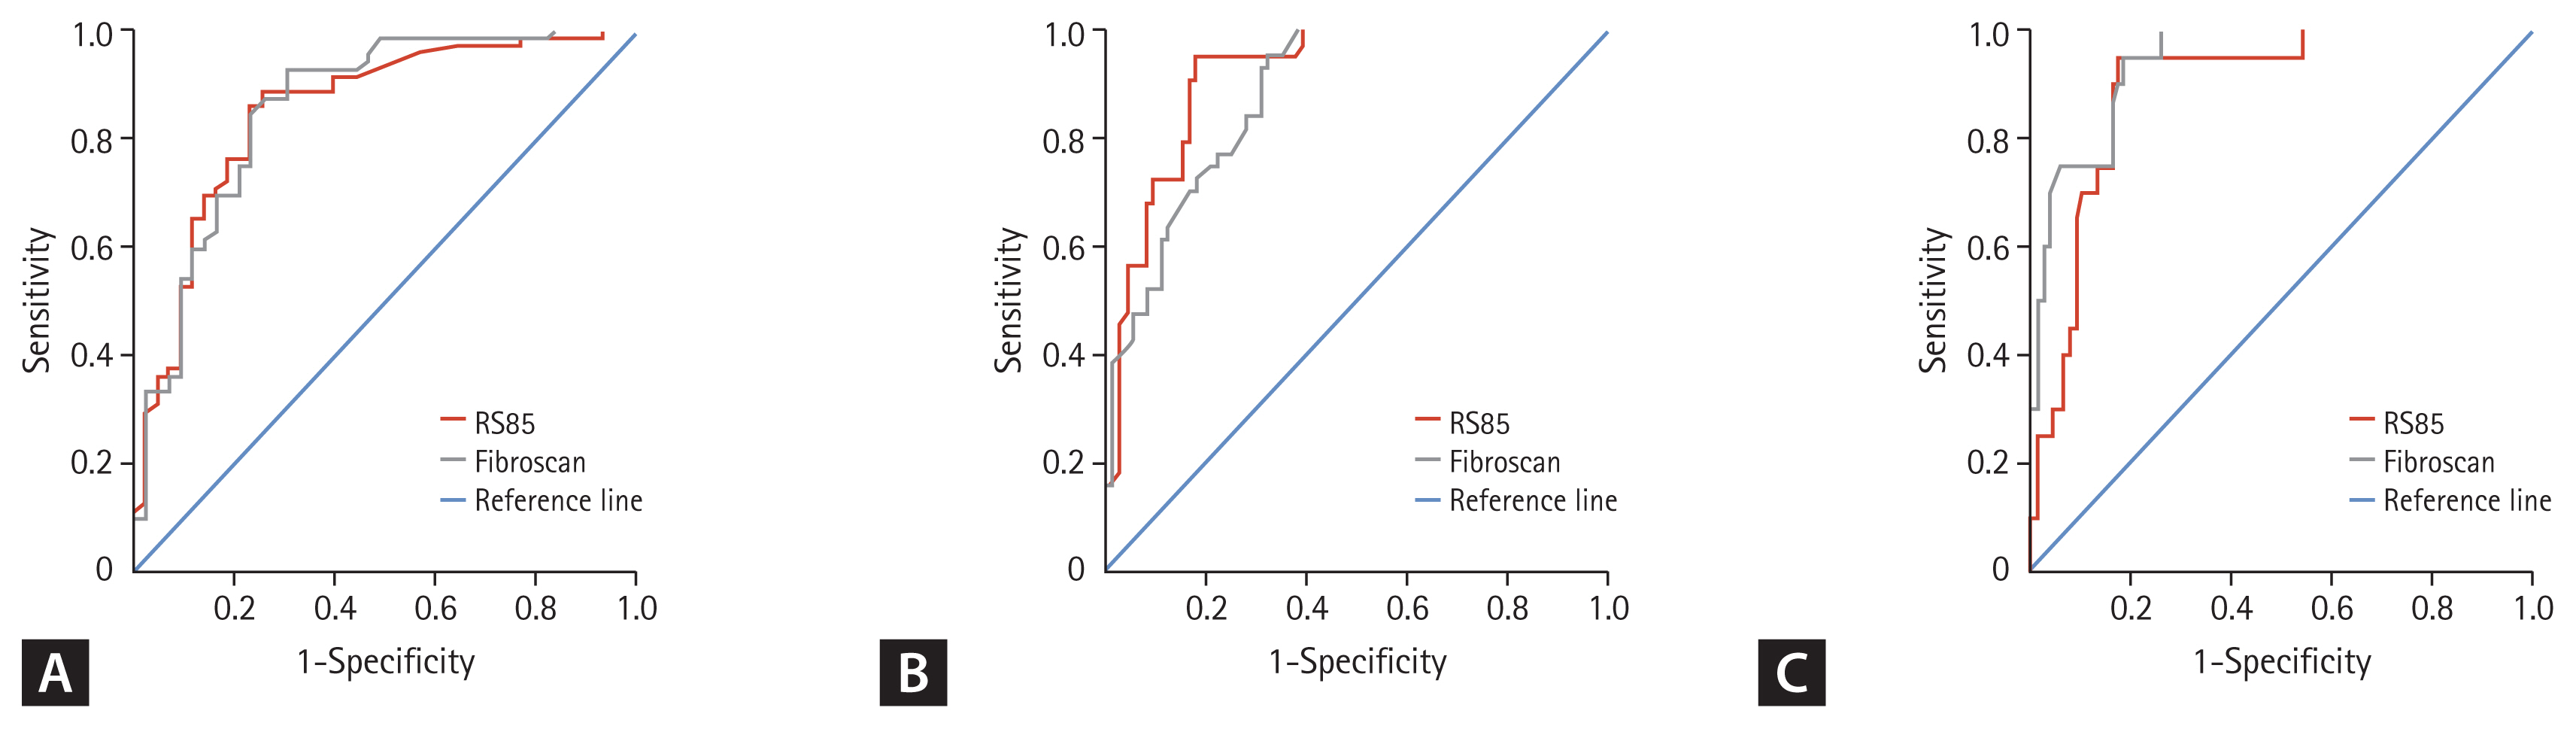
Receiver operating characteristic (ROC) curves of two-dimensional shear wave elastography and transient elastography for (A) ≥ F2, (B) ≥ F3, (C) F4. Both machines differentiated each fibrosis stage very well.
DISCUSSION
Our results suggest that 2D-SWE is a reproducible and useful method for predicting the stage of liver fibrosis. Liver stiffness measurements with 2D-SWE were comparable to TE in differentiating the stage of liver fibrosis. Optimal cut-off values for predicting F2 and F4 using 2D-SWE were 5.75 and 10.90 kPa, respectively. In a previous study [16] using another type of 2D-SWE, the cut-off value obtained from GE elastography was 5.33 kPa for estimating F2 and 7.59 kPa for estimating F4. Other studies [16,18,24,25] investigating 2D-SWE applications with SuperSonic imaging revealed cut-off values ranging from 7.29 to 10.6 kPa for predicting F2 and from 11.5 to 18.1 kPa for predicting F4. Estimated cut-off values from our study were similar to those obtained via GE elastography, but lower than those of SuperSonic imaging. The value of liver stiffness measurement varied according to the ultrasound system used. This study is a prospective study describing the validity and reliability of an updated version (RS85) of a recently developed 2D-SWE ultrasound system introduced by Samsung Medison. This machine is equipped with several advanced technologies to provide a user-friendly system with improved accuracy. An additional image of RMI shows reliable results of 2D-SWE for clinical measurement of liver stiffness by filtering out unreliable results. RMI is calculated by analyzing the extent of deviation of the measured shear wave compared with the originally expected value. Clinicians can obtain a highly reliable liver stiffness value more intuitively by comparing the stiffness and the RMI maps on the same screen. Thus, 2D-SWE is expected to be easily accessible clinically for beginners.
Similar to other modalities used to evaluate the diagnostic performance of other SWEs, the 2D-SWE can be used to differentiate the stage of liver fibrosis accurately. Its diagnostic performance was not inferior to that of TE [18].
An important advantage of this study was that it prospectively enrolled patients in accordance with the study protocol. Second, liver fibrosis stages were relatively evenly distributed. Although some previous studies evaluated the liver fibrosis stages with a similar purpose, the distribution of fibrosis stage in those studies was biased. TE was performed simultaneously in patients enrolled at baseline, to ensure precise and accurate comparison of 2D-SWE and TE in a larger number of patients than in the previous study [18]. Another strength of our study was the AUROC was adjusted for predicting the fibrosis stage via weighted AUC as well as binominal AUROC.
This study has some limitations. Although S-Shearwave Imaging showed excellent inter-observer agreement, the intra-observer agreement was not evaluated. A recent study with identical 2D-SWE (RS85, Samsung Medison) showed an intra-observer agreement of 0.995 (95% CI, 0.988 to 0.998) [19]. It is expected to show a similar result. Additionally, the number of patients was limited in this study to determine the effect of each etiological factor on CLD. Comparative studies evaluating different etiologies are needed in the future. In this study, the calculated cut-off value for cirrhosis of TE was 10.9 kPa, which is relatively lower than the value reported previously. In previous studies with larger numbers, the estimated cut-off value for F4 using TE was 11.9 to 12.5 kPa [26,27]. The lower cut-off value may be attributed to the diverse etiology and prevalence of cirrhosis in our cohort [28].
In summary, the newly developed S-Shearwave Imaging facilitates non-invasive evaluation of the degree of liver fibrosis with performance comparable to that of previous 2D-SWE and TE techniques.
KEY MESSAGE
1. Two-dimensional shear wave elastography (2D-SWE) is a useful non-invasive tool for assessing liver fibrosis and showed good correlation between observers.
2. 2D-SWE demonstrated similar diagnostic performance to transient elastography in detecting significant fibrosis and cirrhosis.
Acknowledgments
This work was supported by the Soonchunhyang University Research Fund.
Notes
This work was supported partly by Samsung Medison. No potential conflict of interest relevant to this article was reported.