Reduction in proteinuria after immunosuppressive therapy and long-term kidney outcomes in patients with immunoglobulin A nephropathy
Article information

Abstract
Background/Aims
Despite controversy regarding the benefits of immunosuppressive therapy in immunoglobulin A nephropathy (IgAN), clinical outcomes may vary depending on the patient’s responsiveness to this therapy. This study evaluated long-term kidney outcomes according to the extent of proteinuria reduction after immunosuppression in IgAN patients.
Methods
Among 927 patients with biopsy-proven IgAN, 127 patients underwent immunosuppression. Time-averaged urine protein-creatinine ratio before and within 1 year after start of immunosuppression were calculated, and responsiveness to immunosuppression was assessed as the reduction of proteinuria between the two periods. Patients were classified into tertiles according to the extent of proteinuria reduction. We compared the slopes of estimated glomerular filtration rate (eGFR) decline using a linear mixed model, and estimated hazard ratios (HRs) for disease progression (defined as development of a ≥ 30% decline in eGFR or end-stage renal disease) using a Cox proportional hazard model.
Results
Median extent of proteinuria reduction was −2.1, −0.9, and −0.2 g/gCr in the first, second, and third tertiles, respectively. There were concomitant changes in the slopes of annual eGFR decline: −2.03, −2.44, and −4.62 mL/min/1.73 m2 among the first, second, and third tertiles, respectively. In multivariable Cox analysis, the HRs (95% confidence intervals) for disease progression were 0.30 (0.12 to 0.74) in the first tertile and 0.70 (0.34 to 1.45) in the second tertile compared with the thirdtertile.
Conclusions
This study showed that greater proteinuria reduction after immunosuppression was associated with a lower risk of disease progression in patients with IgAN, suggesting that responsiveness to immunosuppression may be an important determinant of kidney outcomes.
INTRODUCTION
Immunoglobulin A nephropathy (IgAN) is the most common primary glomerulonephritis worldwide, and the prevalence of IgAN is higher in East Asians than in other ethnicities [1,2]. It is not a totally benign disease, because 20% to 40% of patients progress to end-stage renal disease (ESRD) within 20 years after diagnosis [3,4]. Therefore, timely and proper treatment is required to delay the progression of IgAN.
Multiple factors are involved in the development of IgAN, but a key step in pathogenesis is the formation of immune complexes by binding of autoantibodies to galactose-deficient IgA1 [5]. This immunologic mechanism has provided the rationale for immunosuppressive therapy in the management of IgAN. In fact, several randomized controlled trials have published findings suggesting that corticosteroid treatment reduces proteinuria and improves kidney survival in patients with IgAN [6–8]. Based on these results, the Kidney Disease: Improving Global Outcome (KDIGO) clinical guidelines published in 2012 included indications for corticosteroid use as a therapeutic option in IgAN. However, evidence level for this suggestion is low, and the first line therapy is still supportive care involving control of blood pressure and proteinuria with renin-angiotensin-aldosterone system (RAAS) blockers. Immunosuppressive therapy can be considered in patients with persistently elevated urinary protein excretion (≥ 1 g/day) after 3 to 6 months of maximal supportive care [9]. Nevertheless, the use of immunosuppression is not widely favored because not all patients show consistent responsiveness to corticosteroids and there are many concerns regarding the serious adverse effects of immunosuppression [10]. Moreover, a recent German study failed to demonstrate superiority of immunosuppressive treatment over intensive supportive care in IgAN patients with persistent proteinuria [11]. For this reason, the panels from the KDIGO controversies conference in 2018 do not strongly support use of immunosuppression in patients with IgAN [12].
Despite such controversy, immunosuppression is still a therapeutic option in real-world clinical practice and clinical outcomes may vary depending on patients’ responsiveness to this therapy. Several studies have investigated factors associated with responsiveness to immunosuppressive therapy and shown that immunosuppressive drugs can be effective, particularly in the presence of existence of endocapillary proliferation, preserved renal function, and a higher amount of proteinuria [13,14]. Among these, proteinuria has long been recognized as the strongest risk factor for the progression of IgAN [15–18]. There are various patterns of proteinuria response to immunosuppression. Some patients show sustained remission, while others experience a rebound increase in proteinuria after discontinuation of immunosuppressive drugs. However, few studies have examined the relationship between the degree of proteinuria reduction after immunosuppressive therapy and long-term kidney outcomes. Therefore, in this retrospective, observational study, we used proteinuria reduction as a surrogate marker for responsiveness to immunosuppressive therapy and investigated the progression of kidney disease in patients with IgAN treated with immunosuppressive therapy.
METHODS
Patient selection
A flow diagram of the selection of patients is presented in Fig. 1. Among 927 patients with biopsy-proven IgAN at Yonsei University Severance Hospital and National Health Insurance Services Ilsan Hospital between November 2005 and November 2017, a total of 174 patients were considered eligible for the study after excluding those with secondary conditions associated with IgAN (n = 38) and those not treated with immunosuppression (n = 715). Among the patients, those with the following conditions were excluded: age at biopsy < 18 years (n = 2); started dialysis before biopsy (n = 13); baseline estimated glomerular filtration rate (eGFR) < 30 mL/min/1.73 m2 (n = 8); started immunosuppression before biopsy (n = 8); immunosuppression duration < 30 days (n = 5). We further excluded patients with less than two visits after biopsy, those with a follow-up duration of less than 3 months (n = 6), and those with less than two eGFR and proteinuria measurements either before or after the start of immunosuppressive therapy (n = 5). Two patients with a T2 lesion were excluded since they also had eGFR less than 30 mL/min/1.73 m2 at baseline. Therefore, 127 patients were included in the final analysis. Patients were classified into tertiles according to the extent of time-averaged proteinuria (TAP) reduction between before and within 1 year from the start of immunosuppression (Ter1, first tertile; Ter2, second tertile; Ter3, third tertile).
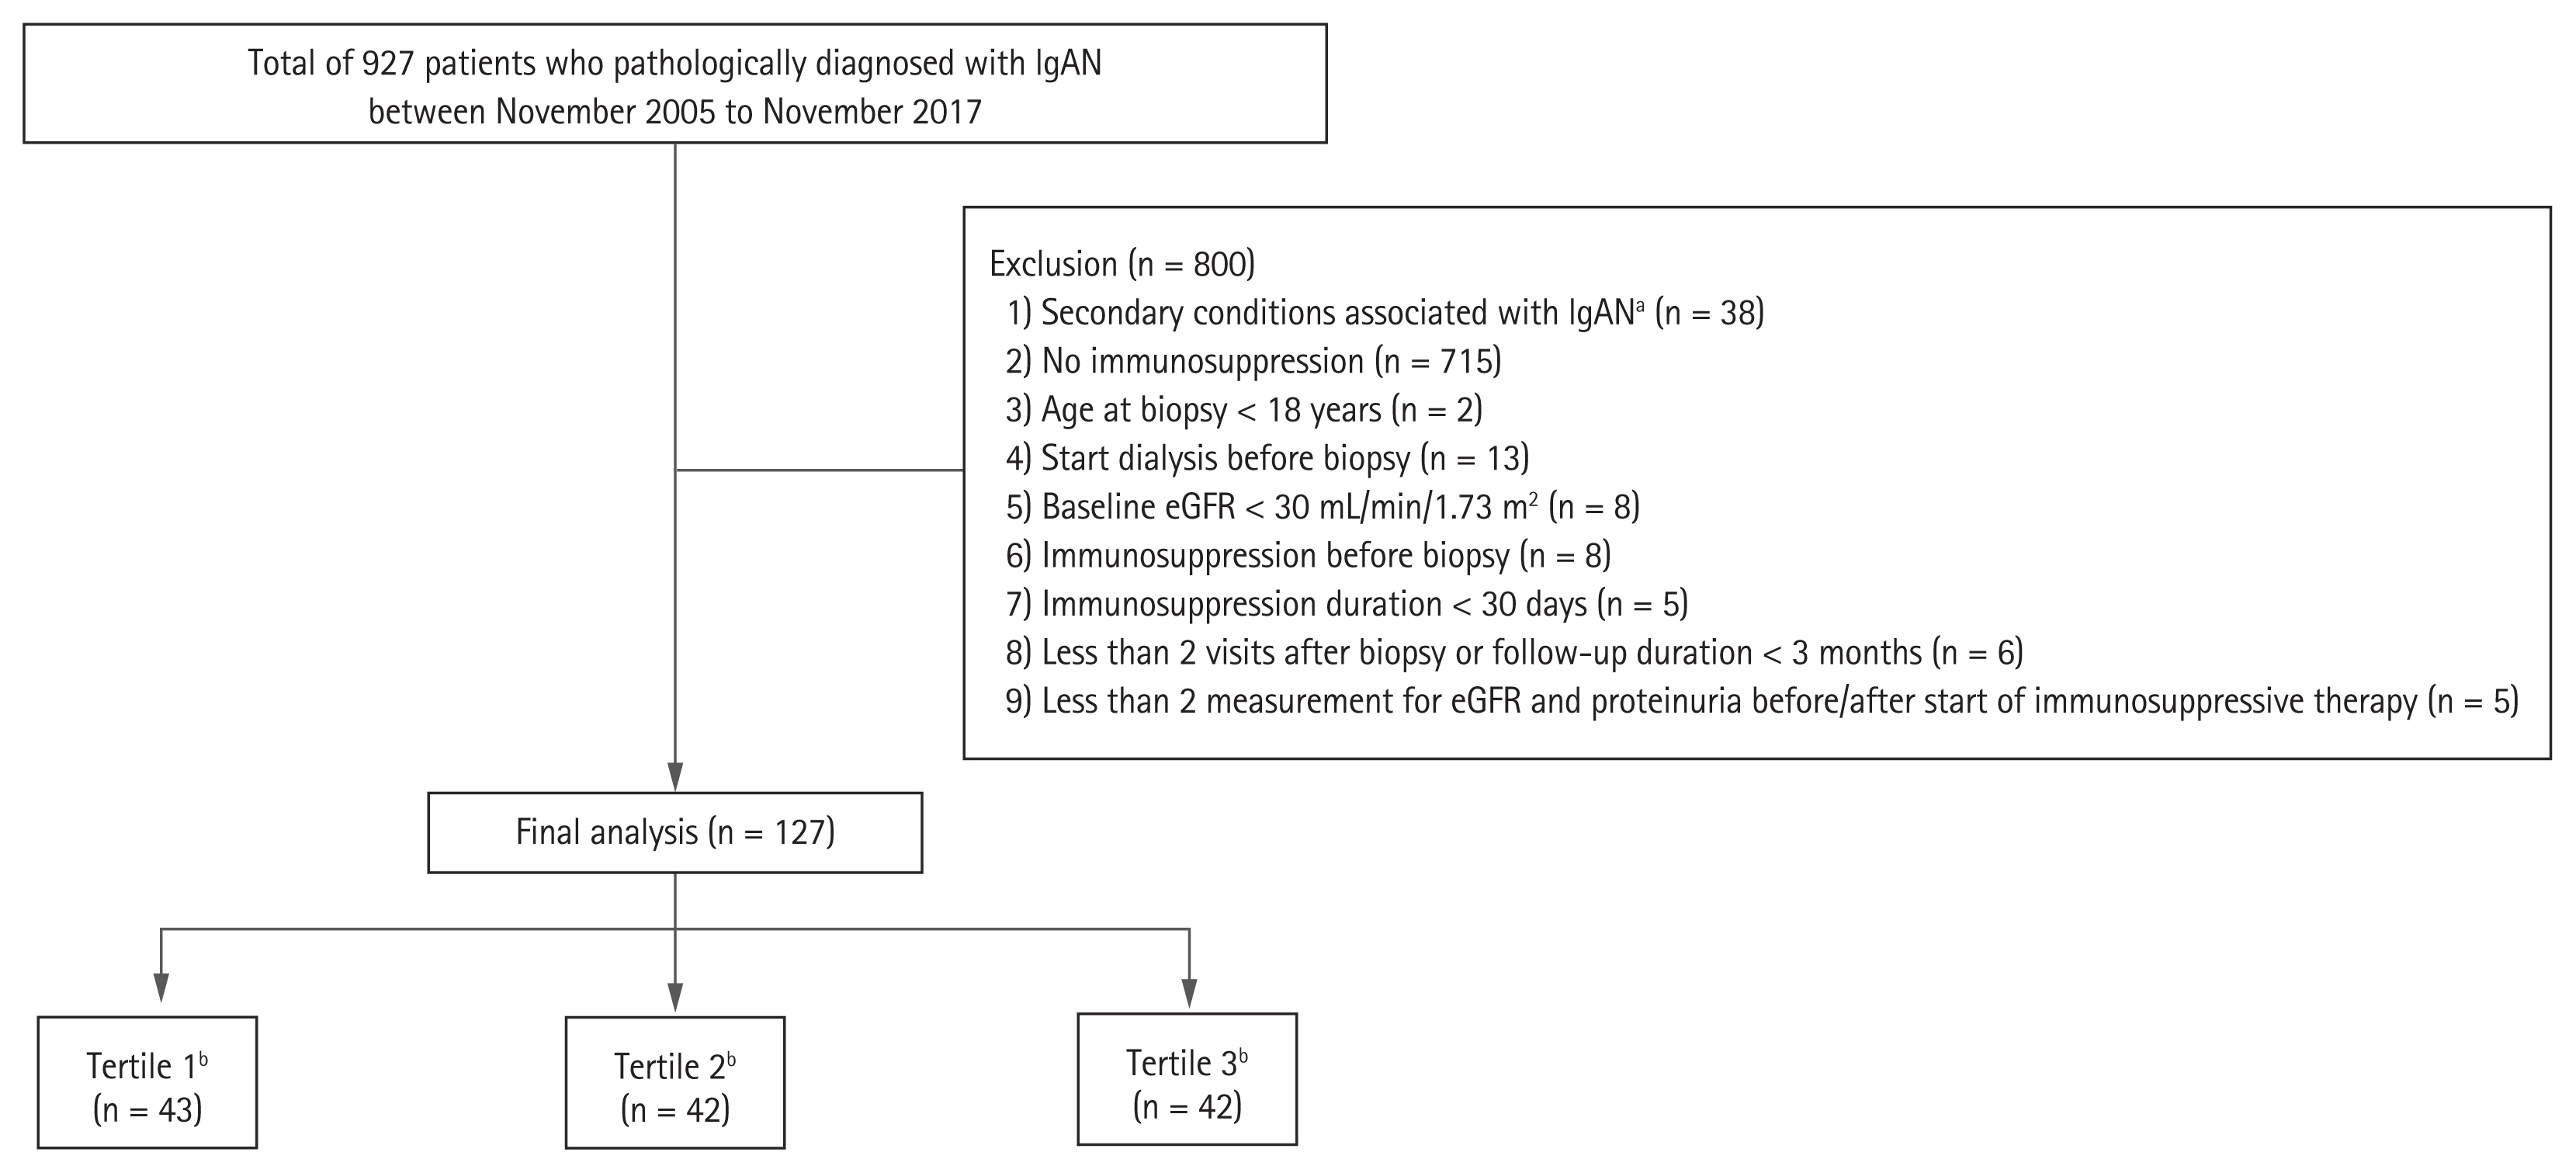
Flow diagram of the study. IgAN, immunoglobulin A nephropathy; eGFR, estimated glomerular filtration rate. aSecondary conditions included infection-associated glomerulonephritis and combined autoimmune disease such as Henoch-Schonlein purpura, systemic lupus nephritis, Sjogren’s syndrome and rheumatoid arthritis, bPatients were categorized into tertiles according to the extent of time-averaged proteinuria reduction after immunosuppression.
The study was conducted in accordance with the Declaration of Helsinki and approved by the Institutional Review Board of Yonsei University Health System Clinical Trial Center (IRB no. 4-2019-0548). Because the study was retrospective and patients were de-identified, the need for written consent from the patients was waived.
Data collection
Baseline demographic and clinical data including age, sex, anthropometric measurements, comorbidities, medication history, and blood pressure were collected at the time of biopsy and at the start of immunosuppressive therapy. Laboratory parameters such as blood urea nitrogen, serum creatinine, hemoglobin, total protein, serum albumin, high-density lipoprotein cholesterol (HDL-C), low-density lipoprotein cholesterol (LDL-C), triglycerides, serum electrolytes, spot urine protein, and urine creatinine were measured. Serum creatinine concentration was measured by the isotope dilution mass spectroscopy traceable kinetic Jaffe assay. The eGFR was calculated using the Chronic Kidney Disease Epidemiology Collaboration (CKD-EPI) equation [19]. During the follow-up period, proteinuria was assessed using the spot urine protein-to-creatinine ratio (UPCR) because 24 hour urine protein quantification was not feasible at every visit. Pathologic findings were presented using the Oxford classification criteria [13,20]. All renal biopsy specimens were reassessed by one pathologist blinded to the patients’ clinical data. Because this was not a randomized controlled study, there was no pre-set regimen, dosage, or duration of immunosuppression. However, we generally followed the glucocorticoid protocol suggested by Pozzi et al. [6] or Manno et al. [7] during the initial 6 months. Additional immunosuppression with other drugs was performed at the physician’s discretion and based on disease status. In this study, we used TAP, because proteinuria at a single time-point cannot reflect overall proteinuria status. TAP was calculated as the weighted mean of UPCR measurements, with weights representing time elapsed since the previous measurement [10]. Pre- and post-immunosuppression (IS) TAPs were determined using all UPCR measurements within 12 months before and after the start of immunosuppression, respectively. Responsiveness to immunosuppression was represented as the reduction in TAP.
Study outcomes
We hypothesized that kidney function decline would be slower over time in patients with greater proteinuria reduction. Our primary outcome of interest was the slope of eGFR decline after the start of immunosuppression. Secondary outcome was disease progression, defined as development of a ≥ 30% decline in eGFR or incident ESRD [21]. To avoid the possibility of transient eGFR reduction being classified as disease progression, at least two consecutive measurements of a ≥ 30% decline in eGFR were ascertained. The first of these consecutive measurements was retrospectively designated as the study endpoint. ESRD was defined as initiation of dialysis or kidney transplantation.
Statistical analysis
Continuous variables are expressed as means and standard deviations and categorical variables as absolute numbers with percentages. Comparisons between groups were performed using Student’s t test or analysis of variance for continuous variables and the chi-square test or Fisher’s exact test for categorical variables. The Shapiro-Wilk test was performed to determine the normality of the distribution of the parameters. If the resulting data did not show a normal distribution, medians and interquartile ranges were reported; the Mann-Whitney U test or Kruskal-Wallis test was then used to compare groups. We computed the slope of eGFR decline in mL/min/1.73 m2 per year by applying a linear mixed-effect model and a sandwich estimator of variance to account for correlation within the same subject. Following terms were included in the linear mixed-effect model: age at start of immunosuppression, sex, time from biopsy to start of immunosuppression, baseline eGFR, pre-IS TAP, time-averaged SBP, serum albumin, and presence of endocapillary hypercellularity. We assumed that patients with proteinuria reduction would continue to show improvement in proteinuria after completion of immunosuppressive therapy. Most immunosuppressive therapy was completed within 12 months. Thus, we performed linear mixed-effect analysis with a turning point at 1 year after the start of immunosuppression. Cox proportional hazard model was constructed to determine if there was an independent association between TAP reduction and disease progression. The model was adjusted for multiple variables that showed statistical significance (p < 0.05) in univariate analysis or had clinical significance in previous studies. Model 1 was the crude model without adjustment. Model 2 was adjusted for age at the start of immunosuppression, sex, time from biopsy to start of immunosuppressive therapy, and baseline eGFR. Model 3 additionally included pre-IS TAP and time-averaged SBP. Finally, Model 4 was created after further adjustment for serum albumin, the presence of endocapillary hypercellularity, and use of renin-angiotensin system blockers at start of immunosuppressive therapy. All results were expressed as hazard ratios (HRs) and 95% confidence intervals (CIs). Adjusted cumulative renal survival curves were plotted after the same adjustments specified for the Cox models. Survival time was defined as the time interval between the time of starting immunosuppression and the onset of the endpoint or last follow-up, and follow-up loss was censored. Restricted cubic splines were used to determine the association between the degree of proteinuria reduction as a continuous variable and the H) for disease progression. For all analyses, a p value of less than 0.05 was considered statistically significant. All statistical analyses were performed using Stata version 15.1 for Windows (StataCorp LLC, College Station, TX, USA).
RESULTS
Baseline characteristics
Decrements in TAP in each tertile group are shown in Supplementary Fig. 1; Ter1 showed the greatest proteinuria reduction. Baseline characteristics of the patients at the time of kidney biopsy are described in Supplementary Table 1. Median proteinuria was 1.8 g/gCr (range, 1.2 to 3.3), median eGFR was 79.3 mL/min/1.73 m2 (range, 61.2 to 103.3), and mean age was 39.6 ± 11.3 years. Seventy-nine patients (62.2%) were female and 104 (81.9%) patients had a history of hypertension. Baseline proteinuria level was significantly higher in Ter1 than in the other two groups. In addition, patients in this group had a higher cholesterol level and lower albumin level than those in the other two groups. There were no significant differences in kidney function, blood pressure, kidney function, or proportion of Oxford-MEST-C components among tertile groups. At the start of immunosuppression, median proteinuria was 2.1 g/gCr (range, 1.4 to 3.5), and median pre-IS and post-IS TAPs were 1.9 g/gCr (range, 1.4 to 3.1) and 1.1 g/gCr (range, 0.6 to 1.6), respectively (Table 1). Median reduction in TAP was −2.1 g/gCr (range, −3.7 to −1.5), −0.9 g/gCr (range, −1.0 to −0.7), and −0.2 g/gCr (range, −0.4 to 0.5), in Ter1, Ter2, and Ter3, respectively. Baseline eGFR at the initiation of immunosuppression was significantly lower in Ter3 than in the other two groups. In addition, the time elapsed from biopsy to the initiation of immunosuppressive therapy was significantly longer in Ter3 than Ter1 and Ter2. Immunosuppression medications included glucocorticoids, cyclophosphamide, mycophenolate, and calcineurin inhibitors. All patients received corticosteroids as first line immunosuppression agents. There were no significant differences in the use and cumulative dose of immunosuppressive drugs or duration of treatment among tertiles.

Baseline characteristics of patients with biopsy-proven IgA nephropathy who underwent immunosuppressive therapy
Changes in eGFR decline rates according to proteinuria reduction
During a mean follow-up of 5.1 years, the overall eGFR decline slope of all patients was −2.97 mL/min/1.73 m2/year (range, −3.99 to −1.95) (Table 2). There were significant differences in kidney function decline rates across the three tertile groups with corresponding slopes of annual eGFR decline of −2.03 mL/min/1.73 m2/year (range, −2.95 to −1.11), −2.44 mL/min/1.73 m2/year (range, −4.71, −0.17), and −4.62 mL/min/1.73 m2/year (range, −6.52, −2.72) for Ter1, Ter2, and Ter3, respectively. Predicted eGFR was derived from a piecewise linear mixed-effect model, and slower eGFR decline was noted in patients with higher TAP reduction; these differences in predicted eGFR persisted over time after completion of immunosuppressive therapy (Fig. 2).

Post-treatment slopes of eGFR and comparison of TAP before and after immunosuppressive therapy
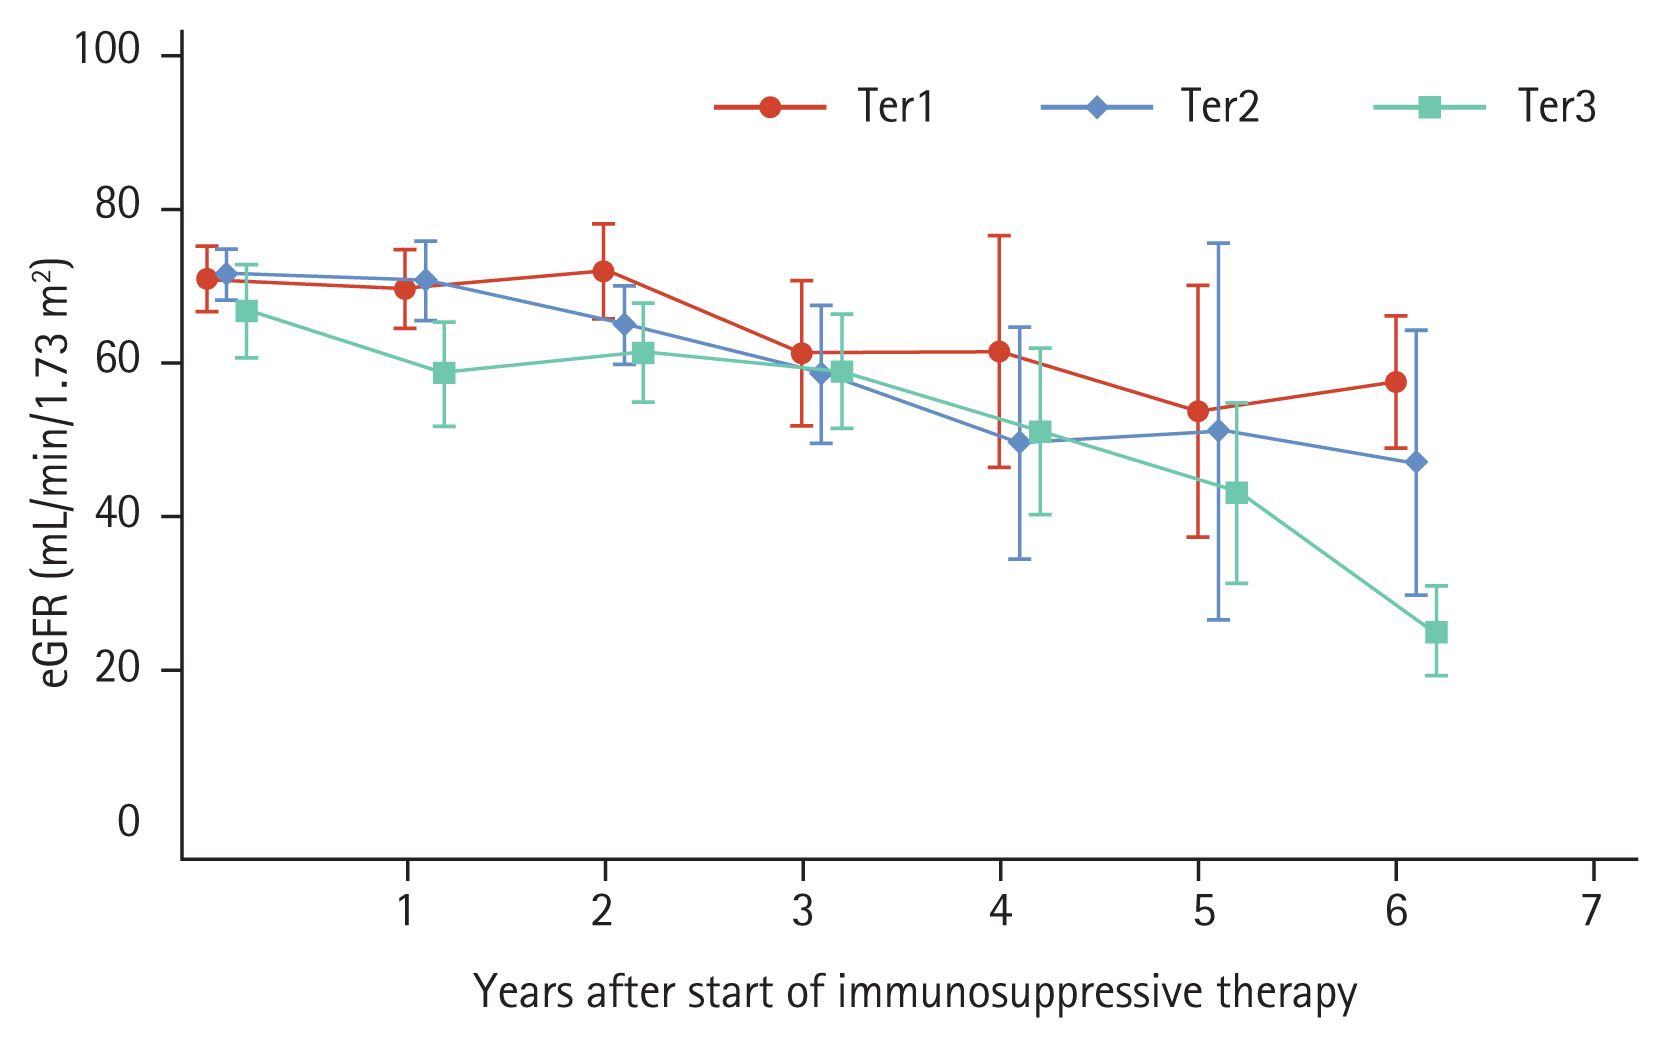
Changes in predicted estimated glomerular filtration rate (eGFR) using a piecewise linear mixed model. Patients were categorized into tertiles according to the extent of time-averaged proteinuria reduction after immunosuppression. The linear mixed model was used to derive the predicted eGFR after adjusting for age at start of treatment, sex, time from biopsy to start of immunosuppressive therapy, baseline eGFR, time-averaged proteinuria before the start of immunosuppressive therapy, time-averaged systolic blood pressure, serum albumin, and presence of endocapillary hypercellularity. Markers and capped spikes represent means and 95% confidence intervals. Ter1, first tertile; Ter2, second tertile; Ter3, third tertile.
Proteinuria reduction and disease progression
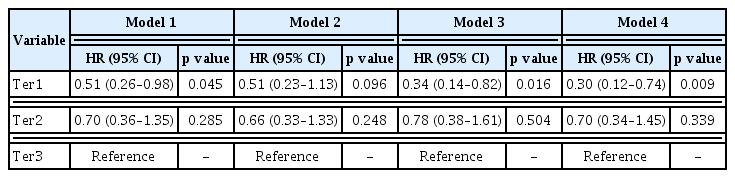
To compare risk of disease progression among tertile groups, a multivariable-adjusted Cox proportional hazard model was constructed. During the follow-up period, disease progression occurred in 14 (32.6%), 14 (33.3%), and 25 (59.5%) patients in Ter1, Ter2, and Ter3, respectively. Corresponding incidence rates were 75.0, 91.8, and 143.1 per 1,000 person-years for the respective tertile groups. In multivariable Cox proportional hazard analysis, the largest reduction in proteinuria was associated with a lower risk of disease progression. HRs (95% CI) for Ter1 and Ter2 compared to Ter3 were 0.33 (range, 0.14 to 0.79) and 0.75 (range, 0.36 to 1.54), respectively (Table 3). Adjusted survival curves showed that time to development of disease progression was significantly longer in patients with greater TAP reduction than in those with the lowest TAP reduction (Fig. 3). Restricted cubic spline curve also showed a non-linear relationship between the extent of proteinuria reduction and the risk for kidney disease progression (Fig. 4). This association was more pronounced in patients with proteinuria < 3.0 g/gCr, but it did not reach statistical significance (Supplementary Table 2).
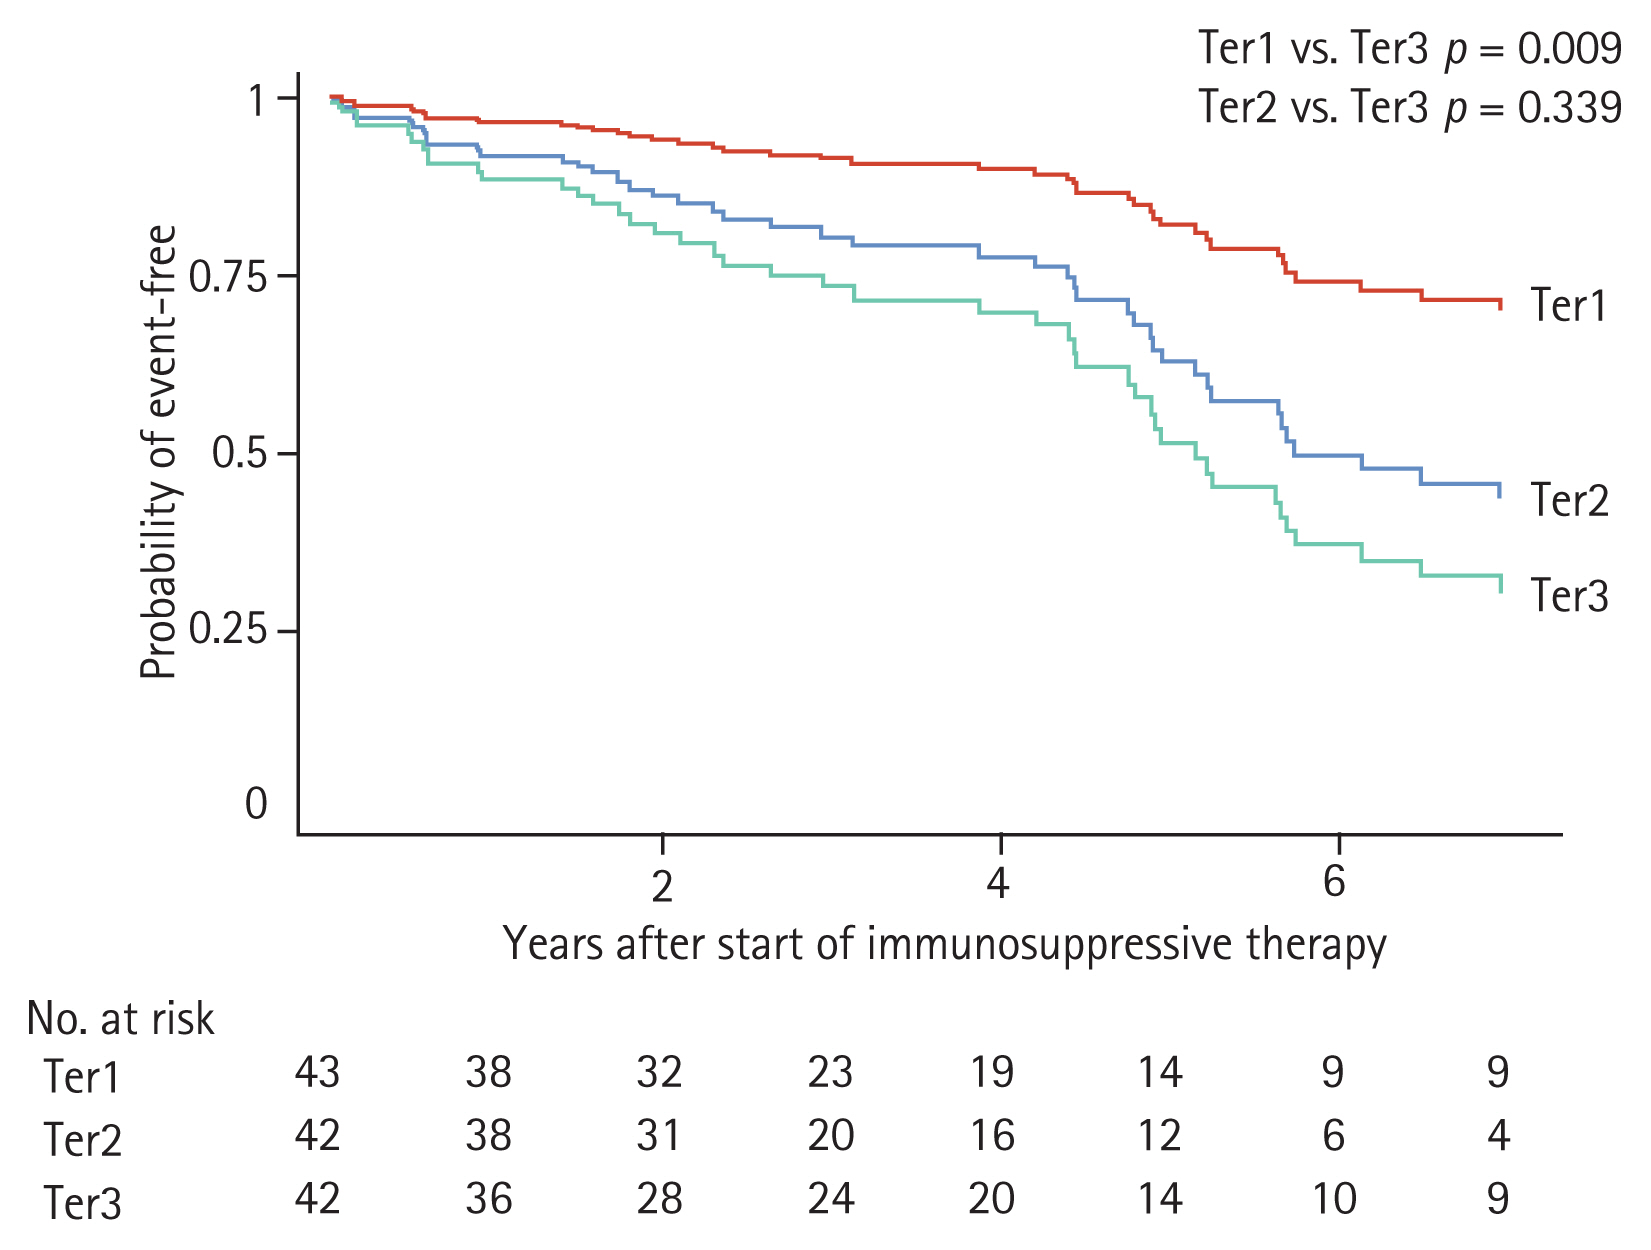
Adjusted survival curves of disease progression (disease progression was defined as the occurrence of a 30% or greater decline in estimated glomerular filtration rate [eGFR] or end-stage renal disease) for patients with immunoglobulin A nephropathy who underwent immunosuppressive therapy. Patients were categorized into tertiles according to the extent of time-averaged proteinuria reduction after immunosuppression. Adjustments were made for age at start of treatment, sex, time from biopsy to start of treatment, baseline eGFR, time-averaged proteinuria before the start of immunosuppressive therapy, time-averaged systolic blood pressure, serum albumin, presence of endocapillary hypercellularity and use of renin-angiotensin system blocker at start of immunosuppressive therapy. Ter1, first tertile; Ter2, second tertile; Ter3, third tertile.
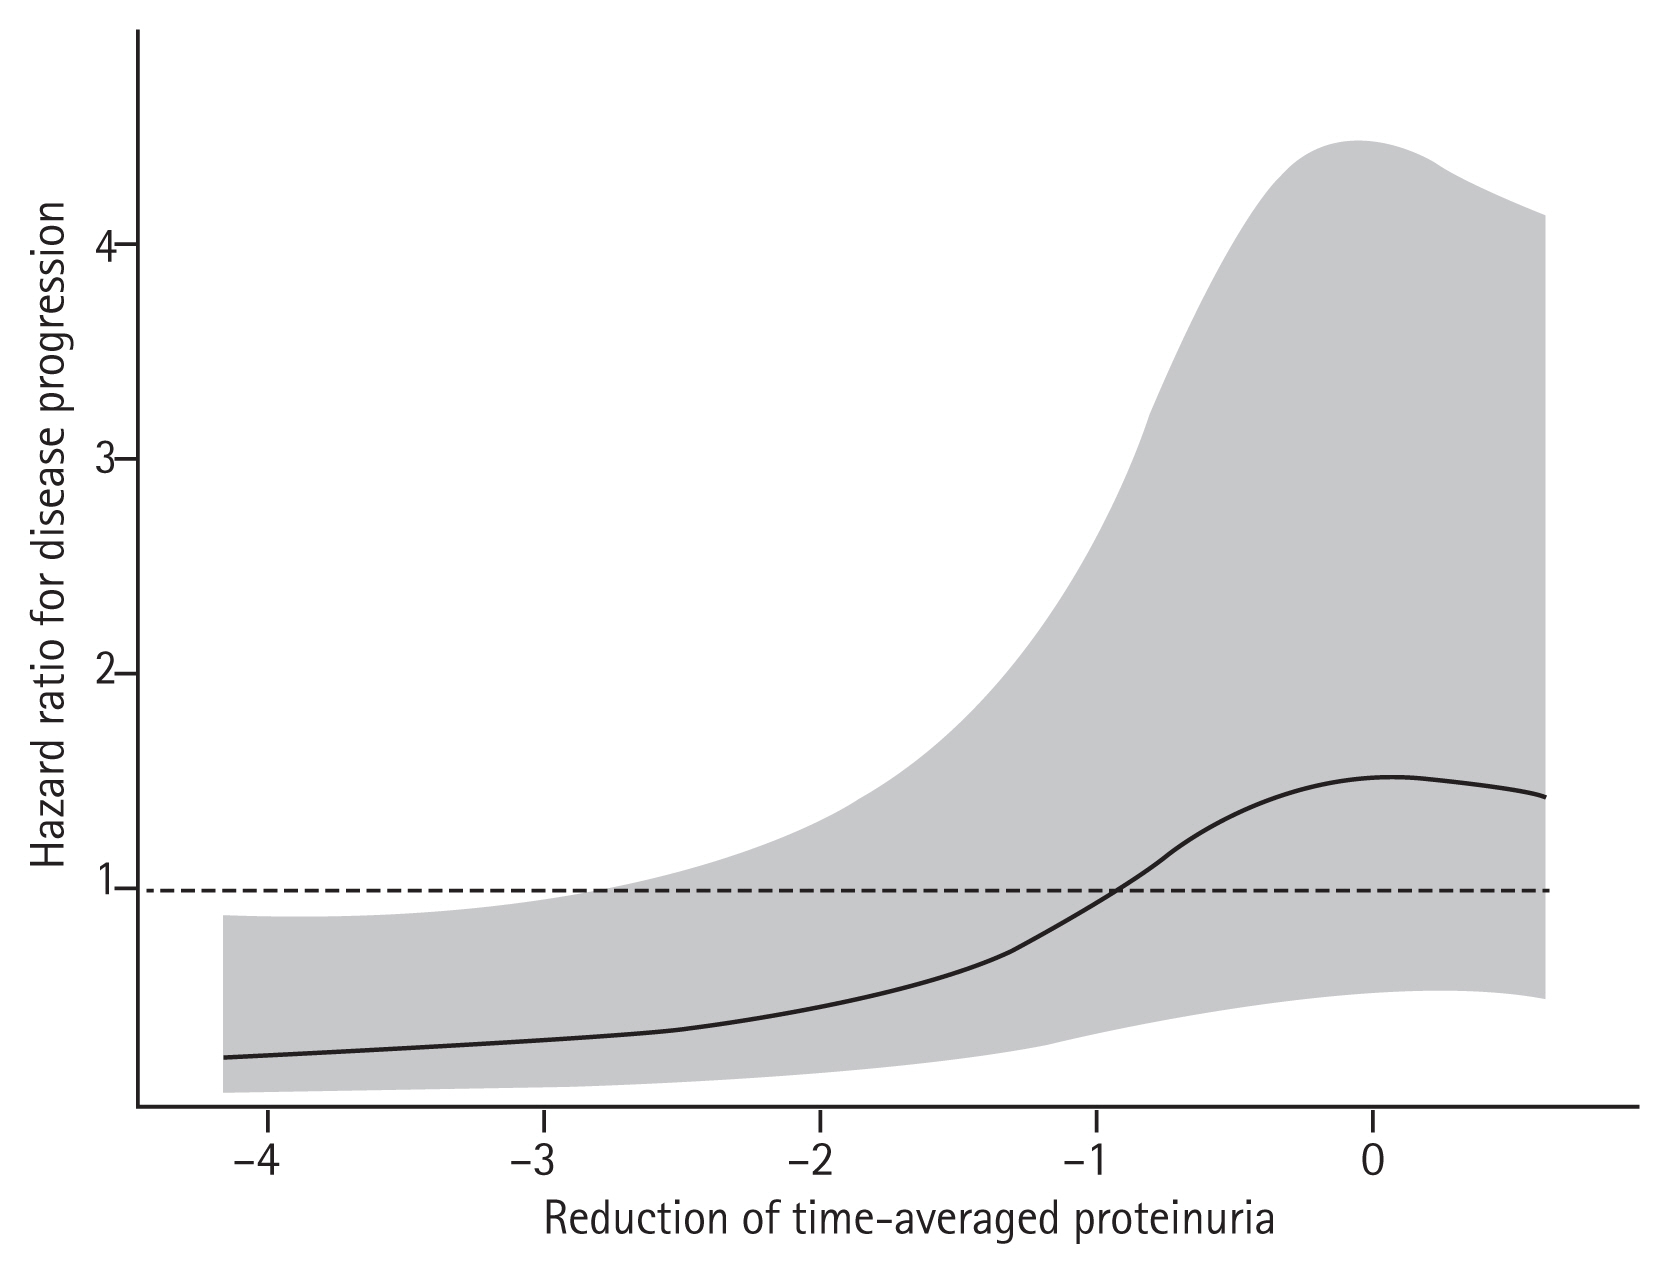
Restricted cubic spline curve for disease progression (disease progression was defined as the occurrence of a 30% or greater decline in estimated glomerular filtration rate [eGFR] or end-stage renal disease) according to the extent of time-averaged proteinuria reduction. The shaded area represents the 95% confidence interval. Adjustments were made for age at start of treatment, sex, time from biopsy to start of treatment, baseline eGFR, time-averaged proteinuria before the start of immunosuppressive therapy, time-averaged systolic blood pressure, serum albumin, presence of endocapillary hypercellularity and use of renin-angiotensin system blocker at start of immunosuppressive therapy.
Changes in proteinuria after completion of immunosuppression
Finally, we wondered if proteinuria levels may change after completion of immunosuppression. To investigate this, we first identified relapse of IgAN, defined as occurrence of proteinuria higher than 1 g/gCr on two or more consecutive tests within 2 years after completion of immunosuppression. There were 2 (4.65%), 1 (2.38%), and 5 (11.9%) relapses in Ter1, Ter2, and Ter3, respectively. There were fewer relapses in Ter1 than in Ter3. Additionally, we conducted extended follow-up assessment of changes in TAP after year 1 (Supplementary Fig. 2). In Ter1, TAP level decreased further at year 2 and then slightly increased thereafter. In contrast, there was a greater rebound increase in TAP in Ter2 from year 2, and Ter2 had a consistently high TAP level of > 1.0 g/gCr. This reverse pattern in TAP level between Ter1 and Ter2 was maintained during the remaining observation period. In Ter3, TAP level did not decrease and increased further in year 6.
DISCUSSION
In this study, we sought to evaluate long-term kidney outcomes according to the extent of proteinuria reduction after immunosuppressive therapy in patients with IgAN. First, we found that the rate of eGFR decline was significantly slower in patients with the greatest proteinuria reduction after immunosuppression. Second, when comparing eGFR by dividing the follow-up period into 1-year intervals, this slower eGFR decline in the group with greater proteinuria reduction persisted until 7 years after the start of immunosuppressive therapy. Last, the risk of disease progression was lower in patients with the greatest proteinuria reduction. These findings suggest that proteinuria reduction after immunosuppression can be a surrogate marker for responsiveness to immunosuppression and a useful predictor of long-term outcomes in patients with IgAN.
Proteinuria is a sign of kidney damage and a well-known indicator of severity and prognosis in various renal diseases [22–25]. In IgAN, proteinuria is the strongest prognostic factor for adverse kidney outcomes, and reducing proteinuria to less than 1.0 g/day has been suggested to delay disease progression [9,26,27]. Consistent with this, our findings highlight the importance of proteinuria reduction as a surrogate marker of responsiveness to immunosuppression. Several other indicators of steroid responsiveness have been proposed, but findings have been inconsistent. For example, an earlier study by the Working Group of the International IgA Nephropathy Network and the Renal Pathology Society showed that the presence of endocapillary hypercellularity implies a good response to corticosteroids [13]. However, endocapillary hypercellularity has not been validated as a discriminator for treatment response by other cohort studies [28–30]. Nevertheless, from a practical viewpoint, repeated kidney biopsy is not widely performed and it is difficult to determine a treatment response from biopsy findings. In contrast, measurement of proteinuria is non-invasive and easily performed in clinical practice. Thus, serial monitoring of changes in proteinuria can be implemented to evaluate responsiveness to immunosuppression. We further showed that the extent of proteinuria reduction correlated well with the slopes of eGFR decline and was a good predictor of future adverse kidney outcomes, suggesting that proteinuria reduction is a useful marker of disease progression. Based on our results, we strongly support the recent suggestion by Thompson et al. [31], that proteinuria reduction is a reasonable endpoint to evaluate the effect of treatment in future clinical interventional trials.
It should be noted that patients in Ter1 showed slower disease progression than those in Ter2 despite the lower achieved proteinuria level in Ter2. To determine why this might be the case, we performed an extended follow-up assessment of changes in proteinuria after the completion of immunosuppression. Interestingly, proteinuria was further decreased in Ter1 at year 2, whereas there was a rebound increase in proteinuria in Ter2 at year 2. During the remaining observation period, patients in Ter2 had a higher proteinuria level (> 1.0 g/gCr) than patients in Ter1. Not surprisingly, persistently elevated proteinuria > 1.0 g/day is a poor prognostic factor [16,32]. This finding can explain the higher risk of disease progression in the Ter2 group in our study, and underscores the importance of a sustained decrease in proteinuria in IgAN.
Another important finding to note is that patients with the greatest proteinuria reduction in response to immunosuppression had greater preservation of their eGFR at the start of immunosuppression and a shorter time from biopsy to commencement of immunosuppression. These findings have several important clinical implications. First, our results support the current guidelines suggesting that immunosuppression be considered in patients with preserved kidney function (eGFR ≥ 50 mL/min/1.73 m2) and be avoided in patients with advanced stages of CKD. Because fibrosis is considered an irreversible change and immunosuppression is not effective in patients with severe fibrosis, we excluded eight patients with eGFR < 30 mL/min/1.73 m2 and a T2 score from our analyses. Despite similar proportions of T1 scores and other pathologic lesions among tertile groups, we found that responsiveness to immunosuppression was greater in patients with a higher eGFR at baseline. Thus, treatment responses are likely to be better in patients with preserved kidney function. Second, based on our findings, early commencement of immunosuppression may be more effective in IgAN than late commencement. Few studies have examined the timing of initiation of immunosuppression. In general, IgAN is an indolent disease and rapid progression rarely occurs. Thus, it is particularly difficult to determine when to commence immunosuppression in patients with an eGFR of 60 mL/min/1.73 m2 and proteinuria of 1.0 g/day. Such patients would likely experience unfavorable outcomes if proteinuria reduction is not achieved given the preexisting evidence that risk of disease progression increases markedly in patients with proteinuria ≥ 1.0 g/day [16,18]. It is possible that glomerular inflammation and tubular injury may still be ongoing despite maximal supportive care such as the use of RAAS blockers and a low protein diet. Future trials should address whether early initiation of immunosuppression can improve kidney outcomes.
There have been attempts to use the Oxford-MESTC score for risk stratification in IgAN. However, no consensus has yet been reached regarding this issue. Only the T-score has been shown to consistently predict adverse kidney outcomes, and studies to date have yielded conflicting results on which pathologic components can convincingly predict disease progression [33]. As described above, we found no significant difference in Oxford-MESTC score among tertile groups according to the extent of proteinuria reduction. Studies on the relationship between the Oxford score and responsiveness to immunosuppression are scarce. The initial Working Group study showed a significant interaction between endocapillary hypercellularity and corticosteroid use, but this requires further validation [13]. Finding pathologic features that can correctly predict treatment response is very important, because utilization of such lesions can aid in decision-making with regards to the timing of initiation of immunosuppression. Unfortunately, no randomized controlled trials have been conducted to address this issue. In this regard, we are awaiting the results from the ongoing Treatment of IgA nEphropathy according to Renal lesions (TIGER) study, which is a prospective, open-labelled, randomized controlled study to evaluate the efficacy of early corticosteroid therapy combined with RAAS blockade (versus RAAS blockade alone) after 2 years of evolution in IgAN patients with severe histological lesions [34].
This study has several limitations. First, it was an observational study with a relatively small sample size. Thus, the influences of confounding factors could not be controlled for and causality between treatment and outcome could not be determined. Baseline characteristics did not differ much among tertile groups, but it is possible that other unmeasured factors might have affected proteinuria reduction. Second, the immunosuppression protocol was not uniform and there was no pre-set regimen, dosage, or duration of immunosuppression although all patients were initially treated with corticosteroids based on similar protocols suggested by the current KDIGO guidelines [9]. In addition, further immunosuppression with other drugs was allowed at the physician’s discretion. Future studies should use a well-designed immunosuppression protocol to robustly determine the relationship between the use of immunosuppression and proteinuria reduction. Third, our database did not include detailed information on adverse side effects of immunosuppression. We reviewed medical records and found five events of severe infection and seven events of new diabetes mellitus during the follow-up period. The incidence rate of severe infection in our study was lower than that reported in previous randomized controlled studies [10,11], possibly because we routinely administered prophylactic antibiotics to all patients during immunosuppressive treatment period. Nevertheless, fatal adverse effects of immunosuppression should not outweigh the effect of immunosuppression on delaying disease progression. Finally, our study was not designed to compare treatment effects between immunosuppression and supportive care. However, proteinuria reduction can be achieved spontaneously or with intensive supportive care. Further studies are needed to evaluate the relationship between proteinuria reduction and risk of long-term adverse kidney outcomes in IgAN patients.
In conclusion, we showed that greater proteinuria reduction after immunosuppression was associated with a lower risk of disease progression in IgAN, suggesting that proteinuria reduction after immunosuppression may be a surrogate marker for responsiveness to immunosuppression and a useful predictor of long-term kidney outcomes.
KEY MESSAGE
Greater proteinuria reduction after immunosuppressive therapy is associated with a lower risk of disease progression in immunoglobulin A nephropathy.
Proteinuria reduction after immunosuppressive therapy may be a surrogate marker for responsiveness to immunosuppression and predictor of long-term kidney outcomes.
Notes
Conflict of interest
No potential conflict of interest relevant to this article was reported.
Acknowledgments
This research was supported by the research fund of the Korea Centers for Disease Control and Prevention (2019ER690101).