The Korean Hypertension Cohort study: design and baseline characteristics
Article information

Abstract
Background/Aims
Hypertension (HT) has a significant impact on public health and medical expenses. However, HT is a chronic disease that requires the long-term follow-up of a large number of patients.
Methods
The Korean Hypertension Cohort (KHC) study aimed to develop a model for calculating cardiovascular risk in HT patients by linking and utilizing the detailed clinical and longitudinal data from hospitals and the national health insurance claim database, respectively. This cohort had a planned sample size of over 11,000 HT patients and 100,000 non-HT controls. Eligible patients were hypertensive patients, who were presenting for the first time and were diagnosed with HT as a main disease from 2006 to 2011. Long-term survival data over a period of approximately 9 years were obtained from the national health insurance claim and national health examination data.
Results
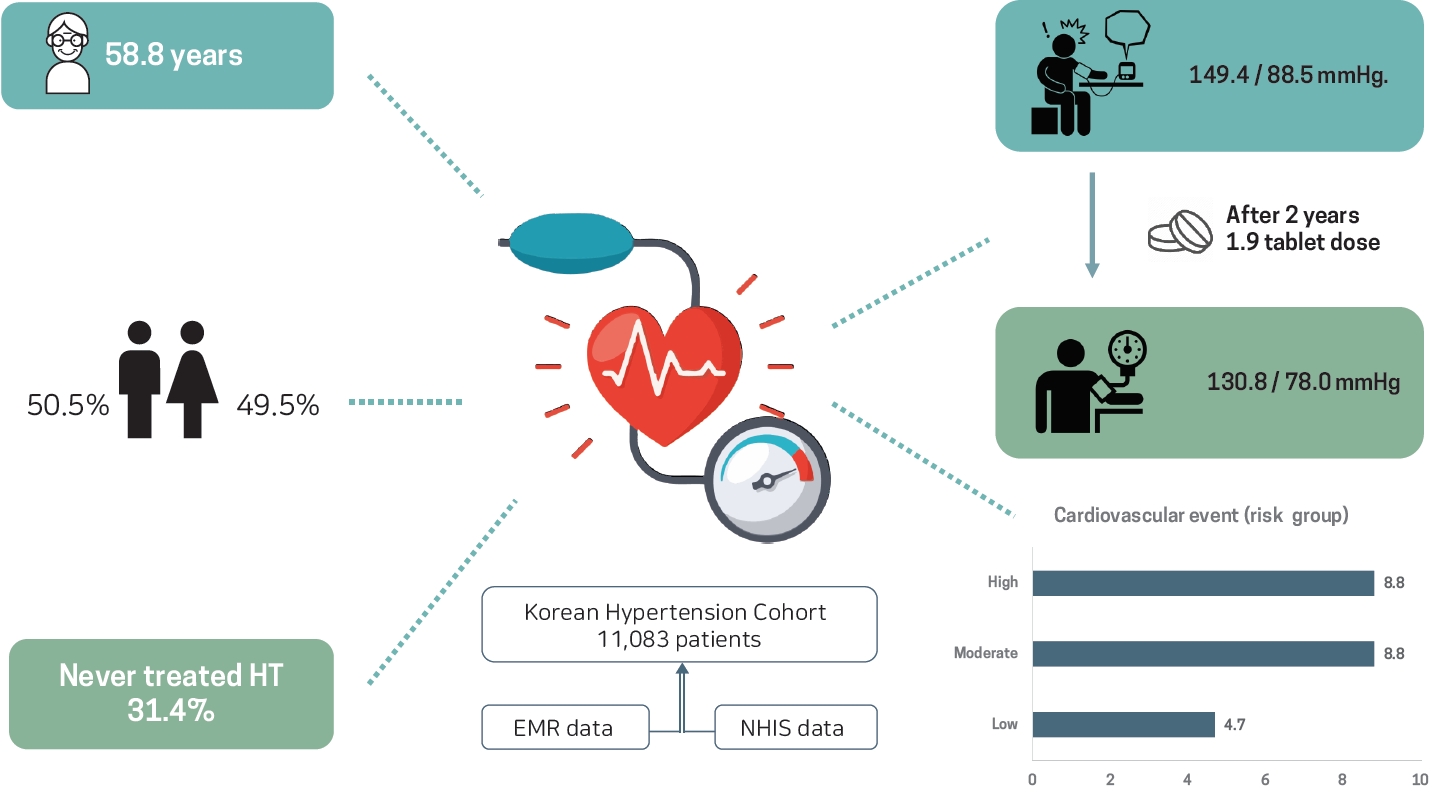
This cohort enrolled 11,083 patients with HT. The mean age was 58.87 ± 11.5 years, 50.5% were male, and 31.4% were never-treated HT. Of the enrolled patients, 32.9% and 37.7% belonged to the high and moderate cardiovascular risk groups, respectively. Initial blood pressures were 149.4 ± 18.5/88.5 ± 12.5 mmHg. During the 2 years hospital data follow-up period, blood pressures lowered to 130.8 ± 14.1/78.0 ± 9.7 mmHg with 1.9 ± 1.0 tablet doses of antihypertensive medication. Cardiovascular events occurred in 7.5% of the overall patients; 8.5%, 8.8%, and 4.7% in the high, moderate, and low risk patients, respectively.
Conclusions
The KHC study has provided important information on the long-term outcomes of HT patients according to the blood pressure, comorbid diseases, medication, and adherence, as well as health behaviors and health resource use.
INTRODUCTION
Hypertension (HT) is a major healthcare problem with a permanently elevated burden of cardiovascular morbidity/mortality worldwide [1]. HT is the risk factor that contributes the most to cardiovascular disease and the cardiovascular disease risk even begins to rise from the current HT threshold of ≥ 140/90 mmHg [2,3]. In a large-scale pooled cohort study of an Asian population, HT was an important risk factor for stroke and ischemic heart disease [4]. Notably, stroke prevention by blood pressure (BP) control was more effective in the Asian than the Caucasian population, since there was a greater reduction in the risk of stroke in the Asian population when compared to the Caucasian population upon lowering the systolic blood pressure (SBP) by 10 mmHg [5,6]. After the huge success of intensive BP control in the Systolic Blood Pressure Intervention Trial (SPRINT), HT guidelines emphasize strict BP control for maximal cardiovascular disease prevention [7,8]. However, the effect of intensive BP control in Asian patients has not been proven.
Although guidelines for HT management and control are based on evidence derived from large, randomized, controlled clinical trials, HT outcome studies are often limited due to the need for long-term follow-up and the large number of patients required to obtain meaningful results. Very few countries have the adequate healthcare resources needed to conduct these large-scale, long-term studies for common, chronic diseases such as HT and dyslipidemia. As a result, most countries have derived their cardiovascular risk estimation strategies from the Framingham study in the United States. However, the differences in ethnicity and health resources have become a considerable problem. Indeed, the Framingham risk scoring system and newer pooled cohort risk equations have been reported to overestimate the cardiovascular risk in the Asian population [9,10]. Regarding the differences in the medical resources, the development of new medications, which have enhanced risk factor control, resulted in overestimations when using the traditional cardiovascular risk prediction model based on historical data in this population [11]. Therefore, it is necessary to develop a risk calculation model based on the epidemiological data, which will reflect the effectiveness of strategies for preventing cardiovascular diseases, as well as the general medical environment, for the population and not limited environments such as those in health examinations.
Therefore, we designed the Korean Hypertension Cohort (KHC) study to integrate the detailed clinical and long-term follow-up data from six national university hospitals and the National Health Insurance System (NHIS), respectively. Here, we reported on the design and baseline characteristics of the cohort. The primary objective of this study was to evaluate the long-term impact of intensive BP control that maintained an SBP/diastolic blood pressure (DBP) < 135/85 mmHg and compared the findings with the modest control group (SBP, 140 to 149 mmHg). We compared the incidences of cardiovascular events, diabetes mellitus, chronic kidney disease, and death according to the SBP/DBP ranges. We also evaluated various topics that offered evidence for future BP guidelines. The ancillary sub-studies included assessments of the diagnostic implication of left ventricular hypertrophy diagnosed on electrocardiogram (ECG) and echocardiography, vascular stiffness assay and ambulatory BP monitoring. The impact of antihypertensive medications including various antihypertensive drug classes, initial combination therapy strategy, and single-pill combinations was evaluated.
METHODS
Design of the KHC
The KHC integrated the detailed clinical and the long-term follow-up data from six national university hospitals and the NHIS claims database, respectively. We collected the data of hypertensive patients who were new to each hospital and were mainly diagnosed with HT between 2006 and 2011 (median registration year 2009). The model for the KHC is summarized in Fig. 1.

The model of the Korean Hypertension Cohort. EMR, electronic medical records; NHIS, National Health Insurance Service; ECG, electrocardiogram; ABPM, ambulatory blood pressure monitoring.
Patient enrollment
The eligibility criteria for this study were as follows. (1) Regular follow-up at least four times in a minimum of 2 years and treatment with antihypertensive medications. (2) Cardiovascular risk that was estimated by checking laboratory values, presence/absence of clinical cardiovascular disease, and/or subclinical organ damage.
A large portion of patients enrolled in this time period may currently be unavailable for follow-up as they were either moved to other hospitals or died. If we only included the patients who gave their consent in this study, this would have caused bias. The KHC was mainly an observational study, which had minimal risk of breeches in patient privacy. In addition, this study complied with the exception provision of Article 6, Paragraph 2 of the Cardiovascular Disease Prevention Management Act and the National Evidence-based Healthcare Collaborating Agency (NECA) Research Regulations. As a result, the study protocols were reviewed and approved by the Institutional Review Boards of each participating hospital including the coordinating center (Seoul National University Hospital, H-1810-056-977), and the need to obtain informed consent from the patients was waived prior to any patient enrollment.
Exclusion criteria included an age younger than 30 years old, severe kidney diseases/end stage renal disorders at the time of the first visit, treatment with antihypertensive medication for cardiovascular diseases other than HT as a main diagnosis (e.g., using beta-blockers after myocardial infarction, or alpha blockers for prostatic hyperplasia, etc.) and secondary HT.
The enrollment algorithm is shown in Fig. 2. The detailed clinical data were collected from the electronic medical records of each hospital. In particular, we collected the detailed clinical data on HT, including the repeated BP and heart rate measurements; demographic, clinical, and biochemical data; ECG and other special laboratory data such as echocardiography; ambulatory BP monitoring or vascular stiffness assays. The data acquisition schedule for the repeated measurement values is summarized in Table 1. In particular, BP and heart rate measurement data were collected > 5 times during the 2-year follow-up period. In addition, biochemical data were collected at baseline and during the follow-up period.

The algorithm for the Korean Hypertension Cohort. NHIS, National Health Insurance Service.

Data acquisition schedule for the repeated measurement values
Moreover, a non-hypertensive control population with a 1:10 ratio (100,000) from the NHIS sample cohort was determined with propensity score matching. The matched variables were sex, birth year, and month (quarter in months). HT was excluded by filtering the main and additional disease codes. Among the NHIS sample cohort, the control population was selected according to the patients who underwent the national health examination more than twice in order to sufficiently compare cardiovascular risk factors.
Patients’ follow-up schedule
The data of the patients who were enrolled from each hospital were linked with the NHIS data bridged by unique personal identifiers (social security number). The NHIS data comprised the claim and national health screening data, and the linkage process was endorsed by the Health and Medical Technology Promotion Act 26. To maintain privacy, patients’ identification data were imported to the NECA as an encrypted file. The storage and analysis of the collected data were conducted in security archives with limited access. Since the patient data of each medical institution were linked to the secondary data source under the security of NHIS officials in accordance with the submitted linking conditions, the researchers could not identify each patient after the linkage was completed. The entire analysis process of the linked data sources was conducted in the NHIS data analysis office. External exportation of the data and additional extraction of personal information were not permitted.
Definition of cardiovascular diseases and risk factors confirmed through medical record reviews
HT was defined as an SBP/DBP ≥ 140/90 mmHg without antihypertensive treatment or an SBP/DBP ≥ 130/80 mmHg with antihypertensive treatment. Clinical cardiovascular diseases, subclinical organ damage and cardiovascular risk factors were defined according to the 2018 Korean Society of Hypertension Guidelines for the Management of Hypertension [12]. The definitions are summarized in Supplementary Table 1. The high cardiovascular risk group was defined as patients who had clinical cardiovascular disease, chronic kidney disease, and/or diabetes mellitus. The moderate cardiovascular risk group was defined as patients who had increased vascular stiffness, left ventricular hypertrophy, and/or metabolic syndrome excluding diabetes mellitus. Increased vascular stiffness was defined as the presence of atherosclerotic plaques, an increased pulse wave velocity, or decreased ankle-brachial index. The low cardiovascular risk group was defined as patients who did not belong to either the high or moderate risk groups. For the NHIS claim data analysis, operational definitions of cardiovascular diseases are summarized in Supplementary Table 2.
Sample size calculation
The sample size was calculated based on the SPRINT to determine the role of intensive BP lowering compared to conventional BP control although the target BP goals were modified from those in the SPRINT [13]. Considering that the lowest mortality rate may be observed in patients with an SBP and DBP below 135/85 mmHg, five intervention groups were defined according to the BP ranges (SBP and DBP): < 135/85, < 135/80, < 120/85, < 120/80, < 115/80, or < 115/75 mmHg. In comparison, the conventional group was mainly defined as those with an SBP of 140 to 149 mmHg. We also compared the long-term cardiovascular outcomes according to an SBP and DBP above 150 and 90 mmHg, respectively. The SPRINT reported a significantly lower rate of the primary composite outcome with a hazard ratio of 0.75 (1.65% per year vs. 2.19% per year). Another reference was Heart Outcomes Prevention Evaluation-3 (HOPE-3) trial, which enrolled intermediate risk patients but maintained a longer follow-up duration of 5.6 years (median) [14]. Although the primary endpoint was not statistically significant, the trial showed a significant risk reduction of approximately 30% in hypertensive subgroups with a baseline SBP over 143.5 mmHg.
We assumed the proportions of cardiovascular risks for the eligible patients were 50%, 30%, and 20% in the high, moderate, and low risk groups, because the six national university hospitals were the referral hospitals for each region. The 10-year cardiovascular risks were estimated as 15%, 10%, and 5%, respectively [12], which corresponded to the rates of 15% to 20%, 5% to 15%, and < 5%, respectively, in the European guideline [15]. We expected about 1,700 cardiovascular events including 840 cardiovascular deaths during the 10-year follow-up period. We assumed a 40% risk reduction in patients with an SBP and DBP below 135/85 mmHg compared with the modest controlled group in whom the SBP ranged from 140 to 149 mmHg.
The KHC study had a planned sample size of approximately 11,000 hypertensive patients from six hospitals. There results of a total of 10,000 patients in the cohort were confirmed with an 85% statistical power, 5% alpha error, at least 15% 10-year incident rate, hazard ratio of 0.65, standard deviation of 0.2 for the main explanatory variable, and minimum correlation coefficient between the main explanatory variable and other disturbances (R2) of 0.25 [16,17].
Statistical analysis
For the cardiovascular outcome evaluation, we used the log rank test for univariate analysis between the groups and a Cox proportional risk model for comparison between the groups that only corrected for the age variables, the most important determinant of event occurrence. Hazard ratios and their corresponding 95% confidence intervals calculated from Cox proportional hazard analyses for the risk of the primary outcome in the intervention group compared to the comparison group were presented. A Kaplan-Meier survival curve was used for the survival curve analysis of the comparison group versus the intervention group. If the change over time was a variable that could be evaluated, the analysis was performed using the generalized estimating equation or mixed modeling for repeated measures. Hazard ratio calculations for the risk of occurrence in the intervention group compared to the comparison group were performed by considering other models, such as the Poisson model, in case there were violations of the proportional risk assumption.
We performed a cluster analysis to determine the patients’ responsiveness based on their phenotypic characteristics [18]. After this cluster analysis, phenomapping was performed to evaluate the individual responsiveness of the HT.
RESULTS
Baseline characteristics of the cohort
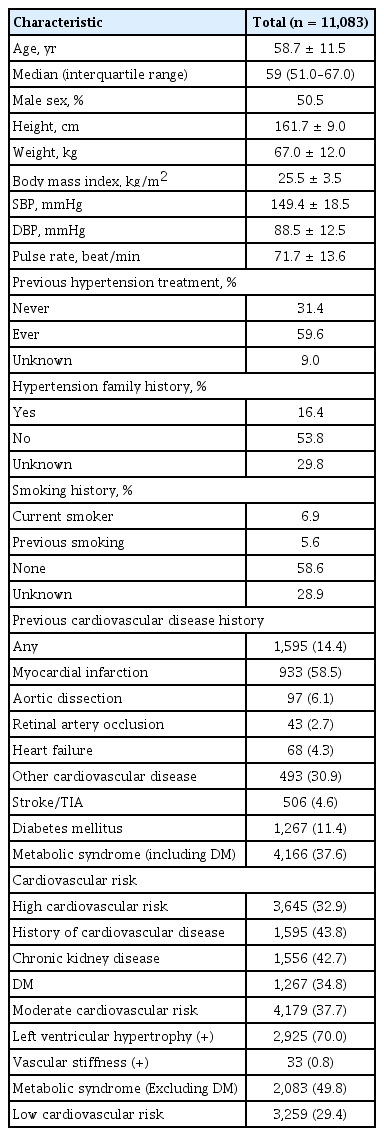
This study enrolled a cohort of 11,083 patients with HT. The mean age was 58.7 ± 11.5 years, 50.5% of the patients were male, and 31.4% were never previously treated for HT. A total of 36.2% and 39.1% of the patients belonged to the high and moderate cardiovascular risk groups, respectively. The initial BP was 149.4 ± 18.5/88.5 ± 12.5 mmHg. The full baseline characteristics of the patient cohort are presented in Tables 2 and 3.
Baseline demographic and clinical characteristics

Baseline laboratory findings
Two-year follow-up of the hospital data
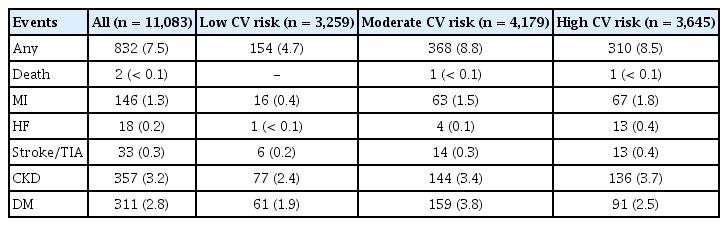
During the 2 years of the hospital data follow-up, BPs lowered to 130.8 ± 14.1/78.0 ± 9.7 mmHg with 1.9 ± 1.0 tablet doses of the antihypertensive medication (Table 4). Cardiovascular events occurred in 7.5% of the patients, 8.5%, 8.8%, and 4.7% in the high, moderate, and low risk patients, respectively (Table 5).

Prescribed medication at the end of the 2 years hospital follow-up period
Cardiovascular events during the 2 years hospital follow-up period
DISCUSSION
Real world evidence, especially that utilizing big public health data, has potential benefits, such as allowing for long-term follow-up of a large number of patients [19,20]. Korea has a single, government maintained NHIS [21,22]. The universal NHIS provides free biennial health examinations to eligible NHIS members aged ≥ 40 years. The data consists of the qualification data, and medical services and pharmacy claims data [23]. The Korean NHIS is capable of big data analysis because it is a unified insurance system that covers > 90% of the Korean population. Therefore, nearly the entire population’s medical resource use can be checked using the claim data. Moreover, Korean doctors have relatively discretionary authority in terms of medical decisions and treatment. Therefore, the NHIS data allows for the comparison of the effect of various diagnostic modalities and treatment strategies. In most cases, one of the advantages of the NHIS claims data is the ability to perform long-term follow-up of a large number of patients over their lifetime. However, in the health claims database there is a lack of detailed clinical data, especially BP values, which may include critical issues in chronic disease results that require repetitive measurement of the clinical factors. Even though the NHIS-Health Screening Cohort is based on information obtained through national health screening programs that are repeated every 2 years, clinical data acquisition remains limited.
Contrastingly, hospital data based on the electronic medical records have detailed information that allows for deep phenotyping [24]. In addition to the patients’ basic clinical characteristics, the hospital data offers repetitive values of key parameters such as the BP, heart rate, blood chemistry over time, and special laboratory data including ECGs, echocardiography, ambulatory BP monitoring, and arterial stiffness measurements. However, the hospital data are limited to each hospital. Therefore, if patients are treated at multiple hospitals, the overall effects and consequences of the medical use across hospitals cannot be evaluated. Furthermore, generally, a large proportion of patients are lost to follow-up as they do not return to the facility or they move to other medical caregivers [25].
The disadvantages of big healthcare and hospital data should be addressed and could be minimized by connecting two data sets. This strategy is especially important for common, chronic diseases such as HT and dyslipidemia. The biggest risk factors for cardiovascular disease are HT, hyperglycemia (diabetes mellitus), and hyperlipidemia. It is common knowledge that these risk factors are of great value in the prediction of actual clinical events when analyzing multiple factors concurrently rather than each factor separately. This limits the study of big healthcare data based on disease claim codes, which a limited in terms of the time sequences and severity of each disease. In particular, repeated measurements of indicators such as BP values and blood test results are more valuable than a single measurement [26]. Cardiovascular disease research also requires long-term observations. The estimated cardiovascular event rate in moderate or even high risk hypertensive patients is only about 1% to 2% per year [12]. This means that long-term follow-up for at least 5 to 10 years is necessary to establish meaningful results. Traditionally, several cohort studies were carried out for the analysis of chronic diseases, such as HT, dyslipidemia, and diabetes mellitus, which demanded a significant amount of national medical expenses. However, even in the case of excellent cohort studies, it is not easy to maintain a long-term follow-up rate of more than 85%. Long-term follow-up is more difficult in an environment like Korea, where patients can move between various hospitals. The likelihood of event occurrence is higher in patients who dropout after follow-up than those who do not; thus, maximizing follow-up is an important factor in correct risk prediction.
The limitations of the study are as follows. First, the KHC is not a clinical trial but a patient cohort that linked patients’ hospital and NHIS data from 2006 to 2011 and 2003 to 2018, respectively. Therefore, patient assessments, management, and follow-up regimens were not standardized and they varied between the institutions. Importantly, the BP measurement methods were not standardized to a single method but followed the values from each hospital. Second, we only registered the patients in six national university hospitals for hospital and NHIS data linking without violating the Personal Information Protection Act. Moreover, moderate to high risk hypertensive patients were targeted for enrollment to ensure that the study was able to meet the stipulated sample size. Therefore, this KHC was not selected based on statistical measures according to population dynamics and may not represent the general population of hypertensive patients in Korea.
The KHC study was endorsed by the Korean Society of Hypertension (KSH). We plan to make this database available under the auspices of the KSH, NECA, and NHIS. Therefore, we hope to perform many ancillary studies in future using this cohort.
In conclusion, the KHC study is a large scaled, multicenter study in Korea that will provide important real world data on the long-term outcomes of hypertensive patients according to the BP, comorbid diseases, medication, and adherence, as well as the health behaviors and health resource use. By the end of 2020, we will complete the follow-up by linking the patients’ data in each hospital with the NHIS data and start the main analysis. Finally, we hope to establish a cardiovascular risk score for Korean hypertensive patients that may be applicable to other Asian ethnic populations.
KEY MESSAGE
The Korean Hypertension Cohort (KHC) study aimed to develop a model for calculating cardiovascular risk in hypertension (HT) patients by linking and utilizing information between the detailed clinical and longitudinal data from hospitals and the national health insurance claim database, respectively.
This cohort had a planned sample size of over 11,000 HT patients and 100,000 non-hypertensive controls. This cohort enrolled 11,083 HT patients.
Initial blood pressures were 149.4 ± 18.5/88.5 ± 12.5 mmHg. During the 2 years hospital data follow-up period, blood pressures lowered to 130.8 ± 14.1/78.0 ± 9.7 mmHg with 1.9 ± 1.0 tablet doses of antihypertensive medication. Cardiovascular events occurred in 7.5% of the patients, 8.5%, 8.8%, and 4.7% in the high, moderate, and low risk patients, respectively.
The KHC study provided important information on the long-term outcomes of HT patients according to the blood pressure, comorbid diseases, medication, and adherence, as well as health behaviors and health resource use.
Notes
Conflict of interest
No potential conflict of interest relevant to this article was reported.
Acknowledgments
This research was supported by the National Evidence-based Healthcare Collaborating Agency (NECA), funded by the Ministry of Health and Welfare (grant number NA20-001).