Clinical impact of long-term change in air trapping on pulmonary function and computed tomography parameters in chronic obstructive pulmonary disease
Article information
Abstract
Background/Aims
Air trapping is associated with unfavorable outcomes in chronic obstructive pulmonary disease (COPD). The present study evaluated the association between longitudinal changes in air trapping with pulmonary function, computed tomography (CT) parameters and exacerbation.
Methods
Patients enrolled in the Korean Obstructive Lung Disease (KOLD) study cohort from June 2005 to October 2015 were included. The study patients were categorized into four groups according to the change in residual volume to total lung capacity ratio (RV/TLC) over 3 years. The RV/TLC was considered abnormal when it was ≥ 40% and normal when it was < 40%.
Results
A total of 279 patients were categorized into four groups: 76 in the “normal to normal” (N→N) group, 34 in the “abnormal to normal” (A→N) group, 33 in the “normal to abnormal” (N→A) group, and 136 in the “abnormal to abnormal” (A→A) group. For forced expiratory volume in 1 second and forced vital capacity (FVC), respectively, group A→N showed a large increase of 266 mL (p < 0.001) and 381 mL (p < 0.001), group N→A showed a marked decrease of 216 mL (p < 0.001) and 332 mL(p = 0.029), and group A→A showed a decrease of 16 mL (p = 0.426) and 6 mL (p = 0.011) compared to group N→N. Group A→N showed a significant decrease of −0.013 in expiratory to inspiratory ratio of the mean lung density (p < 0.001), while group A→N showed an increase of 0.005 (p < 0.001).
Conclusions
Patients with COPD whose RV/TLC changed from normal to abnormal showed deterioration of pulmonary function and worsening of CT parameters simultaneously.
INTRODUCTION
Lung hyperinflation is associated with disease severity and airway remodeling in chronic obstructive pulmonary disease (COPD) [1,2], and occurs due to air trapping, decreased elasticity of the lung parenchyma, and airway resistance [3]. Air trapping, manifested as an increase in residual volume to total lung capacity ratio (RV/TLC), contributes to lung hyperinflation [4]. Increased RV/TLC, an increase in RV without a proportional increase in TLC, results in reduced forced expiratory volume in 1 second (FEV1) [5,6], and is a risk factor for mortality in patients with COPD [7,8], and an association with frequent exacerbations of COPD has also been reported [9].
Air trapping can also be assessed quantitatively using inspiratory/expiratory computed tomography (CT) [10,11]. The air trapping index (ATI) determined from CT is significantly correlated with clinical parameters, such as FEV1, FEV1/forced vital capacity (FVC), diffusing capacity of the lungs for carbon monoxide (DLCO), and the 6-minute walk test (6MWT) [12–14]. Furthermore, RV/TLC and the ATI from a volumetric CT scan are interrelated. RV/TLC is significantly correlated with the emphysema index (EI) and the ATI based on quantitative CT [12]. The expiratory to inspiratory ratio of the mean lung density (E/I MLD) is significantly correlated with RV/TLC [15].
Air trapping, which has been demonstrated using various clinical parameters in several studies, is clinically significant with respect to the prognosis and can be potentially used to phenotype patients with COPD for a more individualized treatment. However, RV/TLC changes over time, and its influence on the prognosis of patients with COPD varies over the disease course. To our knowledge, no study has evaluated the clinical impact of a longitudinal change in air trapping on the prognosis of patients with COPD.
We hypothesized that patients with COPD whose RV/TLC increased over time would also show unfavorable changes in both pulmonary function and CT parameters compared to patients with COPD who did not show any change or improvement in RV/TLC. Our study evaluated the association between changes in air trapping according to clinical characteristics and the outcomes of patients with COPD after stratification according to the pattern of change in RV/TLC over 3 years.
METHODS
Patient selection
Patients with COPD from the Korean Obstructive Lung Disease study cohort were enrolled from the pulmonary clinics of 16 hospitals in South Korea, from June 2005 to April 2018. Patients with a smoking history of more than 10 pack-years were spirometrically diagnosed with COPD, as were those with a postbronchodilator FEV1/FVC ratio < 0.7. Patients with baseline and 3-year follow-up RV and TLC were included in this study. Pulmonary function tests (PFTs) and CT scans were performed on the same day. Written informed consent was obtained from each patient prior to the evaluation. The names of the ethics committees are listed in the online supplement.
Ethical statement
The Institutional Review Boards of the participating hospitals approved the use of the clinical and imaging data. The Ethics Committees were as follows: Asan Medical Center, Bundang CHA Hospital, Ewha Womans University Mokdong Hospital, Korea University Anam Hospital, Hanyang University Guri Hospital, Inje University Ilsan Paik Hospital, Kangbuk Samsung Hospital, Hallym University Kangnam Sacred Heart Hospital, Kangwon National University Hospital, Seoul National University Hospital, Seoul National University Bundang Hospital, Ajou University Hospital, Konkuk University Hospital, Yeouido St. Mary’s Hospital, Seoul St. Mary’s Hospital (KC11OIME0668), and the National Medical Center.
Computed tomography
All patients underwent volumetric CT scans at full inspiration and expiration. The scan parameters included 100 effective mAs, 0.75-mm collimation, and 140 kVp with a pitch of 1.0. The CT scans were done craniocaudally with the patient in the supine position.
Computed tomography parameters
The CT attenuation ranged from −1,024 to 3,072 HU, and all CT scans were non-enhanced. The images were reconstructed from the thoracic inlet to the lung base using the soft kernel (B30f, Siemens Medical Systems, Malverm, PA, USA). Using in-house software, whole-lung images were extracted automatically and the pixel attenuation coefficient was measured.
The MLD and volume fraction of the lung were calculated automatically using software. The ATI was defined as the E/I MLD. Airway dimensions were measured at the site near the origin of four segmental bronchi (RB1, LB1 + 2, LB10, and RB10).
The airway was measured more accurately using a modified sharpening filter with a 3 × 3 × 3 kernel size. The percentage of bronchial wall area (WA) was defined as WA/(WA + lumen area) × 100, and was obtained in each segmental bronchus. The mean values of airway dimensions were used in the statistical analysis. Validation was done using polyacryl tubes. The software automatically discriminated the inner and outer boundaries of the airway wall and the airway lumen by the full-width-maximum method [16,17].
Clinical parameters
Data including the COPD Assessment Test (CAT) score, St. George’s Respiratory Questionnaire (SGRQ) score, body mass index (BMI), age, and sex of the patients were assessed at baseline and follow-up. The total number of COPD exacerbations during the observation period was evaluated. FEV1, FVC, FEV1/FVC ratio, RV, and TLC were evaluated at the baseline and follow-up PFTs. DLCO and exercise capacity on the 6MWT were also evaluated.
Phenotypes
The study patients were grouped into four phenotypes according to the pattern of change in RV/TLC over 3 years. The RV/TLC was considered abnormal when it was ≥ 40% and normal when < 40% [9]. When the RV/TLC was < 40% at baseline and remained < 40% after 3 years, it was classified as “normal to normal” (N→N), but if it increased to ≥ 40% after 3 years it was classified as “normal to abnormal” (N→A). When the baseline RV/TLC was ≥ 40% and remained at ≥ 40% after 3 years, it was classified as “abnormal to abnormal” (A→A), but when it changed to < 40%, it was classified as “abnormal to normal” (A→N).
Statistical analysis
All statistical analyses were performed using the IBM SPSS version 20.0 (IBM Corp., Armonk, NY, USA). Continuous data are presented as mean with range. The chi-square test was used to analyze categorical parameters. Continuous variables were analyzed using one-way analysis of variance or the Kruskal-Wallis test, depending on the normality of the data distribution. A negative binomial regression analysis was used to evaluate the association between moderate to severe exacerbation frequency of COPD and other clinical parameters. Factors significant in the univariate analysis were entered into a multivariable analysis. Overall survival (OS) was the time between enrollment and observation, which took place on April 26, 2018. The log-rank test was used to compare OS between the COPD phenotypes. A p < 0.05 was considered significant; however, for multiple comparisons, alpha level adjustment was performed.
RESULTS
Patient clinical characteristics
Among the 675 patients with COPD enrolled in this study, 52 without baseline RV/TLC data and an additional 344 without follow-up RV/TLC data for year 3 were excluded (Supplementary Fig. 1). A total of 279 patients were evaluated. The baseline RV/TLC showed a significant negative linear correlation with the baseline FEV1 (%; r = −0.649, p < 0.001), FVC (%; r = −0.451, p < 0.001), FEV1/FVC ratio (r = −0.351, p < 0.001), DLCO (absolute value; r = −0.242, p < 0.001), and BMI (r = −0.133, p = 0.028) (Fig. 1). On the other hand, the baseline RV/TLC showed a positive linear correlation with the baseline total SGRQ score (r = 0.457, p < 0.001), total CAT score (r = 0.324, p = 0.003), E/I MLD (r = 0.354, p < 0.001), and mean bronchial WA (%; r = 0.236, p < 0.001) (Fig. 1). According to the pattern of change in the RV/TLC, patients were categorized into four groups: 76 in “N→N,” 34 in “A→N,” 33 in “N→A,” and 136 in “A→A.” Table 1 shows the clinical characteristics of the four groups. The annual rate of RV/TLC (%) decline varied among the study patients (−0.18 ± 3.36%/yr, mean ± standard deviation) (Supplementary Fig. 2). The mean age was highest in the A→A group (67.5 years, p < 0.001). No significant group differences were seen in sex or the proportion of ever-smokers. Prevalence of comorbidities were also compared between the groups: statistically significant difference was observed only in pulmonary tuberculosis (p = 0.041). In terms of inhaler medications during the observation period, statistically significant difference was observed in uses of long-acting beta-agonist (LABA), long-acting muscarinic antagonist (LAMA), inhaled corticosteroid (ICS)/LABA, and LABA/LAMA (p = 0.009, p = 0.044, p = 0.002, and p = 0.002, respectively). Comparisons in moderate to severe exacerbation frequency in follow-up years after the observation time showed no significant difference between the groups. Three-year changes in the FEV1, FVC, and FEV1/FVC differed significantly among the four groups. For FEV1 and FVC, respectively, group A→N showed a large increase of 266 mL (p < 0.001) and 381 mL (p < 0.001), group N→A showed a marked decrease of 216 mL (p < 0.001) and 332 mL (p = 0.029), and group A→A showed a decrease of 16 mL (p = 0.426) and 6 mL (p = 0.011) compared to group N→N. No significant difference between the subgroups was shown in the change in DLCO.
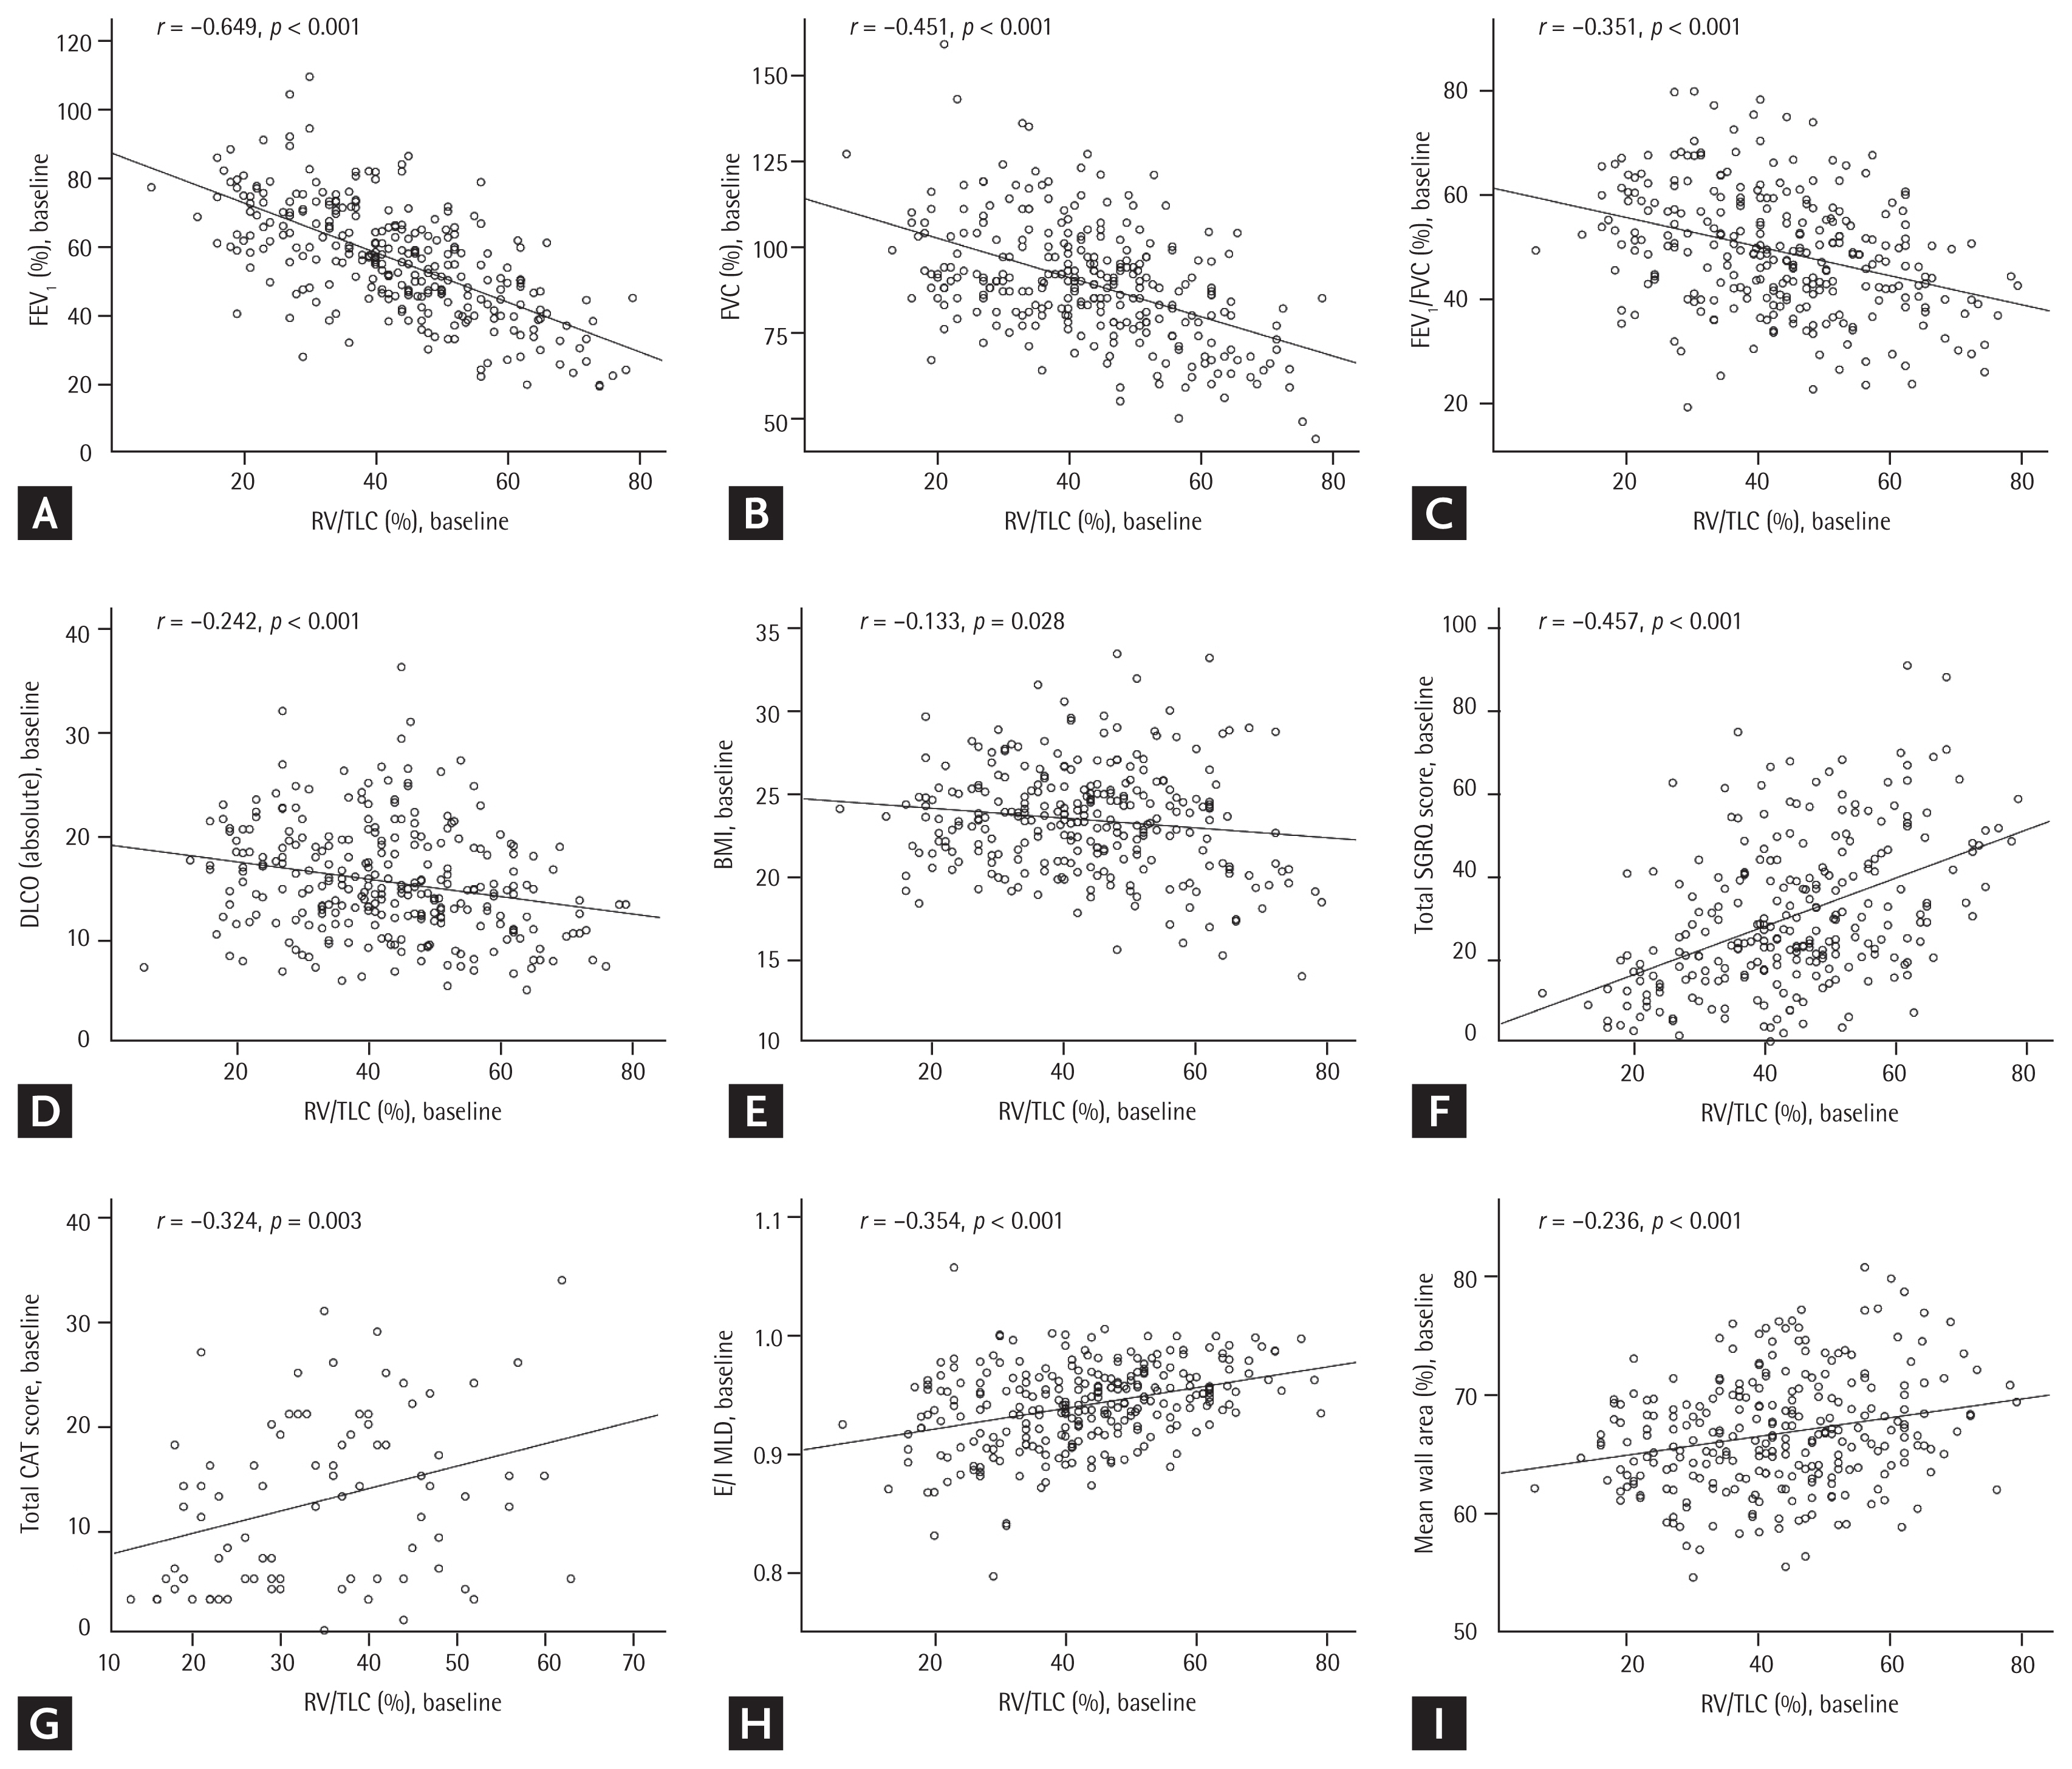
Correlation between the baseline residual volume to total lung capacity ratio (RV/TLC) and baseline (A) forced expiratory volume in 1 second (FEV1; %), (B) forced vital capacity (FVC; %), (C) FEV1/FVC, (D) diffusing capacity of the lungs for carbon monoxide (DLCO; absolute value), (E) body mass index (BMI), (F) total St. George’s Respiratory Questionnaire (SGRQ) score, (G) total COPD Assessment Test (CAT) score, (H) expiratory to inspiratory ratio of the mean lung density (E/I MLD), and (I) mean wall area (%).

Clinical characteristics of the different groups of patients with COPD stratified by the 3-year change in residual volume to total lung capacity ratio
Group A→N showed a significant within-group increase in FEV1, while group N→A showed a significant decrease in both % predicted and the absolute values. The absolute value of FVC changed significantly in all groups except A→A. While groups N→N and N→A showed significant decreases in the absolute value of FVC, group A→N showed a significant increase. Groups N→A and A→N showed significant changes in FEV1/FVC (%): group A→N showed an increase of 2.8%, while group N→A showed a decrease of −2.3% (Table 1).
All subgroups showed significant within-group decreases in the absolute value of DLCO, while only groups N→N and A→A showed significant decreases in % predicted DLCO. A significant change was detected in the BMI only in group A→A. The mean BMI decreased significantly, by −0.33, in group A→A.
Changes in volumetric computed tomography parameters
Table 2 shows the baseline, follow-up, and delta (difference between year 3 and baseline) values of the four groups stratified by 3-year changes in the RV/TLC. Group A→A showed the highest E/I MLD value in both the baseline and follow-up measurements. Groups A→N and A→A showed the highest baseline EI values. The mean baseline bronchial WA was highest in groups A→N and A→A (67.2% and 67.6%, respectively; p = 0.002). Group A→A had the highest baseline inspiratory and expiratory lung volumes among the four subgroups (p = 0.003 and p = 0.001, respectively).
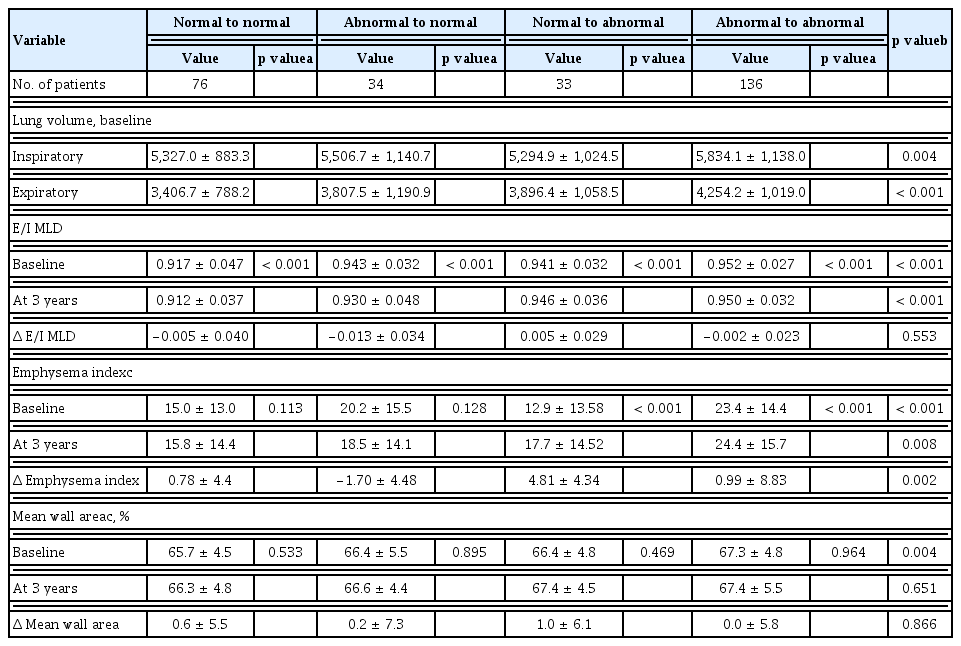
Comparison of quantitative CT parameters among the different groups of COPD patients stratified by 3-year changes in residual volume to total lung capacity ratio
All subgroups showed significant within-group change in E/I MLD. Group A→N showed a significant decrease of −0.013 (p < 0.001), while group A→N showed an increase of 0.005 (p < 0.001). Three-year change in EI differed significantly among the four groups (p = 0.002). Groups N→A and A→A showed significant within-group changes in EI: group N→A and group A→A showed a significant mean increase of 4.81 (p < 0.001) and 0.99 (p < 0.001), respectively.
Factors associated with moderate to severe exacerbation frequency during the first year of follow-up
Table 3 shows the results of analyses of factors associated with moderate to severe exacerbation frequency. We entered age, sex, FEV1 (%), SGRQ score, BMI, smoking status, major comorbidities, bronchodilator use, and COPD phenotype according to the change in RV/TLC in a univariate analyses (Table 3). FEV1 (%), SGRQ score, and COPD phenotype according to the change in RV/TLC were significant on the univariate analysis, and they were entered in a multivariate analysis. The multivariable analysis revealed that COPD phenotype according to the change in RV/TLC was not significant. FEV1 (%) and SGRQ score were significant in the multivariable analysis.

Univariate and multivariate analyses on the associations of factors with exacerbation frequency during the first year of follow-up
Comparison of overall survival
The OS of the four groups was compared using a log-rank test. No pairwise comparison showed a significant difference in OS. The A→A group did not show statistically significant difference in mortality when compared to other groups (Table 4). Cox regression analyses were performed for OS, but no significant associations were observed between shorter survival and pattern of change in the RV/TLC.

Pairwise comparison of mortality risk between the different types (log-rank test)
DISCUSSION
In the present study, patients with COPD whose RV/TLC increased over 3 years showed deterioration of pulmonary function. Furthermore, the phenotype in which the RV/TLC increased from normal to abnormal showed simultaneous worsening of the volumetric CT parameters related to air trapping, such as E/I MLD and EI. Few studies have shown correlations between longitudinal changes in air trapping and clinical outcomes in patients with COPD. After stratifying the patients by the pattern of change in RV/TLC, our study attempted to show simultaneous changes in lung function and their longitudinal change in prognosis.
Patients whose RV/TLC increased from normal to abnormal (N→A) showed a marked decrease in FEV1 and FVC, and the changes were significantly different from those for the other phenotypes. The most interesting finding was that the group whose RV/TLC changed from abnormal to normal (A→N) showed increases in FEV1 and FVC. These contrasting changes between the two groups suggest that reduced air trapping could be associated with improved lung function.
In the present study, it was observed that as RV/TLC changes in patients with COPD, volumetric CT parameters also showed simultaneous changes. E/I MLD and EI were reported to show significant associations with air trapping in COPD. EI is significantly correlated with the RV/TLC [13]. Furthermore, E/I MLD was significantly correlated with RV/TLC in the previous study [15]. It is clinically meaningful to see that volumetric CT parameters also modifies along with RV/TLC, as few studies showed the association between longitudinal changes of both test results. Nevertheless, a future study is necessary to provide detailed explanation for the interrelations between RV/TLC and volumetric CT parameters.
However, the pattern of change in RV/TLC did not show significant association with both survival and moderate to severe exacerbation during the follow-up period. A change in RV/TLC was significant in the univariate analysis for association with exacerbation frequency, but not in the multivariable analysis. Its impact on prognosis may not be as significant as those of the known parameters such as FEV1 (%) or SGRQ score. However, this may be due to a relatively small sample size in each separate subgroup.
Some limitations of this study should be discussed. First, only the patients with 3-year follow-up results for PFT were evaluated, so selection bias may have been present. Second, the numbers of patients allocated to some subgroups such as A→N and N→A were too small to provide conclusive result. Further study using a larger population is necessary to more accurately evaluate the association between change in RV/TLC and longitudinal impact on the prognosis.
Volumetric CT has been used to evaluate the lungs of patients with COPD and showed good ability to visualize air trapping and small airway disease in patients with COPD [18–20]. However, CT measurements have not been standardized and volumetric CT is not readily available in the clinical setting. On the other hand, RV/TLC measurements are relatively standardized and available in clinical settings worldwide. Our study suggests that change in RV/TLC is predictive of progressive worsening of pulmonary functions, while showing correlation with the CT findings.
Patients with COPD whose RV/TLC increased from normal to abnormal showed deteriorating pulmonary function, and increases in E/I MLD and EI of volumetric CT. Further studies are necessary to explain the relationship between clinical outcome and longitudinal changes in the RV/TLC in patients with COPD.
KEY MESSAGE
Residual volume to total lung capacity ratio (RV/TLC) changes over time, and its influence on the prognosis of patients with chronic obstructive pulmonary disease (COPD) varies over the disease course, so evaluating the clinical impact of a longitudinal change in air trapping on the prognosis of patients with COPD is clinically important.
The phenotype of COPD patients in which the RV/TLC increased from normal to abnormal was associated with worsening of pulmonary function and volumetric computed tomography parameters.
Supplementary Information
Acknowledgments
This study was supported by a grant from the Korean Health 21 R&D Project, Ministry of Health and Welfare, Republic of Korea (HI10C2020 and A102065).
We authors thank the members of the KOLD Study Group for the provision of the KOLD Cohort data (Obstructive Lung Disease Research Foundationhttp://www.oldrf.org).
Of the 16 participating hospitals, patient data from following 13 hospitals met the inclusion criteria for the present study: Asan Medical Center, Bundang CHA Hospital, Ewha Womans University Mokdong Hospital, Korea University Anam Hospital, Hanyang University Guri Hospital, Inje University Ilsan Paik Hospital, Kangbuk Samsung Hospital, Hallym University Kangnam Sacred Heart Hospital, Kangwon National University Hospital, Seoul National University Hospital, Seoul National University Bundang Hospital, Konkuk University Hospital, and The Catholic University of Korea Yeouido St Mary’s Hospital.
Notes
Conflict of interest
No potential conflict of interest relevant to this article was reported.