Change in management and outcome of mechanical ventilation in Korea: a prospective observational study
Article information

Abstract
Background/Aims
There are few studies describing contemporary status of mechanical ventilation in Korea. We investigated changes in management and outcome of mechanical ventilation in Korea.
Methods
International, prospective observational cohort studies have been conducted every 6 years since 1998. Korean intensive care units (ICUs) participated in 2010 and 2016 cohorts. We compared 2016 and 2010 Korean data.
Results
Two hundred and twenty-six patients from 18 ICUs and 275 patients from 12 ICUs enrolled in 2016 and 2010, respectively. In 2016 compared to 2010, use of non-invasive ventilation outside ICU increased (10.2% vs. 2.5%, p = 0.001). Pressure-control ventilation was the most common mode in both groups. Initial tidal volume (7.1 mL/kg vs. 7.4 mL/kg, p = 0.372) and positive end-expiratory pressure (6 cmH2O vs. 6 cmH2O, p = 0.141) were similar, but peak pressure (22 cmH2O vs. 24 cmH2O, p = 0.011) was lower in 2016. More patients received sedatives (70.7% vs. 57.0%, p = 0.002) and analgesics (86.5% vs. 51.1%, p < 0.001) in 2016. The awakening (48.4% vs. 31.0%, p = 0.002) was more frequently attempted in 2016. The accidental extubation rate decreased to one tenth of what it was in 2010 (1.1% vs. 10.2%, p < 0.001). The ICU mortality did not change (31.4% vs. 35.6%, p = 0.343) but ICU length of stay showed a decreasing trend (9 days vs. 10 days, p = 0.054) in 2016.
Conclusions
There were temporal changes in care of patients on mechanical ventilation including better control of pain and agitation, and active attempt of awakening.
INTRODUCTION
Mechanical ventilation is one of the most important treatment interventions provided in the intensive care unit (ICU) with about one third of critically ill patients receiving mechanical ventilation for respiratory failure of various causes [1]. Although mechanical ventilation is needed to help patients overcome the acute stages of critical illness, its application is not without risk. There are guidelines based on randomized clinical trials on how to provide mechanical ventilation to patients safely minimizing complications and to improve survival [2]. However, perhaps it is more important to assess whether such strategies are implemented properly in daily practice, thereby providing guidance on how to improve management of these patients.
Esteban et al. [1,3,4] have conducted international cohort studies every 6 years since 1998 to describe the general characteristics, treatment-related variables, and clinical outcomes of patients who have received mechanical ventilation and to evaluate the evolution of management according to newly published evidence. Twelve Korean ICUs participated in the third international cohort for the first time in 2010 [5], and 18 Korean ICUs participated in the fourth cohort in 2016. The aim of this study was to identify meaningful changes in management and outcome of patients undergoing mechanical ventilation in Korea from two cohorts of 2010 and 2016 studies.
METHODS
Design and population
Similar to previous studies [1,3,4], the fourth study was a prospective, and multicenter, non-interventional single-cohort study that maintained similar methodologies (https://clinicaltrials.gov/ct2/show/record/NCT02731898). Adult patients who were admitted to ICUs between July 1 and July 31, 2016, and required invasive mechanical ventilation longer than 12 hours or non-invasive ventilation (NIV) for more than 1 hour were included. We extracted and analyzed the data of patients from 18 participating Korean ICUs from the fourth cohort (2016 cohort) and compared them with data of Korean ICUs from the third international study (2010 cohort).
Data collection
Only the investigator and research coordinators at each site were aware of the purpose and the timing of the study to minimize any practice modifications in response to observation. Baseline demographics were recorded at the beginning of mechanical ventilation. Ventilator and clinical parameters, co-adjuvant therapies, and complications were recorded daily for the duration of mechanical ventilation, or until the 28th day. Variables relevant to ventilator liberation and mortality were also collected.
There were changes in the definitions and terminologies of some complications. The American-European Consensus Conference definition was used in the 2010 cohort to define acute respiratory distress syndrome (ARDS) [6], whereas the Berlin definition was applied to the 2016 cohort [7]. However, only moderate to severe patients, based on the newer definition, were considered to have ARDS in order to maintain consistency. Ventilator-associated pneumonia was investigated in the 2016 cohort instead of ICU-acquired pneumonia, but they were conceptually identical and based on the modified criteria of the Centers for Disease Control and Prevention [8]. The terminology for neuromuscular weakness was changed from critical illness polyneuropathy and myopathy in the 2010 cohort to ICU-acquired weakness (ICUAW) in the 2016 cohort [9]. As with the previous study by Jeong et al. [5], organ failure was defined as having a Sequential Organ Failure Assessment (SOFA) score of ≥ 3 for each organ [10]. However, the definition of renal failure was altered in our study. We used serum creatinine or daily urine output corresponding to SOFA scores ≥ 3 rather than serum creatinine or the need for renal replacement therapy used in previous studies [5]. The definition of sepsis remained unchanged [11].
In this study, 28-day mortality was calculated from the first day of mechanical ventilation. Ventilator-free days (VFDs) were defined as days alive without invasive mechanical ventilation within the 28 days. The study protocol was approved by the Institutional Review Board (IRB) of each hospital (Samsung Medical Center, IRB No. 2016-04-142; Seoul National University Hospital, IRB No. H-1605-109-763), and the need for consent was waived due to the non-interventional nature of the protocol.
Statistical analysis
Continuous variables were expressed as medians with interquartile ranges, and the categorical variables were expressed as numbers and percentages. The Mann-Whitney U test and Fisher’s exact test were used to analyze continuous and categorical variables, respectively. All tests were two sided, and p value less than 0.05 was considered statistically significant. Data were analyzed using SPSS version 25.0 (IBM, Armonk, NY, USA).
RESULTS
Baseline characteristics
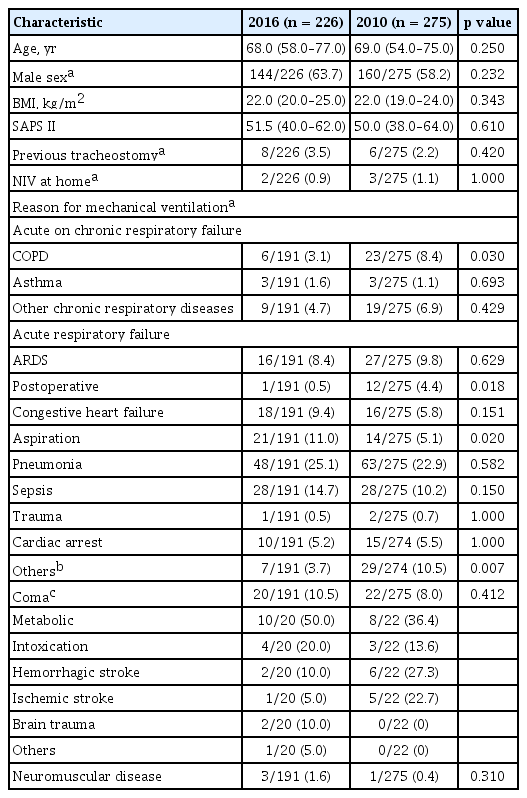
A total of 226 patients from 18 Korean ICUs were enrolled in the 2016 cohort, and their data was compared with that of 275 patients from 12 ICUs from the 2010 cohort. Table 1 shows the baseline characteristics of patients in the two cohorts. Age, body mass index, and Simplified Acute Physiology Score II (SAPS II) score on admission were similar in the two cohorts. More patients were male in the 2016 cohort than in the 2010 cohort, but the difference was not significant (63.7% vs. 58.2%, p = 0.232). Pneumonia (25.1%) and sepsis (14.7%) were the most common conditions leading to mechanical ventilation in both cohorts, and followed by aspiration (11.0%) in the 2016 cohort (Table 1).
Baseline characteristics
Management of mechanical ventilation
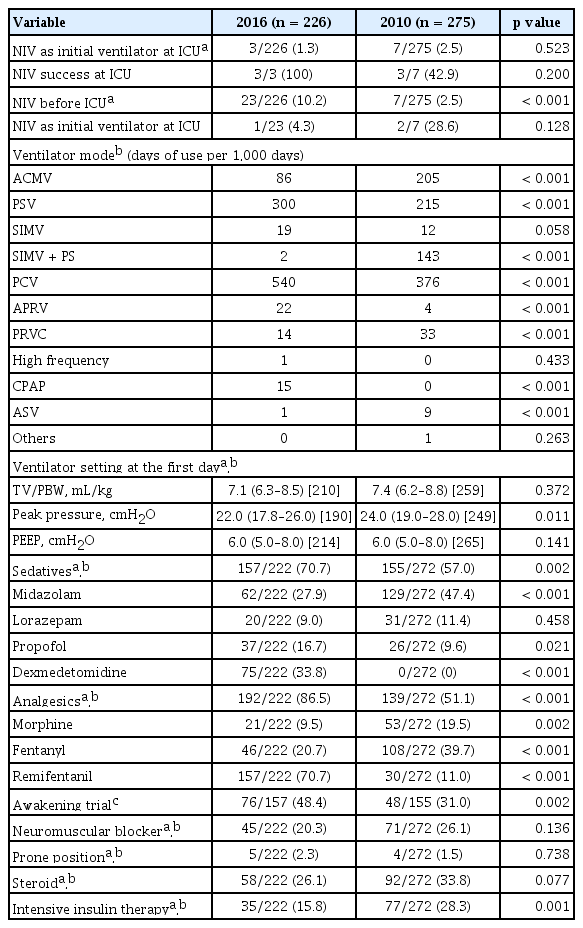
Table 2 shows variables related to the management of mechanically ventilated patients. The use of NIV before coming to the ICU increased to 23 patients (10.2%) in the 2016 cohort from seven patients (2.5%) in the 2010 cohort (p < 0.001). But, only three patients (1.3%) were treated with NIV as their initial ventilator strategy including one patient who was started on NIV before coming to the ICU in the 2016 cohort while in the 2010 cohort, seven (2.5%) patients including two who started NIV outside the ICU received NIV as their initial strategy (p = 0.523). Underlying disease for the three patients in the 2016 cohort included one congestive heart failure (CHF) and one chronic obstructive pulmonary disease (COPD) patients. In the 2010 cohort, two had COPD, two had chronic respiratory disease, and two had either pneumonia or aspiration. In the 2016 cohort, NIV failure was not seen while in the 2010 cohort four out of seven patients eventually needed intubation and invasive mechanical ventilation. Prognosis for patients who were initially treated with NIV was good with every patient alive at ICU discharge except for one patient who needed invasive mechanical ventilation in the 2010 cohort.
Management and co-adjuvant therapy of mechanical ventilation
For both cohorts, pressure-control ventilation (PCV) was the most frequently applied mode, followed by pressure-support ventilation (PSV), and volume-cycled assist-control ventilation (ACMV). The proportion of patients with PCV was particularly high in the early period, and gradual and reciprocal switch in the proportion of patients with PCV and PSV was found (Fig. 1). Although ACMV remained the third most common mode in the 2016 cohort, its use had decreased significantly compared to 2010 cohort (Table 2) in contrast to the increased use of PCV and PSV which occupied 84% of the total period of invasive mechanical ventilation in 2016. Synchronized intermittent mandatory ventilation with pressure-support was seldom employed in the 2016 cohort.
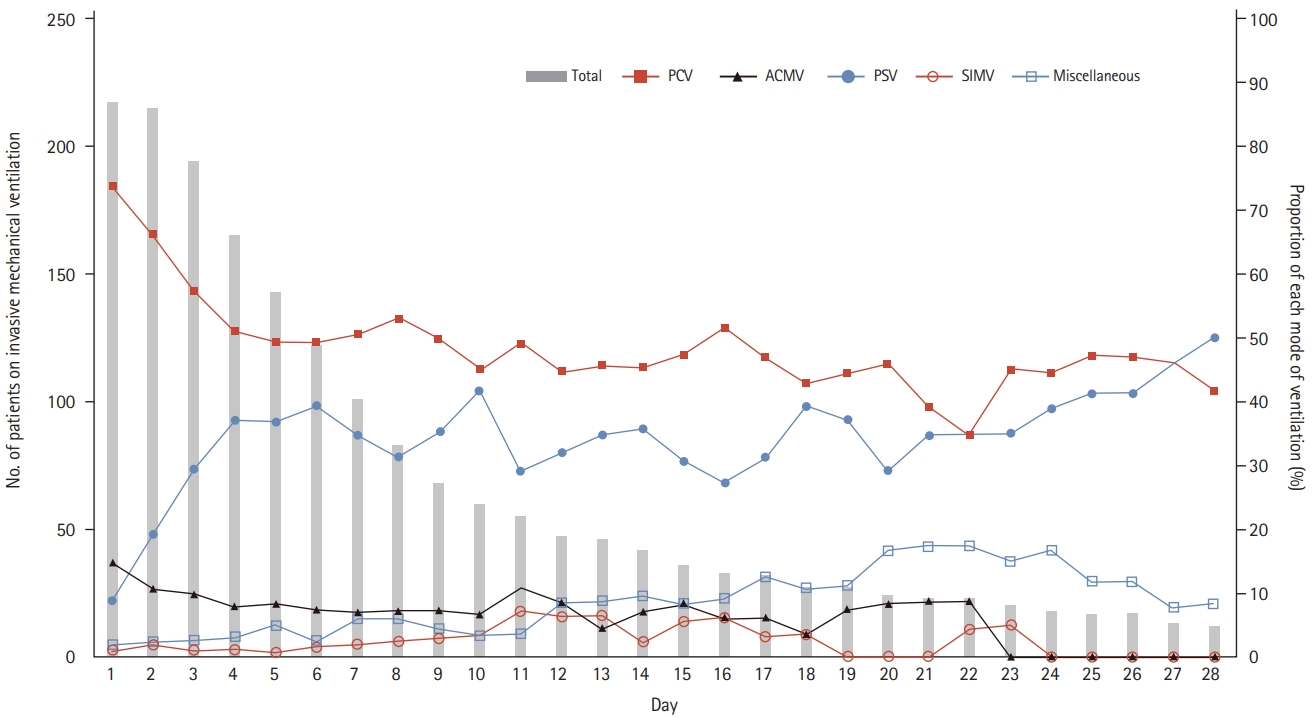
Ventilator mode during the course of invasive mechanical ventilation. Bar graphs represent the daily number of patients who were supported by invasive mechanical ventilation. Line graph represent the daily proportion of each mode of ventilation. Miscellaneous mode includes airway pressure release ventilation, pressure regulated volume control, continuous positive airway pressure, adaptive support ventilation, and high frequency oscillatory ventilator mode. PCV, pressure-control ventilation; ACMV, volume-cycled assist-control ventilation; PSV, pressure-support ventilation; SIMV, synchronized intermittent mandatory ventilation.
Median tidal volume per predicted body weight (TV/PBW) on the first day of mechanical ventilation was 7.1 mL/kg for the 2016 cohort which was slightly decreased from 7.4 mL/kg for the 2010 cohort (p = 0.141). Peak pressure on the first day was 22.0 cmH2O for the 2016 cohort which was significantly reduced from 24 cmH2O in the 2010 cohort (p = 0.011). The median positive end-expiratory pressure (PEEP) on the first day of mechanical ventilation was similar (6.0 cmH2O vs. 6.0 cmH2O, p = 0.141) for both cohorts.
In the 2016 cohort, the proportion of patients who received sedatives (70.7% vs. 57.0%, p = 0.002) and analgesics (86.5% vs. 51.1%, p < 0.001) was significantly higher than in the 2010 cohort, and the use of dexmedetomidine (33.8% vs. 0%, p < 0.001) and remifentanil (70.7% vs. 11.0%, p < 0.001) was markedly increased. They were the most frequently prescribed sedative and analgesic, respectively. The use of benzodiazepines, particularly midazolam, was decreased to 27.9% in 2016 from 47.4% in 2010 (p < 0.001). Although more patients were receiving sedatives, awakening trials were conducted more often (48.4% vs. 31.0%, p = 0.002) in the 2016 cohort. For the 2016 cohort, light sedation (Richmond Agitation-Sedation Scale [RASS] −2 to 1) was maintained in more than 50% of patients who were assessed except for the first 5 days, and agitation (RASS 2 to 4) was present in less than 10% of patients during the overall period of mechanical ventilation (Fig. 2).

Level of sedation during the course of invasive mechanical ventilation. Bar graphs represent the daily number of patients who were supported by invasive mechanical ventilation and were assessed for sedation and agitation using Richmond Agitation-Sedation Scale (RASS). Deep sedation, light sedation, and agitation are defined by RASS −5 to −3, −2 to 1, and 2 to 4, respectively.
Acute respiratory distress syndrome
Patients, whose main reason for mechanical ventilation was ARDS, were compared separately between the two cohorts in terms of ventilator strategy and co-adjuvant therapies (Table 3). The number of patients who were ventilated in PCV mode on the first day of mechanical ventilation was increased significantly (93.3% vs. 55.6%, p = 0.015) with no patient being ventilated in ACMV. There were no significant differences in TV/PBW, peak pressure or PEEP in the two cohorts (Table 3) The use of co-adjuvant therapies including rescue therapies were also similar between 2010 and 2016 cohorts, except for the increased administration of analgesics (100% vs. 55.6%, p = 0.001) in the 2016 cohort.

Ventilator strategy and co-adjuvant therapy of acute respiratory distress syndrome
Liberation from mechanical ventilation
Table 4 shows several aspects of ventilator liberation. More patients attempted weaning trials (71.4% vs. 61.4%, p = 0.029) and the use of gradual reduction of ventilatory support methods increased (68.9% vs. 10.8%, p < 0.001) in the 2016 cohort. The success rate of planned extubation among patients who attempted weaning was similar, but the rate of accidental extubation decreased to almost one-tenth of the 2010 rate (1.1% vs. 10.2%, p < 0.001) in the 2016 cohort. The most common reason for reintubation was an increased work of breathing for both 2010 and 2016 cohorts. NIV was applied for prevention or treatment of post-extubation respiratory failure in 7.5% of patients in 2016, which was similar to the 2010 cohort. High-flow nasal cannula (HFNC) was applied in 32.1% of patients in the 2016 cohort which was not available in 2010. Tracheostomy rates were similar, but the median time to tracheostomy was reduced (7.0 days vs. 8.5 days, p = 0.014), and more patents underwent percutaneous dilatational tracheostomy (PDT) (48.1% vs. 11.9%, p = 0.002) in the 2016 cohort.

Liberation from invasive mechanical ventilation
Clinical outcomes
Table 5 describes the clinical outcomes and complications of mechanical ventilation in the two cohorts. The ICU mortality rate was 31.4% for the 2016 cohort and 35.6% for the 2010 cohort (p = 0.343). ICU mortality was also not significantly different for different initial diagnostic groups in the two cohorts. However, the ICU length of stay (LOS) showed a decreasing trend from a median of 9 days in the 2016 cohort from 10 days in the 2010 cohort (p = 0.054). VFD was median 18 days in the 2016 cohort compared to 14 days in the 2010 cohort, although this difference did not reach statistical significance (p = 0.534). The rates of patients who suffered complications of sepsis (21.9% vs. 50.6%, p < 0.001) was significantly lower in the 2016 cohort. Significantly higher proportion of patients was recognized as having delirium (37.4% vs. 8.0%, p < 0.001) and ICUAW (5.0% vs. 0.7%, p = 0.004) in the 2016 cohort.
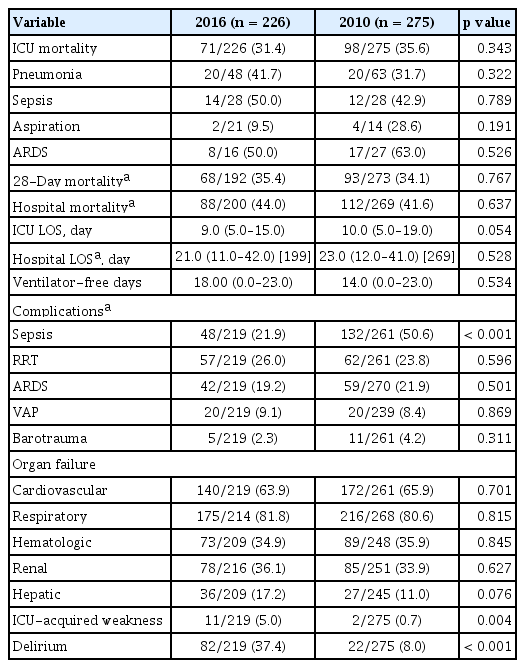
Clinical outcomes and complications of mechanical ventilation
DISCUSSION
In the current study, we describe the latest status of mechanical ventilation in Korea and observed temporal changes in ventilator operations, the management of pain and agitation, and liberation from ventilators between 2016 and 2010 cohorts participating in international multicenter study.
Similar to 2010, the use of NIV in ICU was still low in 2016. This finding is quite different from situations in other countries where 37% of mechanically ventilated patients used NIV as initial ventilator mode in France [12], and 20% of patients started mechanical ventilation with NIV in the United States [13]. It should be noted that NIV use outside ICU has greatly increased in 2016 cohort compared to 2010 cohort. But surprisingly, only one patient who needed ventilator support due to CHF, continued to receive NIV after the patient was transferred to the ICU. Thus increased use of NIV during pre-ICU period may reflect general shortage of ICU resources rather than increased use of NIV for clinically appropriate indications. This is reflected in the fact that only three patients out of 22 patients who received pre-ICU NIV but were started on invasive mechanical ventilation in the ICU had conditions associated with high success rate of NIV such as CHF and neuromuscular disease (data are not shown).
Increased use of pressure modes have been reported previously [1]. However, the preference for pressure modes was stronger in Korea [5], and became more pronounced in the 2016 cohort, especially in ARDS patients in whom pressure modes were exclusively used. This is interesting because there is still no evidence that pressure-targeted ventilation is superior to volume-targeted ventilation [14,15].
One of the most remarkable findings in this study is the temporal changes in the use of analgesics and sedatives. Analgesics were administered in 27% of mechanically ventilated patients in Korea in an unrelated multicenter observational study in 2003 [16]. The prevalence of analgesic use increased to 51.1% in the 2010 cohort [5] and to 86.5% in the 2016 cohort. These changes may reflect that many ICUs now follow the 2013 Pain, Agitation, and Delirium (PAD) guideline, which stressed that appropriate pain control is an important part of patient care [17]. The most frequently used analgesic has changed from morphine to fentanyl [5,16,18] and remifentanil. Although the 2013 PAD guideline did not recommend a specific opioid, remifentanil is a reasonable choice as an analgesics in patients on mechanical ventilation because it is easily titratable, dose not accumulate in organ failure, and has short-action time [19]. The proportion of patients who receiving dexmedetomidine and propofol increased while use of benzodiazepines decreased also reflecting compliance with the 2013 PAD guideline. Also, higher proportion of patients were undertaking awakening trials in 2016 to decrease amount of sedatives.
In the 2016 cohort, proportion of patients using spontaneous breathing trial (SBT) as the method at first attempt was only 31.1%. This was even decreased compared to 2010 cohort which was 89.2%. It is well known that daily screening and SBT can improve outcome such as increasing VFD [20]. In many ICUs around the world, weaning process is protocolized and screening and SBT are carried out by specialized team usually consisting of respiratory therapists. Since in Korea, there are no respiratory therapists or specialized teams to carry out this task, in many ICUs weaning process is not standardized and thus high percentage of patients weaned through decreased support level as seen with this cohort. This is an area that critical care community as a whole need to improve on.
Since its introduction between 2010 and 2016, HFNC has become widely used in Korean ICU due to several studies favoring its use in acute respiratory failures and post-extubation conditions [21–23]. Until 2010, PDT was not widely adopted in Korea in contrast to international cohorts in whom more than 50% of patients underwent PDTs in 2004 [4]. In 2016, half of all tracheostomies were performed using the percutaneous method.
The changes seen in practice of care in ventilated patients in this study might reflect efforts of the critical society in Korea to bring about change in governmental policy and to educate and cultivate critical care specialist. After years of effort, subspecialty board in critical care was established in 2009 [24]. The government insurance agency, Health Insurance Review and Assessment Service, does periodic assessment of quality of care in critical care which is bound to reimbursement. Also for the first time, hospitals much have full-time intensivists to apply for tertiary-referral center status. Through these efforts, the proportion of ICUs with dedicated intensivists increased from 17.3% in 2009 to 51.1% in 2014 [25].
Despite meaningful changes in the practice of mechanical ventilation, major clinical outcomes such as mortality, LOS, and VFD were not significantly improved. This may be because other confounding factors such as comorbidity or frailty might have influenced outcome. For example, a recent study demonstrated that the Charlson Comorbidity Index has increased over time in Korean ICU patients [26]. Also, the most prominent change between 2010 and 2016 cohorts was widespread implementation of the 2013 PAD guideline. However, the guideline and supporting evidences are not primarily intended to improve survival in ICU but more related to quality of life in the post-ICU period which was not measured. In 2013, the beneficial effects of a prone position were demonstrated in selected ARDS patients [27], and indeed the proportion of ARDS patients who underwent prone position increased in 2016. However, the number of prone positioned patients was too small to affect mortality of the whole study population. In a similar way, management improvement in certain diseases, if any, would not change outcomes of this heterogeneous population. Moreover, TV/PBW, the oldest and strongest determinant of outcome of mechanical ventilation, has been maintained in acceptable range without significant change. It is worth noting the decreasing trend of ICU LOS. This change may result from the improvement of pain and agitation control, and the increase in awakening and weaning trials.
More patients were reported to have ICUAW and delirium in 2016. For the ICUAW, direct comparisons were limited due to varying definitions in 2010 and 2016. The incidence reported in 2016 (5.0%) was much lower than what has been presented in other studies [28], in spite of its rapid rise. It appears that ICUAWs had been underestimated and the awareness has increased rather than the occurrence. This explanation also fits the increased incidence of delirium. Similar findings were observed in the United States/Canada regions in the fourth international cohort [29].
There are several limitations in the present study. First, we compared the mortality of the overall study population without considering site effects. However, comparing only identical ICUs would lower the statistical power because of the reduced number of patients. All participating institutions were academic teaching hospitals in one country, so site effects may not be large. Second, while the number of participating ICUs in 2016 was larger, the number of enrolled patients was smaller. In addition, missing data were more common with possible concerns regarding the risk of data distortion. However, our result was concordant with the international data [29]. Thirdly, while we evaluated whether a patient received medication, we did not investigate dose or treatment duration.
In conclusion, the current study shows the evolution of management of mechanically ventilated patients in Korea over 6 years. Better control of pain and agitation, and active attempt of awakening was noted but steps to improve weaning process is needed. In addition, the recognition of delirium and ICUAW has improved.
KEY MESSAGE
1. More patients received sedatives and analgesics. The use of dexmedetomidine and remifentanil increased. Conversely, the use of midazolam decreased.
2. More patients attempted to awakening and weaning trials.
3. The recognition of delirium and intensive care unit (ICU)-acquired weakness has improved.
4. The ICU mortality did not change but the ICU length of stay showed a tendency to decrease.
Notes
No potential conflict of interest relevant to this article was reported.
Acknowledgements
We appreciate all members of the Korean Study Group on Respiratory Failure (KOSREF).