Temporal evolution of programmed death-ligand 1 expression in patients with non-small cell lung cancer
Article information
Abstract
Background/Aims
Programmed death-ligand 1 (PD-L1) expression, a validated predictive biomarker for anti-PD-1/PD-L1 inhibitors, is reported to change over time. This poses challenges during clinical application in non-small cell lung cancer.
Methods
This study included patients with non-small cell lung cancer who underwent surgery or biopsy and evaluation of PD-L1 expression in tumor cells via immunohistochemistry more than twice. We set the threshold of PD-L1 positivity to 10% and categorized patients into four groups according to changes in PD-L1 expression. Clinicopathologic information was collected from medical records. Statistical analyses, including Fisher’s exact test and log-rank test, were performed.
Results
Of 109 patients, 38 (34.9%) and 45 (41.3%) had PD-L1 positivity in archival and recent samples, respectively. PD-L1 status was maintained in 78 (71.6%) patients, but changed in 31 (28.4%), with 19 (17.4%) from negative to positive. There were no significant differences in characteristics between patients who maintained PD-L1 negativity and whose PD-L1 status changed from negative to positive. Patients harboring PD-L1 positivity in either archival or recent samples achieved better responses (p = 0.129) and showed longer overall survival than those who maintained PD-L1 negativity when they received immune checkpoint inhibitors after platinum failure (median overall survival 14.4 months vs. 4.93 months; hazard ratio, 0.43; 95% confidence interval, 0.20 to 0.93).
Conclusions
PD-L1 status changed in about one-fourth of patients. PD-L1 positivity in either archival or recent samples was predictive of better responses to immune checkpoint inhibitors. Therefore, archival samples could be used for assessment of PD-L1 status. The need for new biopsies should be decided individually.
INTRODUCTION
Cancer cells evade the immune system by multiple mechanisms, one of which involves immune-inhibitory pathways, called immune checkpoints, which normally function in the maintenance of immune homeostasis [1]. Blockade of immune checkpoints for augmenting antitumor immunity has emerged as a promising approach to novel cancer treatment. Clinical trials using immune checkpoint inhibitors demonstrated durable objective responses and extended overall survival (OS) compared to cytotoxic chemotherapies in patients with non-small cell lung cancer (NSCLC). This supported the approval of anti-programmed death-ligand 1 (anti-PD-L1)/PD-L1 drugs by the U.S. Food and Drug Administration [2,3].
However, immune checkpoint inhibitors are not effective in all patients, highlighting the investigation of predictive biomarkers for the optimization of therapeutic strategies [4]. To date, various biomarker signatures have been developed, such as PD-L1 expression [5], tumor-infiltrating lymphocytes [6], mutational burden [7], immune cytolytic activity score [8], interferon-γ signature [9], and immune signature [10].
Assessing tumor cell PD-L1 expression for the prediction of response to anti-PD-1/PD-L1 therapy seems rational; moreover, clinical trials have demonstrated a significant association between the level of PD-L1 expression and efficacy of anti-PD-1 drugs in NSCLC [2,3]. However, several limitations on the use of PD-L1 expression as a predictive biomarker were observed, including temporal changes, which indicated that PD-L1 expression appeared to change over time as cancer progressed and as anti-cancer treatments were administered [11,12]. This raises the question of whether newly acquired samples are mandatory for the accurate determination of PD-L1 status, or it is still clinically beneficial to determine the PD-L1 status using previously collected samples. To address this problem, a previous study compared the PD-L1 status between archival and recent samples in patients with NSCLC, and reported a concordance rate of 67%; however, they did not evaluate how changes in PD-L1 expression affected the response to immune checkpoint inhibitors [11]. Another study compared the predictive value of PD-L1 expression in archival and recent samples, and showed that PD-L1 status was predictive of the clinical benefits regardless of the age of the sample [13]. In this study, we analyzed the clinical characteristics of patients with NSCLC, who underwent surgery or biopsy for tumor samples, and evaluated the PD-L1 expression status by immunohistochemistry (IHC) assays more than twice. We assessed the concordance rate of PD-L1 status, clinicopathologic characteristics related to changes in PD-L1 expression, and differences in response to immune checkpoint inhibitors according to the temporal changes in PD-L1 expression.
METHODS
Study population
Among the patients with NSCLC who visited Seoul National University Hospital from 2010 to 2018, those who underwent surgery or biopsy for tumor samples, and evaluation of PD-L1 expression via IHC assays more than twice were selected based on the data retrieved from the Seoul National University Hospital Patients Research Environment system. For the IHC assay, any of the following antibodies, 22C3 (Dako, Carpinteria, CA, USA), 28-8 (Dako), E1L3N (Cell Signaling Technology, Danvers, MA, USA), SP142 (Ventana, Tucson, AZ, USA), or SP263 (Ventana) could be used for the assessment of PD-L1 expression. In addition, for patients who were administered immune checkpoint inhibitors and evaluated for PD-L1 expression using recently collected samples, the PD-L1 expression analysis was performed on archival samples only if they were available.
We retrospectively analyzed the clinicopathologic information from the electronic medical records. PD-L1 positivity was determined using a threshold of 10% for PD-L1 expression in tumor cells, called Tumor Proportion Score (TPS) [3], which is one of the conservative cut-off values suggested in a previous study [2]. The patients were divided into four groups according to the PD-L1 expression status in archival and recent samples: the negative to negative (PD-L1 [−/−] group), negative to positive (PD-L1 [−/+] group), positive to negative (PD-L1 [+/−] group), and positive to positive (PD-L1 [+/+] group). Responses to immune checkpoint inhibitors were assessed using the Response Evaluation Criteria In Solid Tumors version 1.1 [14].
Statistical analysis
The patient characteristics were compared using the chi-square test or Fisher’s exact test, as appropriate. Survival analyses were performed using the Kaplan-Meier method, log-rank test, and Cox proportional hazards model, and summarized as the hazard ratio (HR) and 95% confidence interval (CI). All tests were two-tailed and a p < 0.05 was considered statistically significant. All statistical analyses were performed using SPSS Statistics for Windows version 25.0 (IBM Corp., Armonk, NY, USA).
Ethical statement
This study was approved by the Institutional Review Board at Seoul National University Hospital (changes in PD-L1 expression after chemotherapy in patients with non-small cell lung cancer, IRB no. H-1902-093-1010). Written informed consent from patients was waived as this was a retrospective study.
RESULTS
Patient characteristics
A total of 99 patients with NSCLC underwent surgery or biopsy, and evaluation of PD-L1 expression more than twice. In addition, 10 patients who underwent additional PD-L1 tests on archival samples using the SP263 assay were also analyzed. Overall, about 70% of the samples were evaluated using the SP263 assay (Supplementary Table 1), and the concordance of IHC assays used in archival and recent samples was 56.9%. The baseline characteristics of the patients are summarized in Table 1. Overall, the median age of patients was 67 years (range, 29 to 88), and 77 (70.6%) were males. More than half of the patients (64.2%) had adenocarcinoma, and the majority of patients were initially diagnosed with stage III (19.3%) or IV (62.4%) lung cancer. The median follow-up duration was 32.1 months (range, 2.3 to 162.2). Six patient samples were assessed for PD-L1 expression at least three times; for such patient samples, the earliest and latest ones were included in the analysis.

Patient characteristics
Among 109 patients, 52 (47.7%) maintained negative PD-L1 status in both archival and recent samples (PD-L1 [−/−] group), 19 (17.4%) showed changes in PD-L1 status from negative in the archival sample to positive in the recent sample (PD-L1 [−/+] group), 12 (11.0%) showed changes in PD-L1 status from positive in the archival sample to negative in the recent sample (PD-L1 [+/−] group), and 26 (23.9%) retained PD-L1 positivity in both archival and recent samples (PD-L1 [+/+] group). In other words, 38 (34.9%) patients in archival samples and 45 (41.3%) in recent samples showed PD-L1 positivity. In addition, 78 (71.6%) patients maintained their PD-L1 status, whereas 31 (28.4%) showed changes in PD-L1 status, with 19 (17.4%) showing changes in PD-L1 status from negative to positive. When the patients in the four groups were compared, no significant differences in major clinicopathologic characteristics were observed (Table 1, Supplementary Fig. 1).
Comparison of characteristics of patients with PD-L1 (−/−) versus PD-L1 (−/+) statuses
To assess the clinicopathologic characteristics relevant to the positive conversion of PD-L1, we compared patients in the PD-L1 (−/−) group with those in the PD-L1 (−/+) group. Patients in the PD-L1 (−/−) group mostly received taxane-based chemotherapy and radiotherapy between the two biopsy time points; however, there were no significant differences in characteristics between the two groups (Table 2). Brief clinical information of patients with positive conversion of PD-L1 is described in Supplementary Table 2.
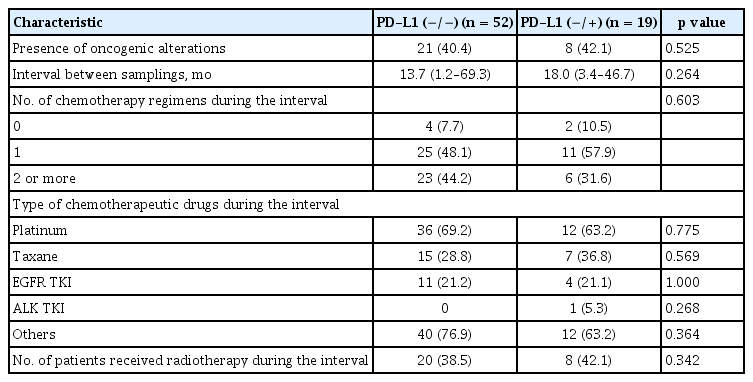
Comparison of clinicopathologic characteristics between patients in the PD-L1 (−/−) and PD-L1(−/+) groups
Responses to immune checkpoint inhibitors
Among 109 patients included in this study, 56 were given immune checkpoint inhibitors after failure of platinum-based therapy. The number of patients who belonged to the PD-L1 (−/−), PD-L1 (−/+), PD-L1 (+/−), and PD-L1 (+/+) groups were 18, 11, 7, and 20 patients, respectively. Forty-one (73.2%) patients were administered nivolumab, while eight (14.3%) and seven (12.5%) patients were administered pembrolizumab and atezolizumab, respectively. There were no significant differences in the pre-treatment characteristics such as the Eastern Cooperative Oncology Group (ECOG) performance status, number of prior chemotherapy regimens, type of prior chemotherapy, and follow-up durations among patients in the four groups (Table 3).

Pre-treatment characteristics and best responses to immune checkpoint inhibitors
Notably, only patients in the PD-L1 (−/+), PD-L1 (+/−), and PD-L1 (+/+) groups had an objective response to immune checkpoint inhibitors, and showed objective response rates of 18.2%, 14.3%, and 30.0%, respectively. None of the patients in the PD-L1 (−/−) group achieved an objective response (0%). In addition, patients with PD-L1 positivity in any of the archival or recent samples (PD-L1 [+, any] group) showed a median OS of 14.4 months, which was significantly longer than that of those who maintained negative PD-L1 status in both archival and recent samples (PD-L1 [−/−] group) (median OS, 4.93 months; HR, 0.43; 95% CI, 0.20 to 0.93). According to multivariate analysis, PD-L1 positivity in any samples showed risk reduction in OS (HR, 0.31; 95% CI, 0.10 to 0.90; p = 0.031), regardless of other factors including age, sex, smoking status, histological subtype, EGFR mutation, number of prior chemotherapy regimens, and pre-treatment ECOG (Supplementary Table 3). There were no significant differences in progression-free survival (PFS) between the two groups (2.13 months vs. 1.07 months in the PD-L1 [+, any] and PD-L1 [−/−] groups, respectively; HR, 0.55; 95% CI, 0.30 to 1.03) (Fig. 1). When each of the four groups were compared separately, patients in the PD-L1 (−/+), PD-L1 (+/−), and PD-L1 (+/+) groups tended to have longer OS and PFS, but the differences were not statistically significant (Fig. 2). Using multivariate analysis, patients in the PD-L1 (−/+), PD-L1 (+/−), and PD-L1 (+/+) groups showed similar amounts of risk reduction in OS, but they were not statistically significant (Supplementary Table 4).
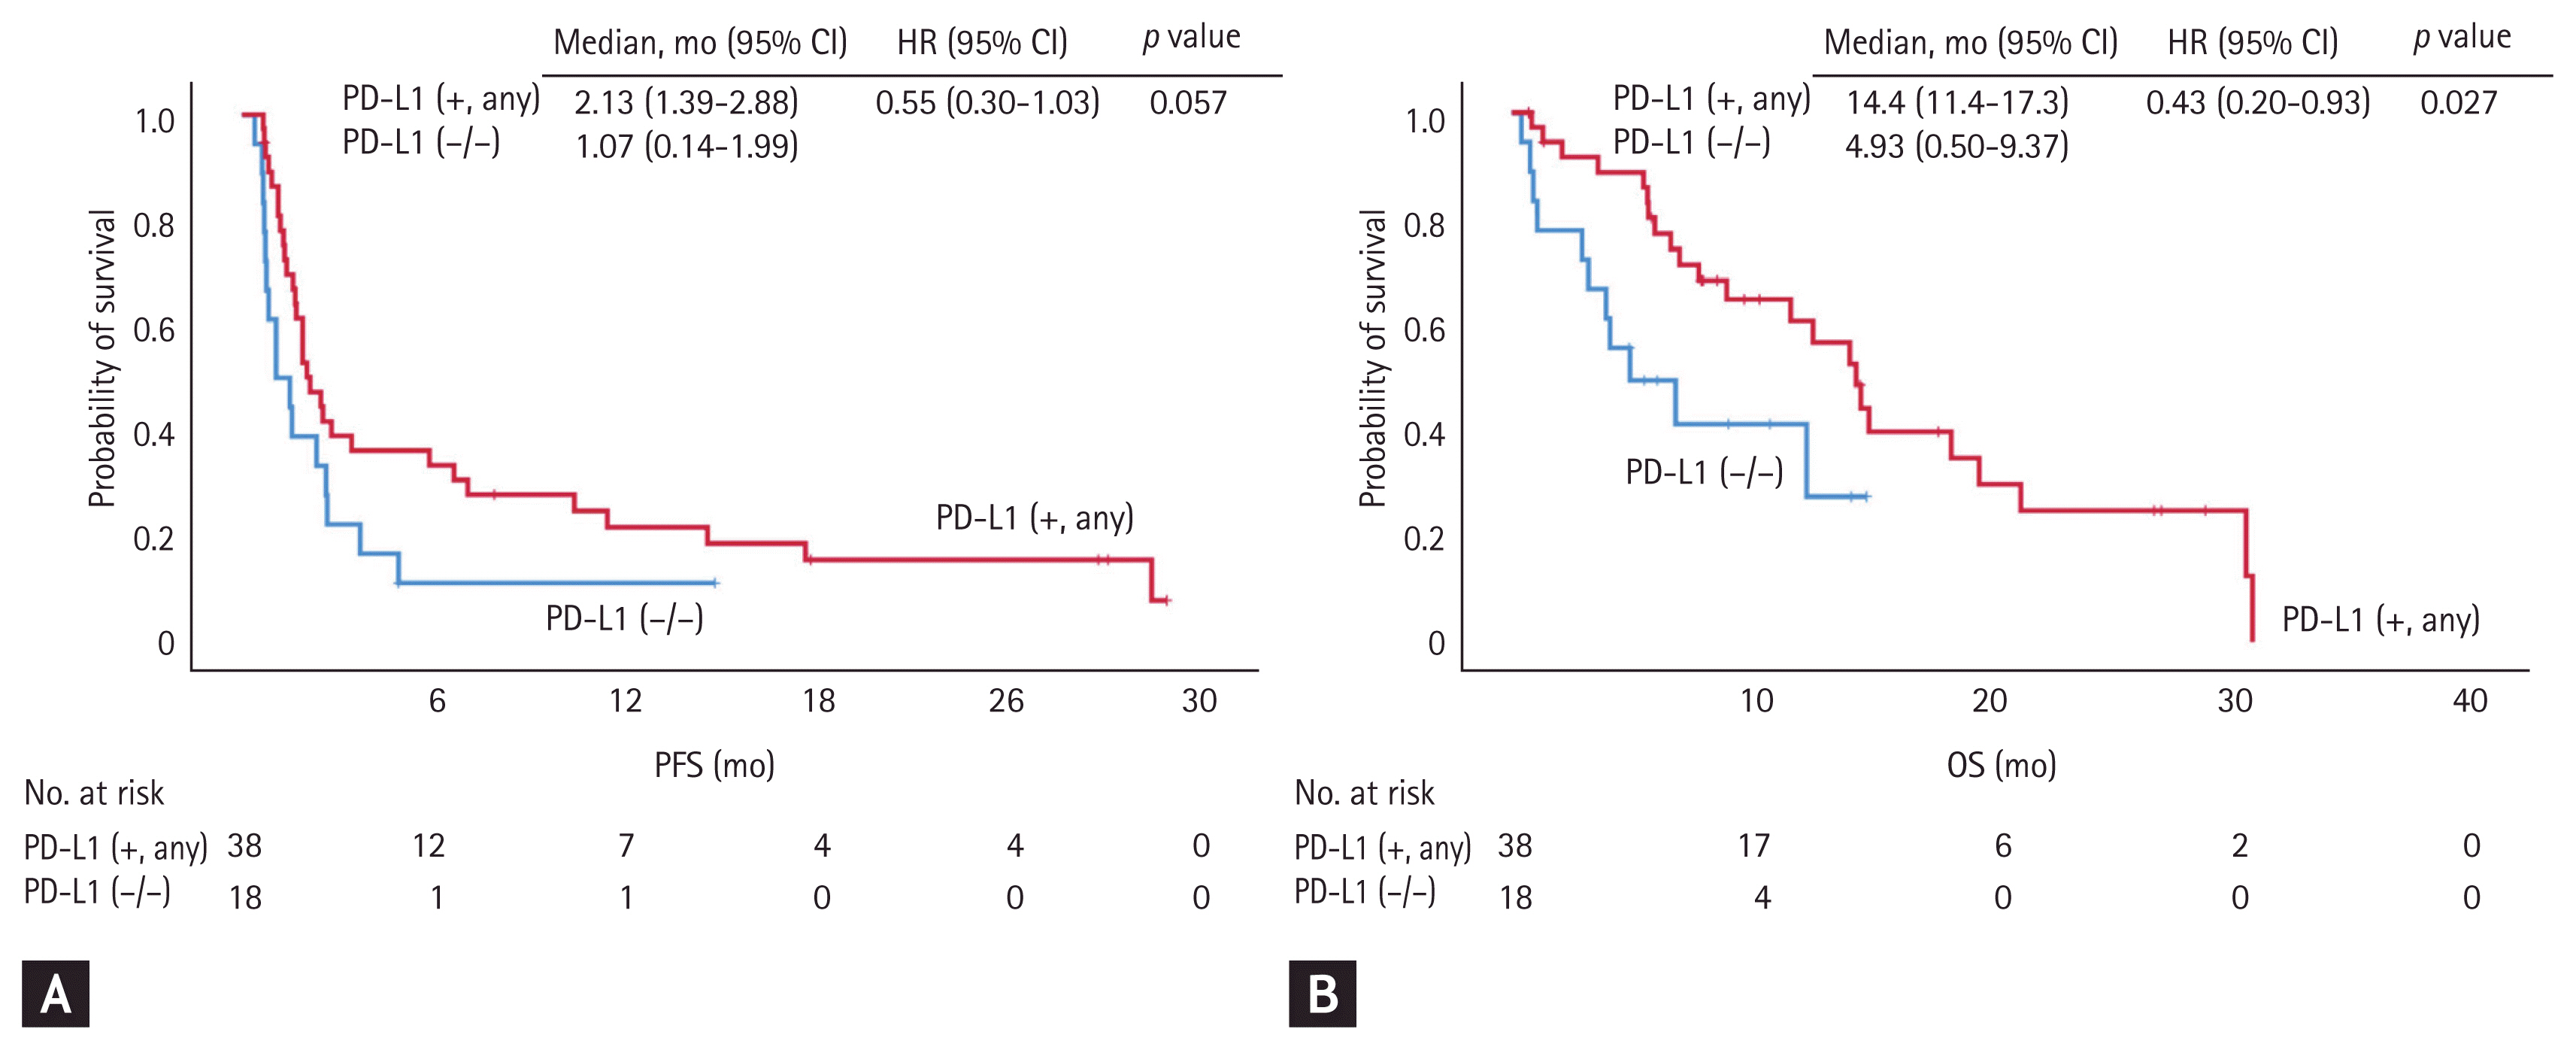
Comparison of responses to immune checkpoint inhibitors between patients with programmed death-ligand 1 (PD-L1) positivity in either archival or recent samples (PD-L1 [+, any] group) and those with negative PD-L1 status in both samples (PD-L1 [−/−] group). (A) The progression-free survival (PFS) was longer in the PD-L1 (+, any) group than in the PD-L1 (−/−) group (median PFS, 2.13 months vs. 1.07 months; hazard ratio [HR], 0.55; 95% confidence interval [CI], 0.30 to 1.03), but without statistical significance. (B) The overall survival (OS) was significantly longer in the PD-L1 (+, any) group than in the PD-L1 (−/−) group (median OS, 14.4 months vs. 4.93 months; HR, 0.43; 95% CI, 0.20 to 0.93).
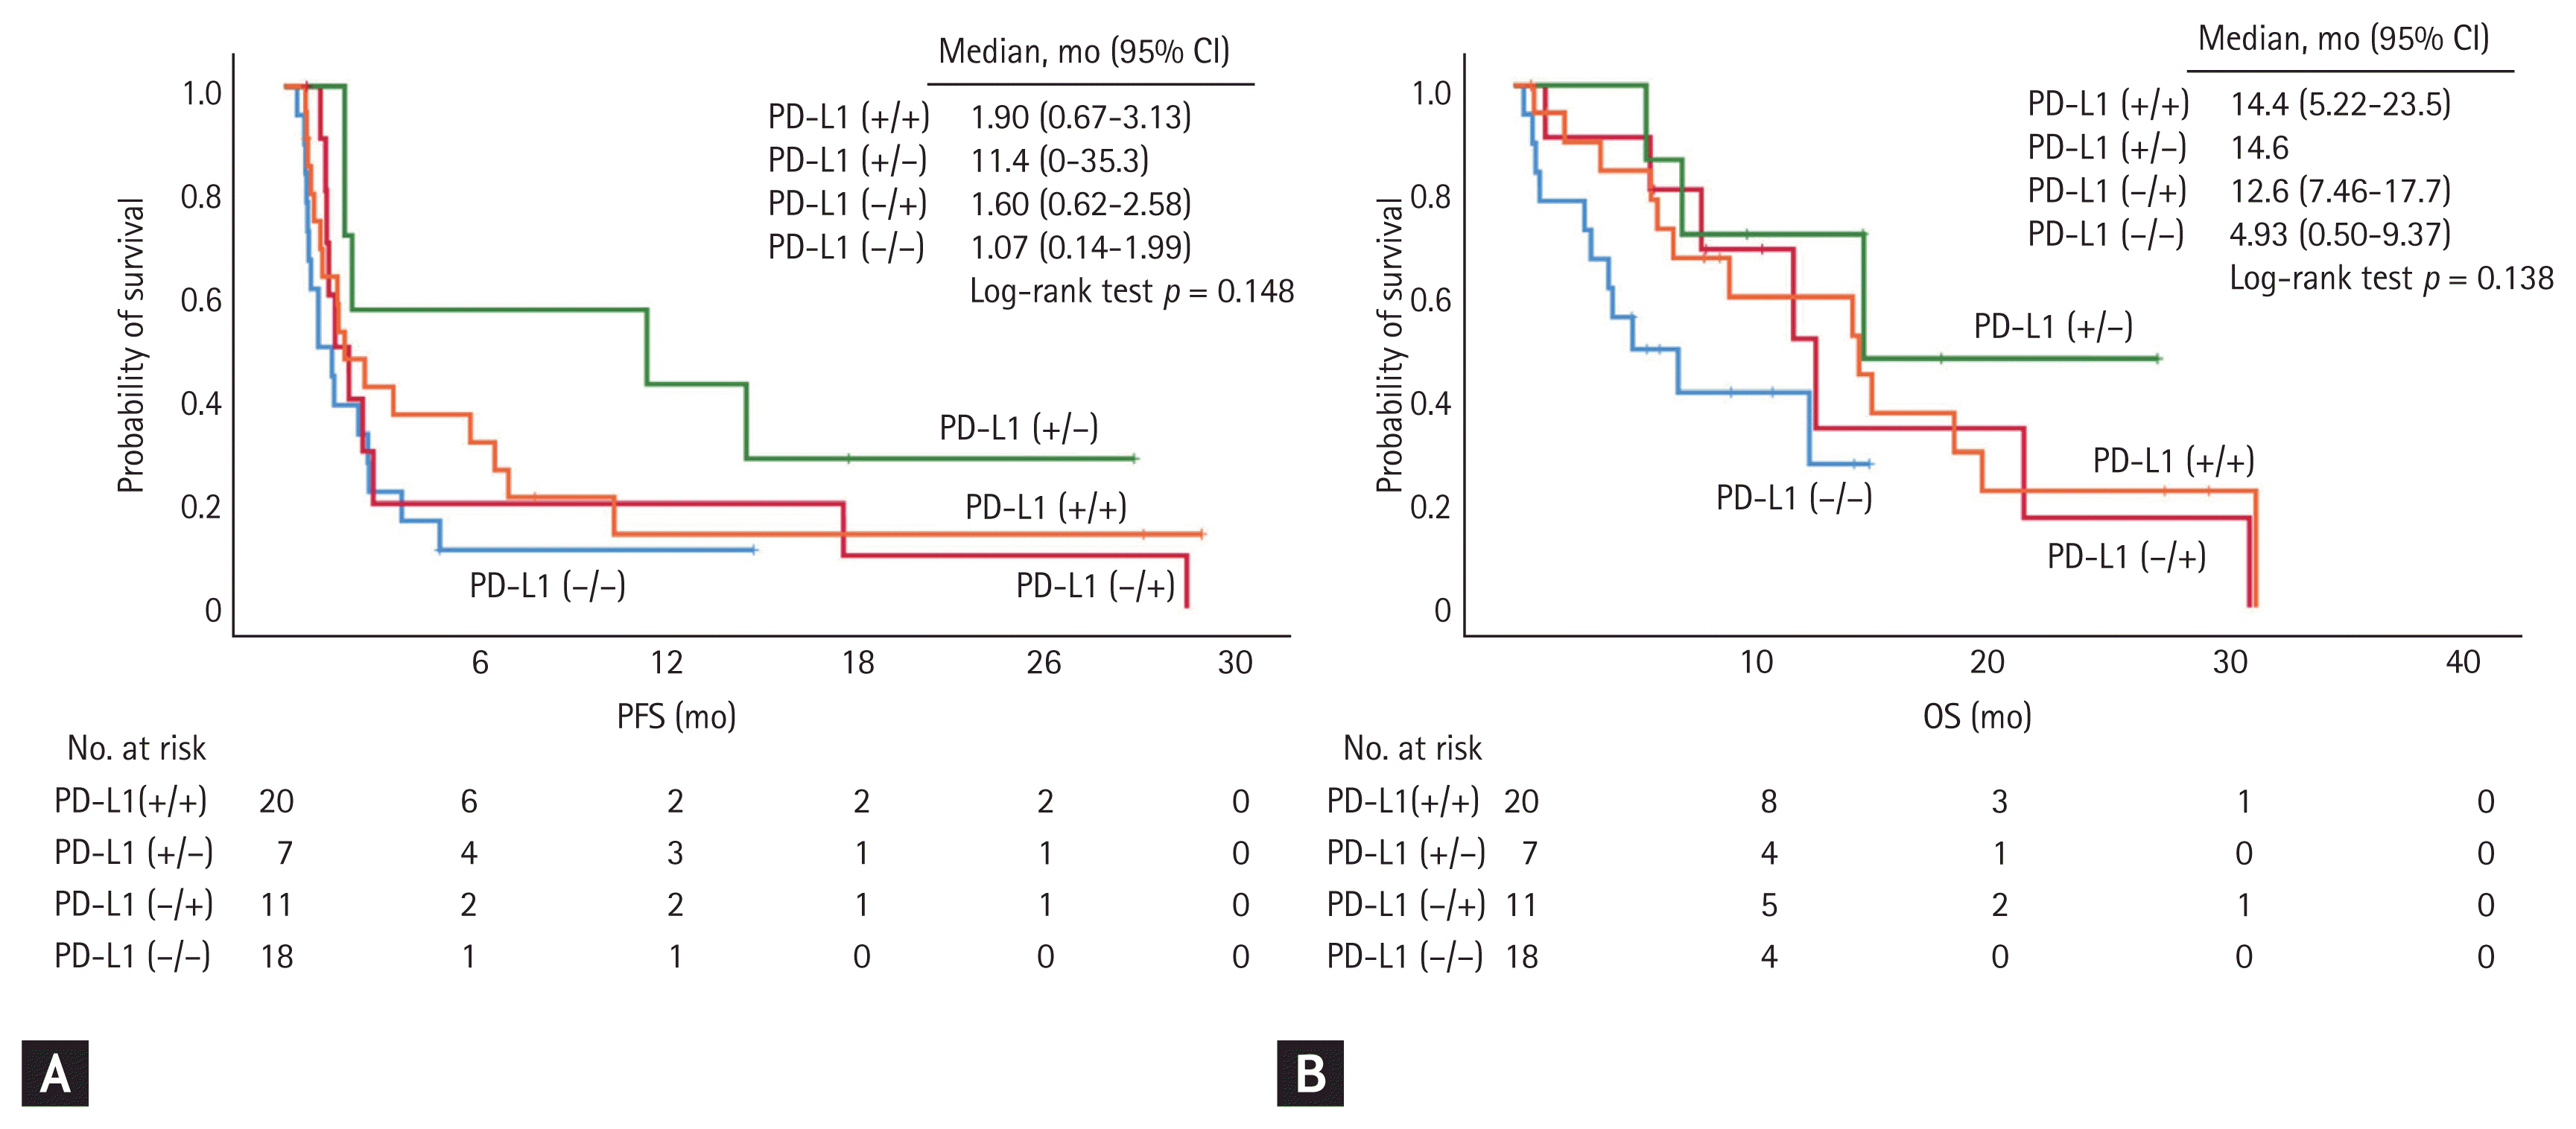
Comparison of responses to immune checkpoint inhibitors among patients in the four groups categorized according to the changes in programmed death-ligand 1 (PD-L1) expression. There were no significant differences in (A) progression-free survival (PFS) and (B) overall survival (OS) among patients in the four groups. CI, confidence interval.
In a comparison of patients according to PD-L1 positivity in the archival sample (pre-PD-L1 [+] group vs. pre-PD-L1 [−] group), the OS and PFS tended to be longer in the pre-PD-L1 (+) group, although there was no statistical significance (median OS, 14.6 months vs. 11.6 months [HR, 0.56; 95% CI, 0.28 to 1.13], median PFS 2.53 vs. 1.57 months [HR, 0.59; 95% CI, 0.33 to 1.06]) (Supplementary Fig. 2). There were no significant differences in the comparison of patients by PD-L1 positivity in the recent sample (post-PD-L1 [+] group vs. post-PD-L1 [−] group; median OS 14.1 months vs. 7.00 months [HR, 0.75; 95% CI, 0.37 to 1.53], median PFS 1.90 months vs. 1.90 months [HR, 0.94; 95% CI, 0.53 to 1.69]) (Supplementary Fig. 3).
DISCUSSION
In this study, when PD-L1 expression in archival and recent samples were compared, we found that 71.6% of patients with NSCLC maintained their PD-L1 status, whereas 28.4% showed changes in PD-L1 status, with 17.4% changing from PD-L1-negative to positive. In addition, patients showing PD-L1 positivity in any of the archival or recent samples had longer OS than those without PD-L1 positivity when they were given immune checkpoint inhibitors after failure of platinum-based therapy.
About one-fourth of patients showed changes in PD-L1 status over time, which could be attributed to several factors including actual changes in PD-L1 expression, intertumoral and intratumoral heterogeneity, and analytic variations generated from the use of different types of PD-L1 IHC assays. First, PD-L1 expression in tumor cells could actually change over time by innate and extrinsic mechanisms [15]. Previous studies have reported that PD-L1 expression could be up-regulated by EGFR mutation [16], EML4-ALK gene fusion [17], and other genetic alterations [18], and could change after anti-cancer treatment including chemotherapy [12,19,20], EGFR tyrosine kinase inhibitors [21], and radiotherapy [22] via the MAPK/ERK pathway [17,19] or JAK/STAT pathway [16]. Unfortunately, we found no significant differences in clinicopathologic characteristics between the PD-L1 (−/−) and PD-L1 (−/+) groups, although patients in the PD-L1 (−/+) group were more likely to have received taxane-based chemotherapy and radiotherapy between the two biopsy time points. Thus, further investigations are needed to elucidate the effect of chemotherapy on PD-L1 expression and its underlying mechanisms.
In addition, intertumoral and intratumoral heterogeneity could contribute to the observed differences in PD-L1 expression in paired samples. Several studies compared PD-L1 expression in whole surgical tissues and matched lung biopsies and reported discordance rates of PD-L1 positivity in the range of 14% to 43% [23–25]. Other studies showed that the extent of PD-L1 expression varied among tumor sites in more than negligible number of cases [26,27]. Such discrepancies from spatial heterogeneity possibly lead to misclassification of PD-L1 status and misguide to or against the use of anti-PD-1/PD-L1 inhibitors. In this study, the biopsy sites of paired samples were not matched because it is practically difficult to eliminate errors from intratumoral heterogeneity even if we only analyze archival and recent samples from the same sites. In addition, we believe that it is closer to actual clinical situations because determining target tissue of additional biopsy is usually dependent on the accessibility to the sites or the risk of the biopsy procedure rather than keeping the previous sites.
Moreover, the observed levels of PD-L1 expression are arguably dependent on the methods used to assess PD-L1 expression. Several kinds of IHC assays for assessing PD-L1 expression are now available, including 22C3, 28-8, SP142, and SP263. The Blueprint PD-L1 IHC Assay Comparison Project showed that 22C3, 28-8, and SP263 had similar analytic performances, although interchanging the assays and cut-off values could result in misclassification of PD-L1 status in some patients [28]. Subsequent cross-validation studies showed consistent results [29,30]; however, no gold standard assay has yet been established, which could accurately evaluate PD-L1 expression and predict the benefit of anti-PD-1/PD-L1 agents [13]. In addition, the threshold of PD-L1 positivity is a controversial issue because various criteria were used in clinical trials so far and none of them were recognized as a standard. Accordingly, we decided to choose one of the PD-L1 cut-off values from previous studies and set the PD-L1 positivity to 10%, derived from the pivotal study of nivolumab for nonsquamous lung cancer, which is supported by the observation that most of the patients (73.2%) who received immune checkpoint inhibitors eventually received nivolumab. Furthermore, analysis of the use of other PD-L1 cut-off values (1% or 20%) showed similar results with the PD-L1 cut-off value of 10%.
Despite limitations derived from temporal changes, spatial heterogeneity, and analytic variations, PD-L1 expression measured by IHC assays is the only clinically available and validated predictive biomarker of immune checkpoint inhibition to date. Accordingly, researchers have attempted to characterize the drawbacks of PD-L1 expression and address the problems that are currently being faced, one of which is the utility of archival samples in determining PD-L1 status instead of newly collected samples. One study addressed this issue and reported a good correlation of PD-L1 expression between archival and newly collected samples [11]. In addition, the updated analysis of the KEYNOTE-010 trial showed an OS benefit of pembrolizumab over docetaxel for both TPS ≥ 50% and ≥ 1%, regardless of whether archival or newly collected samples were used for the assessment of PD-L1 status [13]. Here, we found a relatively high degree of concordance (76.6%), and also demonstrated the predictive power of PD-L1 positivity in either archival or recent samples. These findings are consistent with previous studies and imply that archival samples could be used to determine PD-L1 status. This study has significance in that we assessed both the concordance rate of PD-L1 status and its predictive value independently of the age of samples in one group of patients.
This study has several limitations. We only assessed patients with paired biopsy samples, and this may not be representative of all the patients with NSCLC, considering that patients with negative PD-L1 status or non-responsiveness to prior chemotherapy are more likely to undergo additional biopsy with the evaluation of PD-L1 status. Moreover, it was difficult to observe statistically significant differences by changes in PD-L1 status with a relatively small number of patients. In addition, we utilized various available antibodies for IHC assays for assessing PD-L1 expression and set the threshold of PD-L1 positivity to 10%, which could result in misclassification of PD-L1 status in some patients. Future prospective studies with a larger number of patients using standardized assays for PD-L1 expression and valid cut-off values of PD-L1 positivity will help us better understand the predictive value of PD-L1 expression and the effect of temporal changes.
In conclusion, PD-L1 status changed in about one-fourth of patients when archival and recent tumor samples were compared; and PD-L1 positivity in either archival or recent samples was predictive of better responses to immune checkpoint inhibitors. Therefore, archival samples could be used to assess PD-L1 status, and new biopsies should be considered in selected patients who are likely to benefit from additional biopsy, particularly those with negative PD-L1 status in archival samples.
KEY MESSAGE
Programmed death-ligand 1 (PD-L1) status changed in about one-fourth of patients when comparing archival and recent tumor samples.
PD-L1 positivity in either archival or recent samples was predictive of better responses to immune checkpoint inhibitors.
Archival samples could be used to assess PD-L1 status and whether to obtain new biopsies should be decided on a patient-by-patient basis.
Supplementary Information
Supplementary Table 1.
The usage of various kinds of IHC assays for the assessment of PD-L1 expression
Supplementary Table 3.
Multivariate analysis of overall survival after the administration of immune checkpoint inhibitor considering PD-L1 any positivity
Supplementary Table 4.
Multivariate analysis of overall survival after the administration of immune checkpoint inhibitor considering four different PD-L1 status
Supplementary Figure 1.
Overall survival (OS) of patients in four groups categorized according to changes in programmed death-ligand 1 (PD-L1) expression. (A) There was no significant difference in the OS, calculated from the date of advanced diagnosis, among patients in the four groups (p = 0.172). (B) There was no significant difference in the OS, calculated from the date of initial diagnosis, among patients in the four groups (p = 0.326). CI, confidence interval.
Supplementary Figure 2.
Comparison of responses to immune checkpoint inhibitors between patients with programmed death-ligand 1 (PD-L1) positivity in archival samples (pre-PD-L1 [+] group) and those with PD-L1 negativity in archival samples (pre-PD-L1 [–] group). There were no significant differences in (A) progression-free survival (PFS) and (B) overall survival (OS) between the two groups. HR, hazard ratio; CI, confidence interval.
Supplementary Figure 3.
Comparison of responses to immune checkpoint inhibitors between patients with programmed death-ligand 1 (PD-L1) positivity in recent samples (post-PD-L1 [+] group) and those with PD-L1 negativity in recent samples (post-PD-L1 [–] group). There were no significant differences in (A) progression-free survival (PFS) and (B) overall survival (OS) between the two groups. HR, hazard ratio; CI, confidence interval.
Notes
No potential conflict of interest relevant to this article was reported.
Acknowledgements
This study was supported by a grant of the Korea Health Technology R&D Project “Strategic Center of Cell and Bio Therapy for Heart, Diabetes & Cancer” through the Korea Health Industry Development Institute (KHIDI), funded by the Ministry of Health & Welfare (MHW), Republic of Korea (grant number: HI 17C 2085).