Association of serum free thyroxine and glucose homeostasis: Korea National Health and Nutrition Examination Survey
Article information

Abstract
Background/Aims
Thyroid hormones are involved in wide range of glucose metabolism functions. Overt thyroid dysfunctions are related to altered glucose homeostasis. However, it is not conclusive as to whether subtle changes in thyroid hormones within normal ranges can induce alterations in glucose homeostasis. The aim of this study was to evaluate the association between thyroid hormone and glucose homeostasis parameters in subjects without overt thyroid dysfunction based on nationwide population data.
Methods
In the Sixth Korea National Health and Nutrition Examination Survey 2015 (n = 7,380), data were collected from subjects with insulin and thyroid function measurements who were older than 19-years-old. After the exclusion of 5,837 subjects, a total of 1,543 patients were included in the analysis. Subjects were categorized into the quartiles of the free thyroxine (FT4). Fasting glucose, insulin, homeostatic model assessment of insulin resistance and hemoglobin A1c (HbA1c) levels were considered to be glucose homeostasis parameters.
Results
Subjects with the highest FT4 quartile showed significantly lower fasting insulin and HbA1c levels. A significant inverse correlation FT4 and HbA1c levels was observed (β = –0.261, p = 0.025). In the logistic regression analysis, the highest quartile of FT4 was demonstrated to lower the risk of HbA1c to a greater degree than the median by approximately 40%, after adjusting for confounders, compared to the lowest quartile (p = 0.028).
Conclusions
We demonstrated subjects with a lower FT4 quartile exhibited high risk of HbA1c levels above the median value in a representative Korean population. Subjects with the lowest FT4 quartile should be cautiously managed in terms of altered glucose homeostasis.
INTRODUCTION
Glucose homeostasis reflects a balance between glucose production and peripheral glucose utilization. It refers to the process of maintaining blood glucose at a steadystate level [1]. The maintenance of normal glucose homeostasis requires a complex and highly integrated interaction among the liver, muscles, adipocytes, pancreas, neurotransmitters, and kidneys [2]. Several parameters reflect the status of glucose homeostasis. Fasting plasma glucose and insulin, which is a potent regulator of glucose homeostasis [3], are basic reflectors of glucose homeostasis. The homeostatic model assessment (HOMA) is a method for assessing β-cell function and insulin resistance based on fasting glucose, insulin, or C-peptide concentrations. The HOMA of insulin resistance (HOMA-IR) yields estimates of insulin sensitivity from fasting plasma glucose and insulin concentrations and is commonly used to evaluate insulin resistance and metabolic status [4]. Hemoglobin A1c (HbA1c) is well recognized and widely used for assessing the glycaemic control status [5]. It represents a 2 to 3 month mean of serum glucose concentrations and is a useful screening tool for type 2 diabetes [6]. HbA1c is also a reliable marker for insulin resistance in normal, glucose tolerant adults [7].
Thyroid hormones serve an important role in regulating glucose metabolism. The liver [8-10], adipose tissue [8], skeletal muscle [11], and pancreas [12] are under the influence of thyroid hormone action. Many studies have elucidated the relationship between thyroid hormones and glucose homeostasis [10,13-15]. It is generally accepted that thyroid hormones have significant effects on glucose homeostasis and insulin resistance [9]. An alteration in glucose homeostasis is associated with overt thyroid dysfunction [16]. However, data on how glucose homeostasis changes in response to subtle thyroid hormone alterations are not yet consistent. Several studies have assessed the association between thyroid dysfunction and glucose homeostasis, but the data are conflicting [14,15,17]. Recently, Kim et al. [18] reported that HbA1c levels were high in non-diabetic patients with overt hypothyroidism, but only 45 patients were analysed. Thus, we investigated whether changes in thyroid hormones within normal ranges could affect glucose homeostasis parameters based on data from the latest nationally representative epidemiological survey (the Sixth Korea National Health and Nutrition Examination Survey [KNHANES VI]).
METHODS
Study population
The KNHANES VI was performed by the Korea Centers for Disease Control and Prevention (CDC) and comprised a health interview survey, a health examination survey, and a nutrition survey by using a stratified, multistage, probability sampling design. Informed written consent for participation was obtained from all of the study subjects. In addition, the study was approved by the Catholic University of Korea, Catholic Medical Center, Seoul St. Mary's Hospital Institutional Review Board (KC20ZISI0409). Of the 7,380 Korean participants, 1,435 individuals aged < 19 years were excluded. Subjects who were pregnant (n = 6), who had a history of treatment for either thyroid disease (n = 36) or diabetes (n=102), and for whom insufficient free thyroxine (FT4) data were available or FT4 was not within the normal range (n = 3,992) were also excluded. Additionally, subjects were excluded if they did not maintain a fasting state of more than 8 hours before blood sampling (n = 46). Finally, 220 subjects were excluded who did not complete all of the required tests that were presented by the CDC. Ultimately, 1,543 participants were eligible for this study.
Measurements
All of the measurements and questionnaires were collected by specially trained investigators. Detailed anthropometric measurements were performed according to previous studies [19-21]. Height and body weight were measured as part of the health examination for each subject. Body mass index (BMI) was calculated from the measured height and weight values. The BMI values of subjects were categorized as underweight (< 18.5 kg/m2), normal weight (≥ 18.5 and < 23 kg/m2), overweight (≥ 23 and < 25 kg/m2) or obese (≥ 25 kg/m2). Serum creatinine, thyrotropin (TSH), FT4, anti-thyroid peroxidase antibody (TPO Ab), glucose, HbA1c, and insulin levels were measured from sampled blood that was collected after 8 hours of overnight fasting. TSH levels were measured by using an E-TSH kit (Roche Diagnostics, Basel, Switzerland), for which the reference range was 0.35 to 5.50 µIU/mL. FT4 levels were measured by using an E-Free T4 kit (Roche Diagnostics, Basel, Switzerland) for which the reference range was 0.89 to 1.76 ng/mL. TPOAb levels were measured by using an E-Anti-TPO kit (Roche Diagnostics, Basel, Switzerland); the normal range for TPOAb in humans is < 34.0 IU/mL. Serum creatinine levels were measured by using a Hitachi Automatic Analyzer 7600-210 (Hitachi, Tokyo, Japan), and the iodine intake status was evaluated by using the urine iodine creatinine ratio (UICR) determined using inductively coupled plasma mass spec trometry (PerkinElmer; Waltham MA, USA). Insulin levels were measured by using a gamma-counter (1470 WIZARD gamma-counter, PerkinElmer, Turku, Finland) with an immunoradiometric assay (INS-IRMA, Biosource, Nivelles, Belgium). Fasting plasma glucose levels were measured by using a Hitachi Automatic Analyser 7600. HbA1c levels were measured by using high-performance liquid chromatography (HLC-723G7; Tosoh, Tokyo, Japan). The smoking statuses of subjects were classified as either non-smokers or current smokers. Physical activity was categorized into two groups: the regular physical activity group (exercised for ≥ 20 min/session, ≥ 5 sessions/week; moderate exercise for ≥ 30 min/session ≥ 5 sessions/week; or walking for ≥ 30 min/session, ≥ 5 sessions/week) or the non-regular physical activity group. We calculated the HOMA-IR as (fasting serum insulin [µIU/mL] x fasting plasma glucose [mmol/L] / 22.5) [22].
Statistical analysis
Statistical analyses were performed by using SAS version 9.3 (SAS Institute, Cary, NC, USA). A p values < 0.05 were considered to be statistically significant. Continuous variables are expressed as numbers and percentages or as means ± standard deviations and compared by t tests. Discrete variables are presented as number (%) and compared by Rao-Scott chi-squared tests. Multivariable adjusted logistic regression analysis was conducted to determine odds ratios (ORs) and 95% confidence intervals (CIs). In a logistic regression analysis, Model 1 was the age and sex adjusted model, whereas Model 2 was the model that was adjusted by age, sex, BMI, smoking status, physical activity, anti-TPO Ab levels, TSH levels, and urine iodine levels. Because of the complex sampling design, a sampling weight method was used to assign the participants as being representative of the Korean population for the analysis of the data. The detailed characteristics of the statistical analysis of the KNHANES have been previously reported [19-21].
RESULTS
Baseline characteristics according to the FT4 quartiles
The baseline characteristics of the 1,543 participants were analysed, as were age, sex, BMI, smoking status, physical activity, income, TPOAb levels, and UICR quartiles according to FT4 quartile (Table 1). With lower FT4 quartiles, higher ages and BMIs were observed (p for the trend < 0.001 and p for the trend = 0.027, respectively). The proportion of males was observed to be higher in the highest FT4 quartiles. Subjects with the lowest FT4 quartiles exhibited higher TPOAb positivity (≥ 34 IU/mL) than other subjects. With lower FT4 quartiles, it was observed that more subjects belonged to the higher UICR quartiles (p < 0.001). No differences in smoking status or physical activity were observed by FT4 quartile.
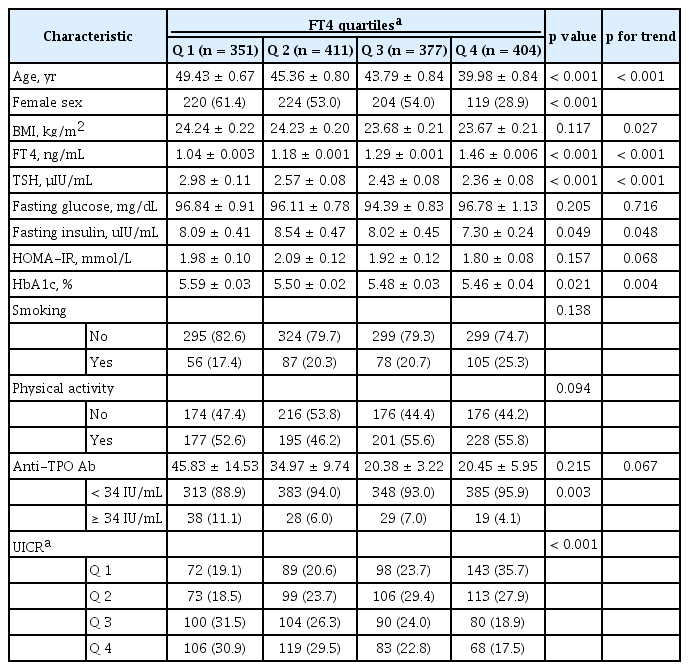
Baseline characteristics of study subjects
The association of FT4 with variables related to glucose homeostasis
In the study population, the median values for fasting glucose, fasting insulin, HOMA-IR, and HbA1c levels were 92.88 mg/dL, 6.27 µIU/mL, 1.47, and 5.39%, respectively (Supplementary Table 1). As shown in Table 2, fasting insulin levels were significantly decreased with increasing FT4 quartiles. HbA1c levels were also significantly lowered with increasing FT4 quartiles. Subjects with HbA1c levels less than the median value became more prevalent as the FT4 quartile increased (Table 2). In addition, it was observed that the risks of exceeding the median value of HbA1c (5.39%) significantly decreased as the FT4 quartile increased (Table 3). In a regression analysis, only the HbA1c levels exhibited a significant inverse correlation with FT4 (β = –0.261, p = 0.025) (Supplementary Table 2). The OR (95% CI) for HbA1c levels above the median value were 0.75 (0.50 to 1.12) in Q2, 0.69 (0.46 to 1.03) in Q3, and 0.61 (0.40 to 0.95) in Q4 (p for the trend < 0.001). However, in the analysis of fasting glucose, fasting insulin, and HOMA-IR levels, no significant risk increases according to FT4 quartile were observed.
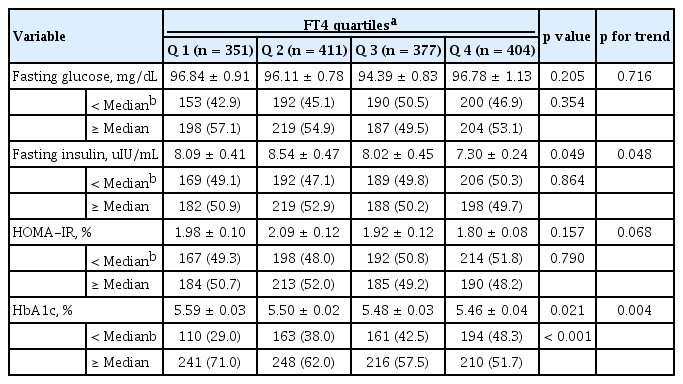
The relevance of FT4 quartiles to parameters related to glucose homeostasis

Logistic regression analysis of variables according to free thyroxine quartiles
DISCUSSION
In this population-based study, we observed a significant negative correlation between FT4 and HbA1c levels. However, no significant associations of FT4 with other glucose homeostasis parameters, such as fasting glucose, insulin, and HOMA-IR levels, were observed. As the study aimed to evaluate the association of thyroid hormone and glucose metabolism, subjects with diabetes, who may have multiple factors influencing glucose homeostasis, were excluded. Additionally, subjects with overt thyroid dysfunctions, which could lead to pathologic alterations in metabolism were excluded. Thus, relatively healthy subjects were included in the study. Our results may demonstrate the summation of the complex effects of thyroid hormone on glucose homeostasis, which were revealed at the molecular level in healthy subjects.
Thyroid hormones are important determinants of glucose and lipid metabolism [13,23]. Thyroid hormones act on glucose homeostasis in various peripheral organs particularly the pancreas, muscle, adipose tissue, and liver [24], and thyroid hormones also exert central effects [25]. In particular, the roles of thyroid hormones in peripheral tissues have been extensively studied at the molecular level. For example, thyroid hormones regulate several key molecules in gluconeogenesis, such as phosphoenolpyruvate carboxykinase [26] and glucose-6-phosphatase [27]. Alanine transport and its conversion to glucose in the liver were observed to be increased by thyroid hormones [28]. These hormones also contribute to hepatic insulin resistance, mainly via carbohydrate-response element-binding protein (ChREBP) [29]. Conversely, it also exerts effects on glucose consumption. T3 was observed to increase the glycolytic capacity via the regulation of the expression levels of several proteins, such as glucose transporter type 4 (GLUT-4) [30] and nicotinamide adenine dinucleotide phosphate (NADP)-dependent malic enzyme [31] in skeletal muscles. As physiological levels of thyroid hormone have been observed to exert protective effects on pancreas islets [32], thyroid hormones may favourable roles, in terms of lowering glucose levels. Alterations in glucose homeostasis in hyper- and hypothyroidism have been well summarized in a previous review article [16]. As suggested in many molecular studies, it has been definitively proven that thyroid hormones are associated with glucose homeostasis. However, as thyroid hormones serve important roles in both glucose production and consumption, it is difficult to expect whether high or low normal ranges of thyroid hormones are associated, or not associated, with favourable glucose homeostasis.
Overt thyroid dysfunction is associated with atherosclerotic cardiovascular disease, and it has been extensively reviewed [33-35]. In hyperthyroidism, impaired glucose tolerance may be the result of hepatic insulin resistance, whereas hypothyroidism may be the result of insulin resistance of peripheral tissues [9]. Hyperthyroidism is one of several reversible causes of hyperglycaemia and is recognized to be associated with increased gluconeogenesis, increased rates of glucose absorption, and a decreased insulin half-life [35-37]. Maratou et al. [38] suggested that patients with overt hypothyroidism present with decreased levels of insulin-stimulated glucose transport in monocytes due to the disrupted translocation of the glucose transporter 4, which is responsible for glucose utilization. The development of insulin resistance in hypothyroidism is also associated with a decreased rate of blood flow in peripheral tissues, as Dimitriadis et al. [39] has previously described.
Subclinical thyroid dysfunction is associated with changes in glucose homeostasis [9]. HOMA-IR levels were significantly higher and a positive correlation between TSH and HOMA-IR levels was observed in a subject with subclinical hypothyroidism [40]. Al Sayed et al. [41] reported that increased insulin resistance was evident in subclinical hypothyroidism, but HOMA-IR levels were not significantly different from those of euthyroid subjects. Maratou et al. [42] suggested that this effect was attributed to the impaired translocation of GLUT-4 transporters in adipose tissue and muscle. Insulin resistance and impaired glucose tolerance are also observed in case of subclinical hyperthyroidism [38,43]. The sensitivity of glucose metabolism to insulin in a patient with subclinical hyperthyroidism was demonstrated to be lower than the sensitivity of glucose metabolism in a euthyroid subject [38]. Rezzonico et al. [43] reported that both exogenous and endogenous subclinical hyperthyroidism can lead to increased insulin resistance. The mechanism involved in this underlying pathophysiology is not yet known.
Whether subtle changes in FT4 levels within the euthyroid range alter glucose homeostasis has not yet been fully elucidated. Previously, Roos et al. [14] have demonstrated that fasting glucose and insulin levels were significantly related to lower FT4 levels in the analysis of 2,703 euthyroid subjects. In contrast to our study, Roos et al. [14] reported that HOMA-IR levels were correlated with low FT4 levels. This contrasting result may be explained by the fact that age was not adjusted for in their analysis. Serum FT4 levels generally tend to decrease with age [44]; therefore, the correction for age is important. In the Iranian study by Mehran et al. [45], FT4 levels in the euthyroid range were negatively correlated with HOMA-IR levels even after adjusting for age; however, the baseline BMI values of subjects were higher than those in our study. It was assumed that insulin resistance was slightly higher in the baseline subjects. In the Turkish study by Tarcin et al. [46], HOMA-IR levels were not correlated with FT4 levels, which was consistent with our results. The results cannot be generalized because there may be differences between the studies, depending on ethnicities and areas of residency. In the Chinese study by Lin et al. [47], BMI values and triglyceride levels were negatively correlated with FT4 levels in euthyroid subjects; however, no analyses of HOMA-IR and HbA1c levels were made. Kim et al. [48] analysed 44,196 Korean population individuals and reported that fasting glucose levels were positively correlated with FT4 levels. This is different from our results, which is possibly due to the different exclusion criteria that were used between the two studies. In the present study, we excluded subjects with known case of diabetes mellitus (n = 102). Moreover, there was no analysis related to insulin resistance in the study by Kim et al. [48].
HbA1c levels have been widely used as an indicator of insulin resistance and for monitoring the degree of glucose control. They are also used as a surrogate marker of metabolic syndrome [49,50]. As with other indicators reflecting metabolic status, changes in HbA1c levels have also been reported to be associated with overt thyroid dysfunction. Overt hypothyroidism was associated with higher HbA1c levels in non-diabetic patients, but only 45 subjects were analysed [18]. Christy et al. [51] found that HbA1c levels to be higher in patients with hypothyroidism, but this study included patients with anaemia. Other population-based studies have demonstrated the association between dysglycaemia and FT4 levels, but not with HbA1c levels [44,52]. Our study is the first community-based study that investigated the association of HbA1c levels with FT4 levels in euthyroid healthy subjects. As HbA1c levels reflect the current glucose metabolism status regardless of different underlying mechanisms of disruptions in glucose homeostasis, it is a good clinical surrogate marker to initiate interventions for glucose control. Previous studies have demonstrated that low FT4 levels are associated with several metabolic components in the euthyroid state. In addition, our study confirms that low FT4 levels are associated with higher HbA1c levels. In this regard, it is thought that a preliminary prediction of glucose metabolism is possible by confirming HbA1c levels when lower FT4 levels and metabolic syndrome are accompanied in euthyroid subjects.
A limitation of this study was its cross-sectional design, which indicates that causality cannot be proven. The use of medications, the detailed histories of treatments, and the presence of medical illnesses, including thyroid disease or other illnesses were self-reported. However, the KNHANES is a confidence study, and this study is credible because specially trained investigators participated in the interviews. Another limitation was related to the interpretation of HbA1c levels. HbA1c levels may be measured at either falsely high or falsely low degree when the erythrocyte life span is changing. HbA1c levels would be more accurately interpreted if the erythrocyte span was reflected. However, when considering the domestic overall prevalence of haematologic malignancies [53], the effect of erythrocyte condition is not expected to be significant in this healthy study population. In conclusion, we demonstrated subjects with a lower FT4 quartile exhibited high risk of HbA1c levels above the median value in a representative Korean population. In contrast, each parameter that is known to be involved in glucose homeostasis, such as fasting glucose, insulin, or HOMA-IR levels was not significantly related to FT4 quartile. Together with previous findings, lower FT4 levels in the euthyroid range may be associated with altered or adverse glucose homeostasis. These findings are also related to increased cardiovascular risk in overt hypothyroidism or subclinical hypothyroidism. Future large cohort studies are needed, with sufficient follow-up periods, to determine the effects of thyroid hormones on the development of unfavourable clinical outcomes, such as cardiovascular or metabolic diseases.
KEY MESSAGE
1. Subjects with a lower free thyroxine (FT4) quartile exhibited high risk of hemoglobin A1c levels above the median value in a representative Korean population.
2. Together with previous findings, lower FT4 levels in the euthyroid range may be associated with altered or adverse glucose homeostasis.
Notes
No potential conflict of interest relevant to this article was reported.
Acknowledgements
This work was supported by National Research Foundation Basic Research in Science & Engineering Individual Research Program (NRF-2017R1D1A1B03030159). Also, the authors wish to acknowledge the financial support of the Catholic Medical Center Research Foundation made in the program year of 2018. The consultation for statistical analysis was supported by a grant from the Korea Health Technology R&D Project through the Korea Health Industry Development Institute, funded by the Ministry of Health and Welfare, Republic of Korea (Grant number: HI14C1062).