Association of body composition with disease activity and disability in rheumatoid arthritis
Article information

Abstract
Background/Aims
To explore the associations between body composition and pain, disease activity, and disability in rheumatoid arthritis (RA).
Methods
The study enrolled 335 patients with RA and underwent body composition measurement with an InBody analyzer. The associations of body mass index (BMI), body fat mass, and skeletal muscle mass with disease activity score in 28 joints (DAS28), an index derived to measure the subjective component of DAS28 (DAS28-P), a pain visual analogue scale (VAS), and disability measured with the health assessment questionnaire (HAQ) were explored. Obesity was defined as BMI ≥ 25 kg/m2.
Results
The median (interquartile range) disease duration was 6 years (3.5 to 9) and the mean DAS28 score was 3.6 ± 1.1. The mean BMI was 23.6 ± 3.6 kg/m2 and 109 patients (32.5%) were obese. Compared with non-obese patients, obese patients had a higher C-reactive protein (1.68 mg/dL vs. < 0.1 mg/dL, p = 0.013), higher pain VAS score (40 vs. 35, p = 0.031), and higher DAS28-erythrocyte sedimentation rate score (3.75 ± 1.18 vs. 3.46 ± 1.11, p = 0.031). In multivariate regression analysis, the DAS28 score in females was positively associated with the current steroid dose, body fat mass, and HAQ score, while the HAQ score in females was associated with older age, DAS28, lower skeletal muscle mass, and higher body fat/skeletal muscle ratio. In the multivariate regression analysis, the DAS28-P score in females was positively associated with body fat/skeletal muscle ratio and HAQ.
Conclusions
Body composition, such as the body fat mass and body fat/skeletal muscle ratio, is significantly associated with disease activity and disability in female RA patients.
INTRODUCTION
Rheumatoid arthritis (RA) is a chronic inflammatory arthritis characterized by the involvement of multiple joints and significant disability. RA is associated with considerable changes in body composition, the lipid profile, adipokine levels, and insulin sensitivity [1]. RA patients had a lower lean mass and higher body fat mass than healthy people, which is called rheumatoid cachexia [2]. The decrease in lean mass and increase in truncal fat mass in RA can lead to negative metabolic consequences, including insulin resistance, diabetes, hypertension, and cardiovascular disease (CVD) [3,4]. Obesity is also associated with the abnormal expression of cytokines and adipokines (e.g., tumor necrosis factor α [TNF-α], interleukin 6 [IL-6], adiponectin, and leptin), which leads to systemic inflammation [5]. These results suggest that changes in body fat composition are not only the result of decreased physical activity due to RA but may also aggravate the inflammation and co-morbidities. A recent meta-analysis reported an association between a high body mass index (BMI) and greater disease activity, as well as lower odds of achieving remission in RA [6,7]. In addition, obese RA patients have worse pain scores than non-obese patients [6,8,9]. These studies mainly included Caucasian patients who have significant differences in BMI and body composition compared with Asians. Moreover, most of the previous work analyzed the relationship between BMI and disease activity without accounting for body composition. To our knowledge, the relationship between BMI or body composition and disease activity has been scarcely reported in Asian patients. In previous research on the relationship between fat mass and pain in RA, thigh fat measured by quantitative computed tomography (CT) was significantly associated with a higher health assessment questionnaire (HAQ) score and lower short Form 36 health survey physical functioning score [4].
Therefore, in this study, we explored the associations of RA disease activity, pain, and HAQ score with BMI, body fat mass, and muscle mass. We hypothesized that a higher fat mass would be associated with RA disease activity, disability, and pain.
METHODS
This study was cross sectional and enrolled patients diagnosed with RA who met the 1987 or 2010 American College of Rheumatology criteria and visited the Rheumatology Clinic of Hallym University Sacred Heart Hospital (Anyang, Korea) from January 2016 to March 2017. On the same day, disease activity was evaluated with the Disease Activity Score 28 (DAS28) and body composition was measured with an InBody 720 analyzer (InBody, Seoul, Korea). The study and use of patient data were approved by the Ethics Committee of Hallym University Medical Center (approval no.: HALLYM 2018-03-028-001). Because this study used data collected retrospectively in the course of usual care, the need for patient consent was waived. Clinical data, such as age, sex, disease duration, and medications (glucocorticoids), were retrieved from the electronic medical records. Laboratory data collected included the C-reactive protein (CRP) level, erythrocyte sedimentation rate (ESR), rheumatoid factor (RF) positivity, and anti-citrullinated protein antibody (anti-CCP) positivity. RF and anti-CCP positivity were measured at the first clinic visit. Pain and functional status were evaluated with a pain visual analogue scale (VAS) and the health assessment questionnaire (HAQ). Co-morbidity health information was self-reported and included hypertension (HTN), and diabetes mellitus. The DAS28-P score, which measures the contribution of patient-reported subjective components within the DAS28, was obtained together with the DAS28-ESR [10]. Previously, we found that RA patients with high DAS28-P scores were less likely to achieve good European League Against Rheumatism responses 6 months after treatment initiation and tended not to be classified as good responders despite the normalization of objective measures [11].
The DAS28-ESR and DAS28-P scores were calculated using the following formulas.
DAS28-ESR = 0.56 × sqrt (Tender) + 0.28 × sqrt (Swollen) + 0.70 × ln (ESR) + 0.014 × (VAS)
DAS28-P score = [0.56 × sqrt (Tender) + 0.014 × (VAS)] / 0.56 × sqrt (Tender) + 0.28 × sqrt (Swollen) + 0.70 × ln (ESR) + 0.014 × (VAS)
Body mass index (BMI) was calculated as weight in kilograms divided by height in meters squared, and categorized as non-obese (BMI < 25) or obese (BMI ≥ 25). The body composition measurements included body fat mass (kg), skeletal muscle mass (kg), and the fat/skeletal muscle mass ratio.
Statistical analysis
Data with normal distributions were reported as the mean ± SD and as the median (interquartile range [IQR]) otherwise. We compared two groups using the Mann-Whitney U test for continuous data and the chi-square test for categorical data. Linear or ordinal logistic regressions were constructed separately by gender. The DAS28 and DAS28-P scores showed normal distributions, so linear regression analysis was applied. For multivariate models in linear regression, the backward selection method was used. Since the correlation coefficient between BMI and body fat mass was high (r = 0.74), we chose fat mass over BMI for the multivariate regression analysis when both BMI and body fat mass showed significant correlations. Because the pain VAS and HAQ score did not follow normal distributions, we divided them into tertiles for regression analysis. Ordinal logistic regression was applied. Multivariate models were constructed with covariates carried over from univariate models that showed significance at p ≤ 0.05. Missing data were handled using an imputation method that replaces missing values with the mean of the variables for all other cases. Significance was defined as p < 0.05 for all tests. The analyses were performed using IBM SPSS Statistics for Windows version 23.0 (IBM, Armonk, NY, USA).
RESULTS
Table 1 summarizes the characteristics of the 335 patients. Their mean age was 56 years and 84.8% were female. The median duration of disease was 6 years (IQR, 3.5 to 9). At the time of assessment, steroids were used in 75.2% of the patients at a mean daily dose of 3.2 mg of prednisolone. The mean DAS28-ESR score was 3.6 ± 1.1. Obesity defined as BMI ≥ 25 was present in 32.5% of the subjects. Obese patients had higher inflammatory markers (CRP and ESR), higher disease activity measured with the DAS28, and a higher pain VAS than non-obese patients (Supplementary Table 1). In male patients, obese patients were younger compared to nonobese patients. On the other hand, in females, obese patients were older, had lower seropositivity and higher ESR, CRP, DAS28, and pain VAS score than non-obese patients (Table 1).

Demographic characteristics of the study subjects
First, regression analysis was performed to elucidate parameters that are associated with DAS28, pain VAS, HAQ score and DAS28-P (Supplementary Tables 2-5). DAS28 was significantly associated with sex, current steroid dose, and HAQ, while pain VAS was significantly associated with DAS28, body fat/skeletal muscle ratio, and HAQ score. HAQ score was significantly associated with age and DAS28 while DAS28-P was significantly associated with age, BMI and HAQ score.
Because body composition differed significantly between males and females, we next performed gender-specific regression analysis to explore factors associated with the DAS28 (Table 2). On univariate regression analysis in males, the DAS28 was positively associated only with the current steroid dose. By contrast, in females, the DAS28 was positively associated with age, disease duration, current steroid dose, BMI, body fat mass, and the HAQ score. After adjustment, the DAS28 in females was positively associated with the current steroid dose, body fat mass, and HAQ score.
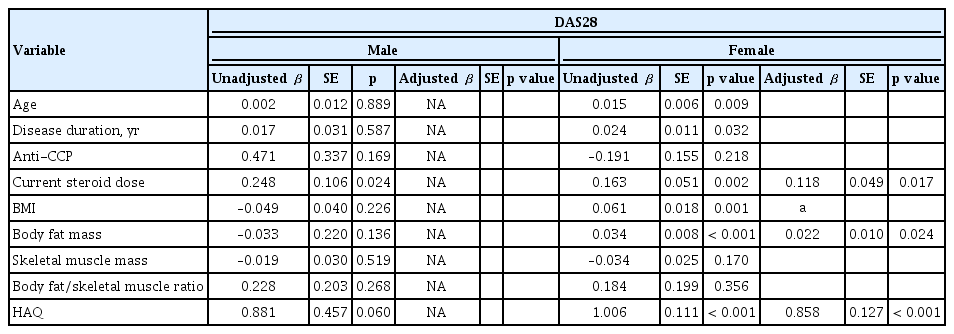
Association of body composition with the DAS28 score
We used ordinal regression analysis to explore the factors associated with pain measured with a VAS scale (Table 3). On univariate ordinal regression analysis in males, the pain VAS was positively associated with the DAS28 and HAQ score, while in females older age, anti-CCP positive, DAS28, BMI, body fat mass, body fat/skeletal muscle ratio, and HAQ score were positively associated. After adjustment, anti-CCP positive remained significantly associated with the pain VAS score in females, while DAS28 was significant in both genders.

Association of body composition with the pain visual analogue scale
We also used ordinal regression analysis to explore the factors associated with functional status measured with the HAQ score (Table 4). On univariate ordinal regression analysis in males, only body fat mass was associated with a higher HAQ score. By contrast, in females, age, DAS28 score, and body fat/skeletal muscle ratio were positively associated with the HAQ score and skeletal muscle mass was negatively associated. These associations with HAQ remained significant after adjustment.

Association of body composition with the health assessment questionnaire
Finally, we hypothesized that DAS28-P, a parameter accounting for the subjective components of the DAS28, would be associated with body composition. We used regression analysis to explore the factors associated with DAS28-P (Table 5). On univariate regression analysis in males, the DAS28-P was negatively associated with age. In females, DAS28-P was positively associated with BMI, the body fat/skeletal muscle ratio, and HAQ score and negatively associated with positivity for RF and anti-CCP. After adjustment, the DAS28-P was positively associated with body fat/skeletal muscle ratio and HAQ score in females.
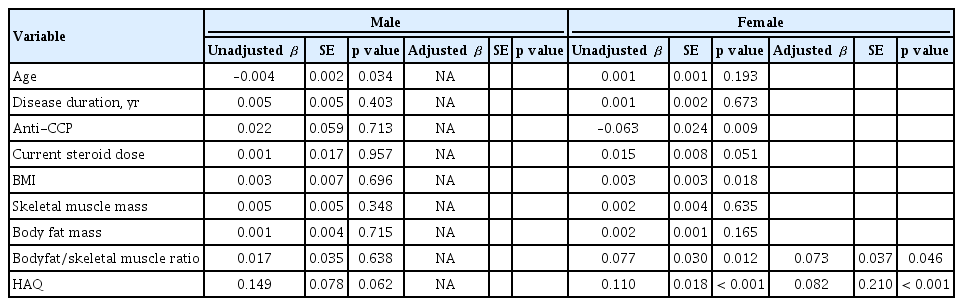
Association of body composition with the DAS28-P
DISCUSSION
Our study explored the associations of body composition, such as fat and muscle mass, with disease activity, pain, and disability in RA. The DAS28 score was positively associated with body fat mass, while the HAQ score was associated with a lower skeletal muscle mass and higher body fat/skeletal muscle ratio. The DAS28-P score was positively associated with the body fat/skeletal muscle ratio. However, these associations were observed only in females.
In addition to changes in joint and bone integrity in RA, a change in body composition has been reported, with a high body fat mass, high truncal fat distribution, and low lean muscle mass seen even in early RA [3,12]. Fat area and muscle density were strongly associated with disability and physical performances in RA patients, while greater radiological damage and disease activity were associated with lower muscle density [4,13]. A seminal 1992 study by Roubenoff et al. [2] found elevated TNF-α in flaring RA patients with a low lean body mass, implicating a role for TNF-α in both disease activity and hypermetabolism. Because decreases in lean mass and the fat/muscle mass ratio are also associated with risk factors for cardiovascular morbidity, such as insulin resistance and hypertension [14], this modifiable aspect of RA is of clinical importance.
Currently, adipose tissue is considered to be an endocrine organ that promotes low-grade systemic inflammation by secreting adipokines [15]. A recent study showed that BMI influenced the multi-biomarker disease activity score based on 12 inflammatory markers, which reflects inflammation in RA more sensitively than CRP [16]. Previously, we showed that increases in fat mass and the fat/muscle mass ratio were significantly associated with musculoskeletal pain in women [17]. Therefore, we reasoned that fat mass would be associated with pain and disease activity in RA as well. A meta-analysis of seven studies found that obese RA patients had higher disease activity measured with the DAS28 and worse function measured with the HAQ compared with non-obese patients [18]. These associations mainly resulted from an increase in the subjective components of the DAS28 (total joint count and global health assessment) in obese patients [18]. In addition, radiographic joint damage was negatively associated with obesity, suggesting that the disease activity driven by a high BMI results from pain rather than inflammation. In line with this meta-analysis, we found that the disease activity measured with the DAS28 was positively associated with both BMI and body fat mass. While the body composition measures were not significantly associated with pain measured with a VAS after multivariate analysis, the DAS28-P, a derived index that assesses the contribution of subjective components to the DAS28, which may provide a quantitative assessment of the non-inflammatory contribution to pain in RA [19], was positively associated with the body fat/skeletal muscle ratio. Because the pain VAS score did not follow a normal distribution in our patients, we categorized the pain VAS score into tertiles, which could have led to a loss of statistical power.
In addition to the cross-sectional disease activity, a recent meta-analysis of eight studies evaluated the relationship between obesity and remission in RA [6]. This showed that obese patients had significantly lower odds of achieving and sustaining remission (pooled odds ratio [OR], 0.57 and 0.49, respectively) relative to non-obese patients. Most of the included studies reported that obese patients have higher tender joint counts, inflammatory marker levels, patient global evaluation scores, pain scores, and worse physical function scores during follow-up, but not higher swollen joint counts [6].
It is of note that the association of body composition parameters with RA disease measures was observed only among females. A meta-regression analysis by Lupoli et al. [5] showed that the influence of obesity on the achievement of minimal disease activity was more significant in males, which does not corroborate our findings. This discrepancy could be explained by using only BMI and not body composition in that study, and by the differences in outcome parameters, e.g., the response to treatment vs. disease activity measured with the DAS28 and DAS28-P. In a 3-year prospective study, we showed that the baseline fat/muscle ratio and fat mass were significantly associated with the development/persistence of pain only among females [20]. These results suggest that fat mass parameters may explain the increased prevalence of pain among women. Women are reported to have a more intense inflammatory response than men, and the stronger inflammatory response arising from increased fat in women may play a role in the gender difference of pain [21].
To our knowledge, there were few studies exploring the association of body composition indexes with disease activity, pain, and disability in Asian RA patients. In a study of Vietnamese RA patient exploring the association of body compositions and disease activity and disability score in 105 female RA patients, DAS28 score was positively correlated with total fat mass and HAQ score was inversely correlated with appendicular lean mass [22]. Asians have a different body composition to that of Caucasians, and our study helps us to understand the influence of body composition in the management of Asian RA patients. In line with data from Caucasian patients, our result showed that Korean RA patients had association of body composition with disease activity and disability.
Our study has several limitations. First, the data used were cross-sectional, so we cannot establish a cause-andeffect relationship between body composition and disease activity. A longitudinal, prospective cohort study of treatment-naïve RA patients would help to examine the effect of body composition on inflammation and treatment response in RA patients. Second, we measured body composition using an InBody analyzer. Most previous studies measured body composition with dual x-ray absorptiometry (DXA) [3,12,22] or CT, [4,13] therefore, the validity of our results compared with these studies cannot be established. According to another study from our center, however, the correlation coefficient between InBody and DXA measurements was 0.93, and the mean error was 1.2% (95% confidence interval [CI], 4.6 to 7.1), indicating a good correlation between the two methods [23]. Only 51 male patients were included for our study, which may have limited the statistical power and thus the extrapolation of our result to male patients. Lastly, our study used data from a single clinical center, so the patient population might not represent Asian RA patients in general.
In conclusion, body composition, including body fat mass and the body fat/skeletal muscle mass ratio, was significantly associated with disease activity, and disability in female Asian RA patients. We suggest that the effects of obesity and fat mass be considered as an important aspect of RA management.
KEY MESSAGE
1. In our study, body composition was significantly associated with disease activity, and disability in rheumatoid arthritis (RA).
2. We suggested that the effect of obesity be considered as an important aspect of RA management.
Notes
No potential conflict of interest relevant to this article was reported.
Acknowledgements
This research was supported by a grant of the Korea Health Technology R&D Project through the Korea Health Industry Development Institute (KHIDI), funded by the Ministry of Health & Welfare, Republic of Korea (grant number : HI15C2699) and the Basic Science Research Program through the National Research Foundation (NRF) of Korea funded by the Ministry of Education (2017R1A2B2001881).