J-curve relationship between corrected QT interval and mortality in acute heart failure patients
Article information

Abstract
Background/Aims
This study investigated the prognostic power of corrected QT (QTc) interval in patients with acute heart failure (AHF) according to sex.
Methods
We analyzed multicenter Korean Acute Heart Failure registry with patients with AHF admitted from 2011 to 2014. Among them, we analyzed 4,990 patients who were followed up to 5 years. Regarding QTc interval based on 12 lead electrocardiogram, patients were classified into quartiles according to sex.
Results
During follow-up with median 43.7 months, 2,243 (44.9%) patients died. The relationship between corrected QT interval and all-cause mortality followed a J-curve relationship. In Kaplan-Meier analysis, both sex had lowest mortality in the second QTc quartile. There were significant prognostic differences between the second and the fourth quartiles in male (log-rank p = 0.002), but not in female (log-rank p = 0.338). After adjusting covariates, the third (hazard ratio [HR], 1.185; 95% confidence interval [CI], 1.001 to 1.404; p = 0.049) and the fourth (HR, 1.404; 95% CI, 1.091 to 1.535; p = 0.003) quartiles demonstrated increased risk of mortality compared to the second quartile in male. In female, however, there was no significant difference across quartiles. QTc interval was associated with 5-year all-cause mortality in J-shape with nadir of 440 to 450 ms in male and 470 to 480 ms in female.
Conclusions
QTc interval was an independent predictor of overall death in male, but its significance decreased in female. The relationship between QTc interval and all-cause mortality was J-shaped in both sex.
INTRODUCTION
Despite the advances in heart failure (HF) management, the associated mortality rate still remains substantially high [1-3]. When patients are hospitalized with acutely decompensated HF, they demonstrate high rates of readmission and mortality [4-7]. Therefore, various studies have been conducted to improve the precision of risk stratification in patients with acute HF [8,9]. Guidelines for the diagnosis and treatment of acute and chronic HF recommend an evaluation with 12-lead electrocardiogram (ECG) for all patients presenting with symptoms and signs of HF [10,11]. Clinical information obtained from ECG, such as heart rhythm, heart rate, QRS morphology, and QT interval, assists in diagnosing cardiac abnormalities, making treatment decision, and predicting prognosis.
larization and repolarization. Corrected QT (QTc) interval is adjusted according to heart rate, which helps to identify patients with increased risk of ventricular arrhythmia [12]. Left ventricular dilatation and female sex have been reported to be associated with QTc prolongation [13,14]. Owing to their association with electrical instability and arrhythmogenesis, prolonged QT and QTc interval have been considered to be useful prognosticators [15,16]. These intervals have shown prognostic value, possibly with a J-shaped association, in healthy individuals as well as in those with risk factors [17-21]. Furthermore, these intervals have also been reported to have predictive value in patients with chronic HF [22,23].
On the contrary, a previous small and short cohort study in patients with acute HF failed to demonstrate significant association between prolonged QTc and mortality [24]. However, this study only performed binary risk stratification (QTc ≥ 440 ms or less), and did not consider QTc difference according to sex.
In this study, we hypothesized that QTc interval has useful prognostic value in patients with acute HF, and its association would be different according to sex. We categorized the patients in quartiles according to QTc interval and sex, and then investigated the prognostic value of QTc interval using 5-year follow-up data from Korean acute HF (KorAHF) registry.
METHODS
The design of the KorAHF registry has been published elsewhere [2,3]. In brief, this multicenter cohort registry was designed to include consecutive patients admitted to the hospital with acute HF syndrome. Of the 5,625 patients recruited between January 2011 and February 2014, patients with QTc interval < 350 ms (n = 53), pacing rhythm (n = 134), and a previously diagnosed malignant neoplasm (n = 448) were excluded. Patients with the history of malignancy were excluded because their mortality was significantly different from that of patients without the history of malignancy. Final 4,990 patients were included in the study. A schematic flowchart of this study is presented in Fig. 1. The Institutional Review Board of Seoul National University Hospital approved the study protocol (IRB No.: 2004-166-1119). Written informed consent by the patients was waived due to a retrospective nature of our study. The investigation conformed to the principles outlined in the Declaration of Helsinki.
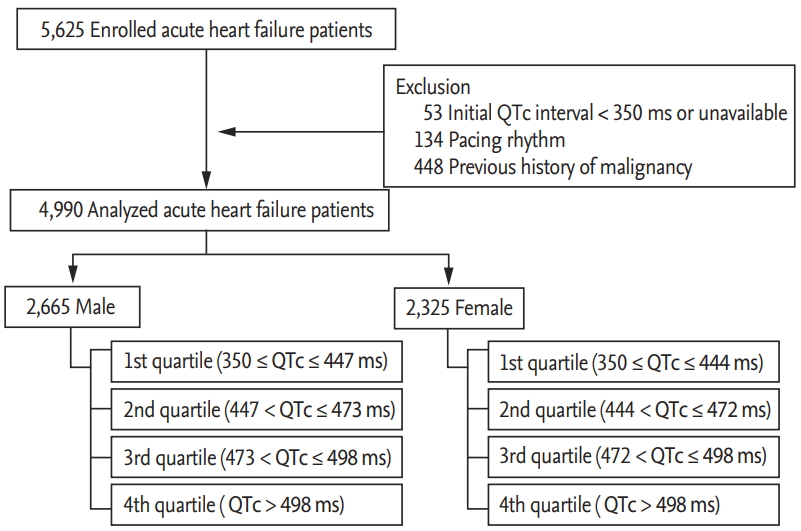
Scheme of the study. Scheme of this study is presented. QTc, corrected QT.
We recorded demographics, past medical history, social history, clinical presentation, and physical examination. Further, leukocytes, hemoglobin, blood urea nitrogen, creatinine, sodium, and potassium levels were measured and recorded at admission. Blood sampling and tests were conducted by laboratories at each center certified by the Korean Association of Quality Assurance for Clinical Laboratories. Transthoracic echocardiography was performed by a skilled clinician upon admission. Data were entered into registry database through a web-based case report form filled by the attending physician. Patients underwent standard 12-lead ECG evaluation upon admission. For this study we used clinical QTc data obtained from these initial 12-lead ECG recordings, which were performed in real-world clinics. Patients were classified into quartiles according to sex; men were classified into 1st (350 ≤ QTc ≤ 447 ms), 2nd (447 < QTc ≤ 473 ms), 3rd (473 < QTc ≤ 498 ms), and 4th (QTc > 498 ms) quartiles and women were stratified into 1st (350 ≤ QTc ≤ 444 ms), 2nd (444 < QTc ≤ 472 ms), 3rd (472 < QTc ≤ 498 ms), and 4th (QTc > 498 ms) quartiles.
Patients were followed up for 1, 3, 6, 12, 24, 36, 48, and 60 months. All-cause mortality was used as a primary outcome variable in this study. Rate of any death or heart transplantation was the secondary outcome variable. Mortality data of patients who were lost to follow-up were collected from the governmental statistics office in South Korea. The primary endpoint was 5-year all-cause mortality, and we also analyzed 30-day mortality. In addition, we analyzed the 5-year and 30-day composite outcomes of all-cause mortality and hospitalization due to heart failure.
Statistical analysis
Data were described as numbers and frequencies for categorical variables, and as mean ± standard deviation or median with interquartile range for continuous variables. For comparison between groups, the chi-square test or Fisher’s exact test was used for categorical variables and the unpaired Student’s t test was used for continuous variables. One-way analysis of variance and Scheffé’s post hoc test were used to analyze differences between continuous variables among > 2 groups. The chronological trend of outcomes was expressed as Kaplan–Meier estimates and compared according to the QTc interval. The log-rank test was used to analyze the significant differences in clinical outcomes. A multivariable Cox proportional-hazards regression model was used to find independent predictors of clinical outcomes. The associations between QTc interval and all-cause mortality were investigated using multivariable fractional polynomials (MFP). Two-sided p < 0.05 was considered statistically significant. The IBM SPSS Statistics version 23 (IBM Co., Armonk, NY, USA) and STATA software version 12 (Stata Co., College Station, TX, USA) were used to perform statistical tests.
RESULTS
Baseline characteristics of study population
The baseline characteristics of patients according to sex and QTc quartiles are described in Tables 1 and 2. Briefly, the median follow-up period was 43.7 months and the mean age was 68.3 years, 53.4% of the subjects were males, 59.5% had hypertension, 36.0% had diabetes mellitus, and 28.8% had ischemic heart disease. In the study population, 42.4% of the subjects had been previously diagnosed with heart failure. There were no significant differences in age, previous history of hypertension, diabetes mellitus, heart failure, ischemic heart disease, chronic obstructive lung disease, chronic kidney disease, and cerebrovascular accident across the QTc quartiles in both sex. Baseline characteristics according to sex are demonstrated in Supplementary Table 1.

Baseline characteristics of male patients according to corrected QT Interval (total n = 2,665)

Baseline characteristics of female patients according to Corrected QT Interval (total n = 2,325)
Though previous report defined normal QTc group as QTc < 440 ms in patients with acute HF [24], the upper limit of 1st quartile surpass 440 ms in both male and female as shown in Tables 1 and 2. Left ventricular end diastolic diameter was significantly associated with QTc interval (r = 0.133, p < 0.001 for male and r = 0.181, p < 0.001 for female). Age did not show significant correlation with QTc interval (r = –0.006, p = 0.752 for male and r = –0.029, p = 0.160 for female) in both groups. LVEF was negatively associated with QTc interval in both sexes (r = –0.204, p < 0.001 for males and r = –0.225, p < 0.001 for females).
Clinical outcomes according to QTc quartiles during follow-up
During the 5-year follow-up period, 2,243 patients (44.9%) died, of which 1,185 (52.8%) were male. Among them, 268 patients died during first 30 days. Subjects who died had more adverse characteristics, including older age, higher prevalence of previous hypertension, diabetes mellitus, heart failure, ischemic heart disease, valvular heart disease, chronic lung disease, chronic kidney disease, and cerebrovascular accident, than the survivors. Deceased subjects had larger left ventricular end diastolic diameter; however, there was no significant difference between the left ventricular ejection fractions of the living and deceased subjects (Supplementary Table 2).
Kaplan-Meier analysis was performed to demonstrate the clinical outcome of patients according to the QTc quartiles in both sex. In male, 2nd quartile not only showed highest survival rates but also showed significantly superior prognosis compared to 4th quartile which had lowest survival rates (log-rank p = 0.002) (Fig. 2A). On the contrary, there was no significant difference between 2nd and 4th quartiles (log-rank p = 0.338) in female (Fig. 2B). This tendency was also observed in the 30-day mortality, as demonstrated in Fig. 3. When composite outcomes of mortality and hospitalization due to heart failure were analyzed, only the 4th quartile of male patients showed increased risk at 5 years, with no prognostic difference across quartiles seen in female patients (Supplementary Fig. 1).

Five-year outcomes according to corrected QT quartiles in acute heart failure patients. The Kaplan-Meier curves showed 5-year all-cause survival rates in (A) male and (B) female. ACM, all-cause mortality.
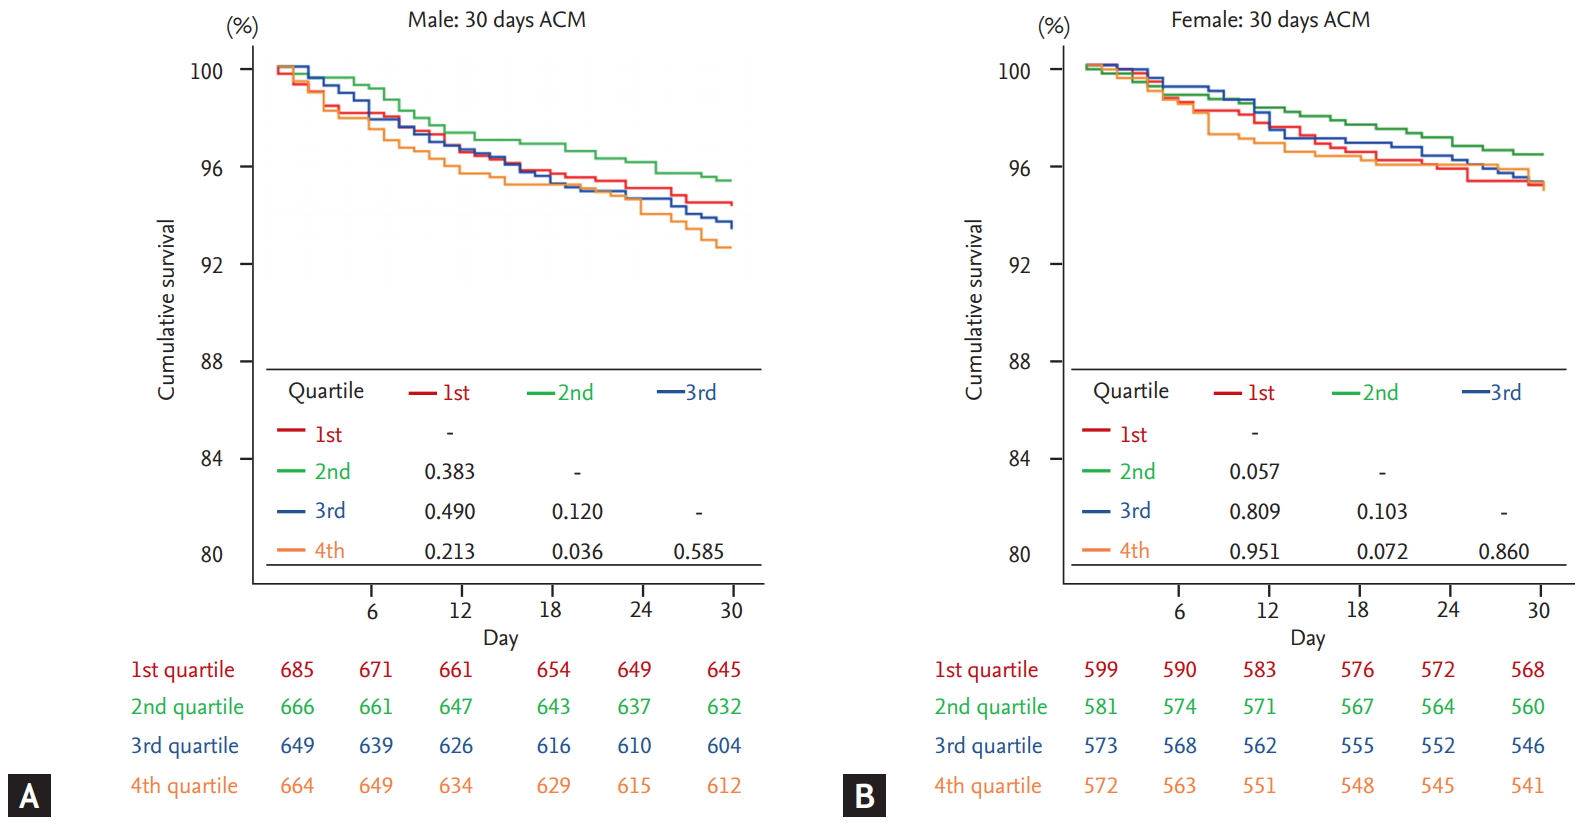
Thirty-day outcomes according to corrected QT quartiles in acute heart failure patients. The Kaplan-Meier curves showed 30-day all-cause survival rates in (A) male and (B) female. ACM, all-cause mortality.
Different prognostic impact of QTc quartiles according to sex
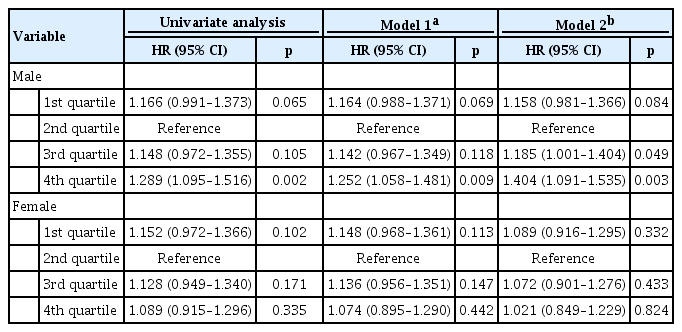
The results of Cox-proportional regression analysis for 5-year mortality were shown in Table 3. The 2nd quartile was defined as a reference group, as it had lowest risk in Kaplan-Meier analysis in both sex. Univariate analysis showed increased risk of 4th quartile in male (hazard ratio [HR], 1.289; 95% confidence interval [CI], 1.095 to 1.516; p = 0.002). In female, no statistical significance was observed across the quartiles.
Unadjusted and adjusted Cox regression analysis for 5-year all-cause death
We then evaluated the multivariate analysis, adjusted for atrial fibrillation and right or left bundle branch block (model 1), and for comprehensive clinical data including age, body mass index, previous history of hypertension, diabetes mellitus, heart failure, ischemic heart disease, valvular heart disease, chronic obstructive lung disease, chronic renal failure, cerebrovascular accident, atrial fibrillation, beta-blocker medication at discharge, and right or left bundle branch block (model 2). With both models, 4th quartile in male had worse prognosis than reference group (HR, 1.252; 95% CI, 1.058 to 1.481; p = 0.009 for model 1 and HR 1.404; 95% CI, 1.091 to 1.535; p = 0.003 for model 2). In addition, 3th quartile in male also showed detrimental prognosis (HR, 1.185; 95% CI, 1.001 to 1.404; p = 0.049) in model 2. However, there was no significant prognostic difference across QTc quartiles of female. The Cox model with MFP showed a J-shaped association in both male and female (Fig. 4). Male had nadir in about 440 to 450 ms, female in about 470 to 480 ms with less steeper slope. When multivariate analyses were performed for 30-day mortality, there was no significant difference across quartiles in both male and female (Table 4).

Thirty-day outcomes according to corrected QT (QTc) quartiles in acute heart failure patients. The Kaplan-Meier curves showed 30-day all-cause survival rates in (A) male and (B) female. HR, hazard ratio.

Unadjusted and adjusted Cox regression analysis for 30-day all-cause death
DISCUSSION
The major findings of this study are as follows: (1) A substantial number of patients with acute HF had prolonged QTc interval (QTc ≥ 440 ms) than previously considered normal range; (2) in Kaplan-Meier analysis, prolonged QTc interval increases the 5-year mortality and 30-day mortality in male but not in female; (3) after adjusting covariates, QTc prolongation had independent prognostic impact only in male, but its significance was attenuated in female; (4) there was J-shape association between 5-year mortality in QTc interval in both male and female.
These findings were in congruence with previous studies which demonstrated increased mortality risk in chronic HF patients with prolonged QT interval [22,23]. Furthermore, our study found that a substantial number of patients had prolonged QTc interval, and the nadir of J-shaped association was significantly right-shifted in patients with acute HF compared to those with chronic HF [22]. This discrepancy could have influenced the results of a previous study that reported lack of prognostic impact of QTc interval and absence of of J-shaped association, as aforementioned study analyzed the QTc duration only by a binary classification based on the 440 ms threshold [24]. We did not explore the underlying biology linking QTc interval and mortality in this study. To our knowledge, there is a paucity of data which could directly explain this J-shaped relationship. Based on the findings of several experimental studies, the authors cautiously suggest that a relatively short QTc duration and repolarization time could be a substrate for multiple-circuit reentry excitation, which would induce atrial/ventricular arrhythmia [25,26].
Right shifted QTc interval range with low risk of allcause mortality, as shown in the lowest mortality of 2nd quartile, might be attributed to the complex characteristics of acute HF. Patients with acute HF experience a decline in pumping capacity, which results in hypoperfusion and congestion. Compensatory pathways, including the renin-angiotensin system and sympathetic nervous system, are then activated to maintain cardiac output by increasing salt retention and augmented cardiac contractility [27,28]. Although sustained compensatory mechanisms could lead to pathologic end-organ damage, their activation is important for the restoration of the cardiovascular status within the hemodynamically stable physiologic range and renders patients asymptomatic in the short acute period [24]. The QTc interval represents the time of electrical depolarization and repolarization of ventricular myocardium. However, as shown in Table 3, QTc interval persistently demonstrated prognostic implications even after adjusting for multiple comorbidities, including left ventricular end diastolic diameter. Therefore, we hypothesize that QTc interval could be influenced by various environmental factors, in addition to the left ventricular dimension. Studies have demonstrated that the QTc interval could vary according to sympathetic and parasympathetic tone [29,30]. In particular, increased catecholamine levels, which could often be observed in patients with acute heart failure, have been reported to induce QTc interval prolongation [31-33]. Change in QTc interval in patients with acute HF might be confounded by its complex pathophysiologic status, not only with respect to structural abnormality, but also with respect to adaptively activated neurohormonal pathways, which were different from those in participants of other studies.
A variety of studies have reported significantly longer QTc intervals in females compared to their male counterparts [34,35], in those of normal status as well as those with various pathologies [36,37]. These studies suggested that sex hormone differences between male and female could have an influence on ventricular repolarization. Therefore, we postulated that the QTc interval of females might be longer than that of males among patients with AHF, and set the quartiles separately for males and females.
We found that prolonged QTc interval has a prognostic implication in males, but its significance was diminished in females. Although we did not fully explore the underlying biological mechanisms, there are several possible explanations for our results. Female patients showed a higher percentage of heart failure with preserved ejection fraction (HFpEF) than male patients. When we analyzed the multifractional polynomial Cox regression according to HF phenotypes, we found that the J-curve association was steeper in the upper limits in patients with heart failure with reduced ejection fraction compared to those with HFpEF. In addition, female patients were older and showed a preponderance of a previous history of hypertension, heart failure and valvular heart disease (Supplementary Table 1), which were frequently observed in deceased subjects (Supplementary Table 2). Considering these together, we cautiously hypothesize that these detrimental covariates might attenuate the statistical significance of the QTc interval in female patients.
In this study, we adopted the QTc interval measured and calculated automatically by standard commercial electrographs. However, several previous studies on QT or QTc interval measured the duration of QT interval manually [12,22,24,38,39]. These manual methods are not real-world clinical practices, are time-consuming processes, and demonstrated physician dependency (even among trained cardiologists) [40,41]. In addition, automatic method has recently proved its usefulness and accuracy in QT interval measurement [42,43].
This study provides an insight into the association between QTc duration and all-cause mortality. While accurate cause of the right-shifted relation cannot be fully understood through our report, our findings have valuable clinical implications. QTc duration can be easily obtained and measured with a 12-lead ECG or even mobile devices. However, such simple measurement can predict the prognosis in high risk patients. It could be helpful to stratify the risk of patients in addition to other risk factors without invasive procedure [8,9]; for example, it might be applied in tele-monitoring.
Some limitations of this study must be taken into consideration. First, the onset of prolonged QTc and the effect of dynamic QTc interval change during follow-up were unknown in our registry. Second, we did not analyze the confounding effect of antiarrhythmic agents such as amiodarone for atrial fibrillation and antidepressants, which might induce QTc interval prolongation [21,22]. However, the J-shaped relationship of QTc interval and all-cause mortality persisted regardless of atrial fibrillation, which accounted for most type III medication use. This issue appeared minor. In addition, since the patients in this study all come from East Asia, it is unknown whether the results of this study can be extrapolated to other ethnicities and countries. Fourth, we used QTc data obtained by real-world 12-lead ECG devices. This study was intended to show the practical prognostic value of the QTc interval, but there could be confounders in patients with atrial fibrillation and bundle branch block, although these factors were adjusted for in the multivariable analysis. In addition, since we did not assess all echocardiographic parameters regarding LV mass, we could not investigate the association between QTc interval and LV mass index. Lastly, we excluded patients with pacing rhythm, as their activation and deactivation pathway might be different from that of those without artificial pacing.
In conclusion, a substantial number of patients with AHF had prolonged QTc interval. QTc interval is an independent prognosticator for 5-year mortality in male, but it failed to show prognostic significance in female. The relationship between QTc interval and all-cause mortality was J-shaped as was previously known; however, it seemed to be right-shifted in patients with AHF and less steeper in female.
KEY MESSAGE
1. More than three-fourths of patients with acute heart failure had prolonged corrected QT (QTc) interval (QTc ≥ 440 ms) than previously considered normal range.
2. In Kaplan-Meier analysis, 4th QTc quartile demonstrated increased 5-year mortality and 30-day mortality in male but not in female.
3. After adjusting covariates, QTc prolongation had independent prognostic impact only in male, but its significance was attenuated in female.
4. There was J-shape association between 5-year mortality in QTc interval in both male (nadir 440 to 450 ms) and female (470 to 480 ms).
Notes
No potential conflict of interest relevant to this article was reported.
Acknowledgements
This work was supported by Research of Korea Centers for Disease Control and Prevention (2010-E63003-00, 2011-E63002-00, 2012-E63005-00, and 2013-E63003-00).
The KorAHF Registry was conducted from 10 tertiary medical centers: Seoul National University Hospital, Seoul, Korea; Sungkyunkwan University College of Medicine, Seoul, Korea; University of Ulsan College of Medicine, Seoul, Korea; Chungbuk National University College of Medicine, Cheongju, Korea; Kyungpook National University College of Medicine, Daegu, Korea; The Catholic University of Korea, Seoul, Korea; Yonsei University College of Medicine, Seoul, Korea; Yonsei University Wonju College of Medicine, Wonju, Korea; Seoul National University Bundang Hospital, Seongnam, Korea; Heart Research Center of Chonnam National University, Gwangju, Korea.
Supplementary Materials
Baseline characteristics of subjects according to 5-year survival (total n = 4,990)
Composite outcomes of all-cause mortality (ACM) and hospitalization due to heart failure (HHF) according to corrected QT (QTc) quartiles in acute heart failure patients. (A) Male: 5 years ACM + HHF. (B) Female: 5 years ACM + HHF. (C) Male: 30 days ACM + HHF. (D) Female: 30 days ACM + HHF. The Kaplan-Meier curves showed 5-year and 30-day outcomes in male and female patients.