A cohort study on the association of MDM2 SNP309 with lung cancer risk in Bangladeshi population
Article information
Abstract
Background/Aims
Bangladesh is a densely populated country with an increased incidence of lung cancer, mostly due to smoking. Therefore, elucidating the association of mouse double minute 2 homolog (MDM2) single nucleotide polymorphism (SNP) 309 (rs2279744) with lung cancer risk from smoking in Bangladeshi population has become necessary.
Methods
DNA was extracted from blood samples of 126 lung cancer patient and 133 healthy controls. The MDM2 SNP309 was genotyped by polymerase chain reaction- restriction fragment length polymorphism (PCR-RFLP), using the restriction enzymes MspA1I. Logistic regression was then carried out to calculate odds ratios (ORs) and 95% confidence intervals (CIs) to estimate the risk of lung cancer. A meta-analysis of SNP309 was also carried out on 12,758 control subjects and 11,638 patient subjects.
Results
In multivariate logistic regression, significantly increased risk of lung cancer was observed for MDM2 SNP309 in the dominant model (TG + GG vs. TT: OR, 2.13; 95% CI, 1.29 to 3.53). Stratification analysis revealed that age, sex, obesity, and smoking also increases the risk of lung cancer when carrying the MDM2 SNP309. Our meta-analysis revealed that MDM2 SNP309 was considerably associated with lung cancer in Asian populations (TG + GG vs. TT: OR, 1.32; 95% CI , 1.12 to 1.56; p = 0.019 for heterogeneity).
Conclusions
The MDM2 SNP309 was associated with high risk of lung cancer in Bangladeshi and Asian population, particularly with increased age, smoking, and body mass index.
INTRODUCTION
Bangladesh is one of the most densely populated countries with an average population of 168 million people. In Bangladesh, an estimated 0.19 million people suffer from lung cancer each year. The death rate due to lung cancer is approximately 0.03 million per year. Smoking is by far the most strongly correlated risk factor for lung cancer. About 90% of lung cancer cases are caused by tobacco usage, and 80% of lung cancer deaths are as a direct result of smoking tobacco [1]. Lung cancer occurs more in the elderly than in the young [2]. About 67% of people diagnosed with lung cancer are of age 65 years or older, while less than 2% are younger than 45 years of age [3,4]. The odds of a man developing lung cancer is about 1 in 14, while the odds of a woman developing lung cancer is 1 in 17 [5,6]. Carreras-Torres et al. [7] report that for every 4.6 kg/m2 increase in body mass index (BMI), the risk of squamous cell carcinoma increases by 1.20.
MDM2, the mouse double minute 2 homolog, is a E3 ubiquitin-protein ligase encoded by the MDM2 gene in humans [8]. MDM2 is a p53-inducible gene. MDM2 and p53 are linked together by an autoregulatory negative feedback loop, which aims to maintain low cellular levels of p53 in the absence of cellular stress [9]. It is a negative regulator of p53 tumor suppressor and inhibits the transcriptional trans-activation mediated by p53. It recognizes the N-terminal trans-activation domain (TAD) of p53, and ubiquitinylates p53 for proteasomal degradation.
We have previously shown that P53 codon 72 single-nucleotide polymorphism increases the risk of lung cancer in Bangladeshi patients [10]. Evidence also suggests that the MDM2 single nucleotide polymorphism (SNP) 309 T>G (rs2279744) increases the risk of lung cancer [11]. But these suggestions have never been explored in the Bangladeshi population. Here, we have elucidated the distribution of the MDM2 SNP309 in the Bangladeshi population. We have attempted to evaluate the effect of this SNP on the risk of lung cancer in general and have linked the factors those can contribute to such risk.
METHODS
Statement of ethics
The study was approved by the ethical clearance board of National Institute of Cancer Research and Hospital (NICRH), Dhaka Medical College and Hospital (DMCH), and the University of Dhaka, Bangladesh (IRB No. 53/ Biol.Scs./2017-18). Before proceeding with the study, the subjects were notified about the experiments and written informed consent was obtained from everyone. The experimental procedures involved in the study were carried out in accordance with standard approved guidelines.
The study subjects
A total of 126 patient test subjects were contacted at the NICRH. Among them, 18 patients were with small cell lung carcinoma, 33 with adenocarcinoma, and the rest 75 were diagnosed with squamous cell lung carcinoma. In addition, 133 healthy control subjects were contacted at the Institute of Nuclear Medicine and Allied Science, DMCH, Dhaka. The patients were asked some questions in a small interview and requested to complete a structured questionnaire to collect the demographic information. The signed informed consent form was collected along with 5 mL of venous blood samples in purple top ethylenediaminetetraacetic acid vacutainers. The tubes were then transported to the laboratory in an ice-box.
DNA extraction and genotyping
Blood samples were stored at –20°C. Genomic DNA was extracted from samples using GeneJET Genomic DNA Purification Kit (Thermo Scientific, Waltham, MA, USA) following the manufacturer’s protocol. The DNA samples were quantified by using NanoDrop Spectrophotometer (NanoDrop 1000, Thermo Scientific) and were stored at –20°C for future use.
A 352 bp DNA fragment around the MDM2 SNP309 was amplified by polymerase chain reaction (PCR) using the primer set: 5′-CGGGAGTTCAGGGTAAAGGT-3′ and 5′-AGCAAGTCGGTGCTTACCTG-3′. PCR reactions were carried out in a 20 µL reaction mixture containing 2 µL (50 to 100 ng) DNA sample, 1 µL (10 pmol) of each primer, 6 µL of nanopore water, and 10 µL GoTaq Colorless Master Mix (Promega Corp., Madison, WI, USA) in a GeneAtlas G thermal cycler (Astec Co. Ltd., Fukuoka, Japan). The PCR steps were as follows: an initial denaturation step (95°C, 5 minutes), followed by 40 cycles of denaturation (95°C, 30 seconds), annealing (61°C, 30 seconds), and elongation (72°C, 1 minute) steps, followed by a final elongation step (72°C, 5 minutes). The amplified fragments were visualized in a 1% agarose gel. These amplicons were then purified using GeneJET PCR Purification Kit (Thermo Scientific) following the manufacturer’s protocol.
The genetic profiling of the MDM2 SNP309 gene was carried out by restriction fragment length polymorphism (RFLP). The 352 bp amplicons for MDM2 SNP309 were digested using MspA1I (New England Biolabs, Beverly, MA, USA) according to the manufacturer’s protocol. The digested products were separated by electrophoresis in a 1.8% agarose gel in 1X TBE. The unique fragmentation patterns were then visualized under ultraviolet-transilluminator by staining the gel with ethidium bromide.
Statistical analyses
All statistical analyses were performed using the statistical software package Stata version 14.1 (StataCorp., College Station, TX, USA). The data obtained from the questionnaires were analyzed to identify differences between the patient and control demographic characteristics. Continuous variables such as age and BMI were tested using Student’s t test, while categorical variables such as sex and smoking status were tested using Pearson chisquare test. Smoking history of patients and controls was compared using the Wilcoxon rank-sum test to find any significant difference. The genotypes were tested for the Hardy-Weinberg equilibrium. Test for trend was also carried out on the distribution of the SNP across the ordered groups. The odds ratio (OR) and 95% CI (confidence interval) were calculated for the SNP genotypes using simple logistic regression by keeping the co-dominant, dominant and recessive model in mind. Adjusted OR and 95% CI were then calculated to account for the confounding factors of age, sex, BMI, and smoking using multiple logistic regression analyses.
Meta-analysis
Case-control or cohort studies containing MDM2 SNP309 genotype distributions were searched through August 2017 in the PubMed and Google Scholar databases and 14 studies consisting of 12,625 control and 11,512 patient genotypes was selected for meta-analysis [12-25]. To determine the strength of the association, we calculated the OR and 95% CI of each study in the co-dominant, dominant, and recessive model. We also pooled the data to calculate overall OR and 95% CI. Subgroup analysis was performed by ethnicity. Z tests were used to determine the significance of the association between the SNP and lung cancer risk. The heterogeneity of the study was assessed by calculating Cochran’s Q test, and I squared statistics. If the p value of the test was < 0.1, the random-effects model was used, otherwise the Mantel-Haenszel fixed-effects model was used [26]. Finally, publication bias was assessed by Begg’s rank correlation test and Egger’s linear regression test [27,28].
RESULTS
Study characteristics
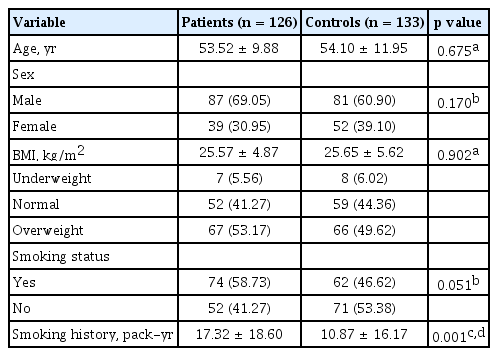
There were no significant differences between the patients and the control subjects in case of demographic characteristics, except for smoking history. The pack years for patients and controls were 17.32 ± 18.60 and 10.87 ± 16.17, respectively, which was significantly different (p = 0.001). No significant differences were found between patients and controls for age (p = 0.675), BMI (p = 0.902), sex (p = 0.170), and smoking status (p = 0.051) (Table 1). Consequently, only the variables age, sex, BMI, and smoking status were adjusted for the multiple logistic regression analyses.
Distribution of the variables in lung cancer patients and controls
Association of MDM2 SNP309 with lung cancer risk
The allele distributions of the MDM2 SNP309 in the patient and control groups were in Hardy-Weinberg equilibrium (chi-square = 0.43, p = 0.514 for control; and chi-square = 1.56, p = 0.212 for control, respectively) (Table 2). For the control group the genotype frequencies of the alleles TT, TG, and GG were 56.4%, 34.6%, and 9% respectively, and for the patient group, the genotype frequencies were 37.3%, 45.2%, and 17.5% respectively. We have observed a significant difference in genotype and allele frequencies between the patient group and the control group in a Pearson’s chi-square test (chi-square = 10.36, p = 0.006).

Distribution of alleles of MDM2 SNP309 and HWE test
Multivariate logistic regression was then carried out by adjusting for age, sex, BMI, and smoking status to account for their confounding factors in the analyses. It was revealed that individuals bearing the TG or GG genotype were at an increased risk of lung cancer ([TG vs. TT: OR, 1.93; 95% CI, 1.12 to 3.33], [GG vs. TT: OR, 2.84; 95% CI, 1.27 to 6.34]), when compared to the TT genotype. In the dominant model, individuals carrying either TG or GG were more susceptible to lung cancer (TG + GG vs. TT: OR, 2.13; 95% CI, 1.29 to 3.53), when compared to people carrying TT genotype, but with greater significance (p = 0.003). However, the recessive model was not significant (p = 0.053) (Table 3).

Distribution of genotypes of SNP309 among lung cancer patients and healthy controls and their association with lung cancer
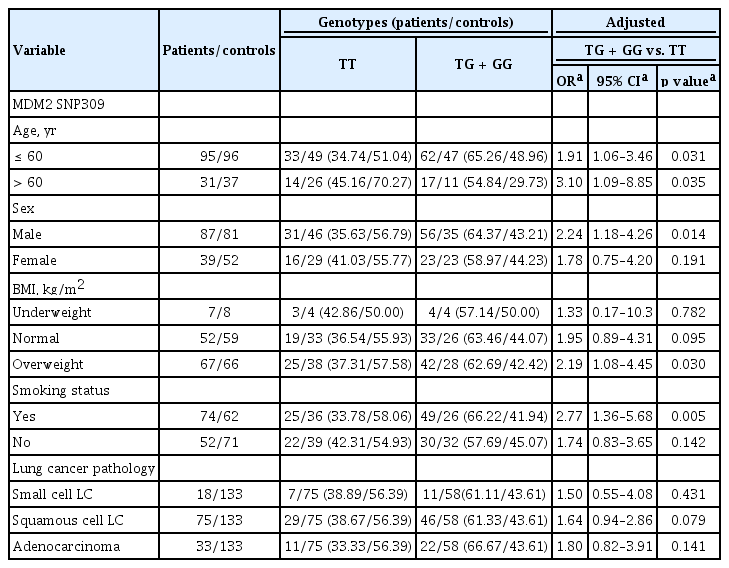
A stratification analysis was then carried out to see the effect of the grouped variables on the association between SNP309 and risk of lung cancer. All the values were calculated by using a dominant model and multiple logistic regressions adjusted for age, sex, BMI, and smoking status. People over the age of 60 (TG + GG vs. TT: OR, 3.10; 95% CI, 1.09 to 8.85), male individuals (TG + GG vs. TT: OR, 2.24; 95% CI, 1.18 to 4.26), overweight people (TG + GG vs. TT: OR, 2.28; 95% CI, 1.14 to 4.57), and smokers (TG + GG vs. TT: OR, 2.77; 95% CI, 1.36 to 5.68) were at a statistically significant risk. However, we did not find any significant association between MDM2 SNP309 and lung cancer risk according to the pathological subtypes of lung cancer (Table 4).
Stratification analyses between MDM2 SNP309 genotypes and lung cancer risk
Meta-analysis of MDM2 SNP309 and lung cancer risk
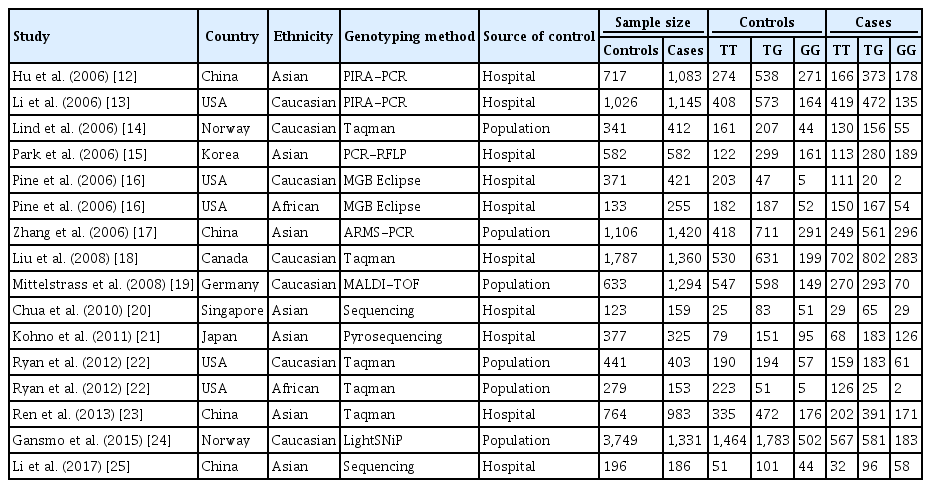
In the next step, a meta-analysis was carried out to elucidate the association between MDM2 SNP309 and lung cancer risk. Table 5 shows the 14 studies that were selected for the meta-analysis. We proceeded to pool the data from all 14 studies with the current study to carry out the meta-analysis which included 12,758 control subjects and 11,638 patient subjects.
Characteristics of the MDM2 SNP309 studies selected in the meta-analysis
The meta-analysis revealed that the overall data was only statistically significant in the recessive model (OR,1.15; 95% CI, 1.04 to 1.27, p = 0.041 for heterogeneity). However, the Asian subgroup showed significant increase in risk in case of the co-dominant ([TG: OR, 1.26; 95% CI, 1.10 to 1.45; p = 0.144 for heterogeneity], [GG: OR, 1.43; 95% CI, 1.13 to 1.80; p = 0.003 for heterogeneity]), dominant (OR, 1.32; 95% CI, 1.12 to 1.56; p = 0.019 for heterogeneity), and recessive model (OR, 1.23; 95% CI, 1.05 to 1.44; p = 0.036 for heterogeneity). The Caucasian, African, hospital, and population subgroup did not show any significant risk of lung cancer (Table 6). Finally, we used Galbraith plots to evaluate the overall heterogeneity of the pooled data. In addition, Begg’s rank correlation test and Egger’s linear regression test did not indicate any publication bias in any of the models used (co-dominant model [TG vs. TT: t = 1.49, p = 0.157; GG vs. TT: t = 0.91, p = 0.379], dominant model [t = 1.48, p = 0.160], and recessive model [t = 0.49, p = 0.628]).

Meta-analysis of MDM2 SNP309 on lung cancer risk
DISCUSSION
Lung cancer is a disease that thrives in this age of industry. The sufferers of lung cancer are endless, and the numbers seem to be growing rapidly each year. SNPs are of particular interest in this field as many SNPs have been associated with increased risk of cancer [29]. The MDM2 gene is one such example where the effect of SNPs has been known to increase the risk of lung cancer. Several studies have reported that MDM2 downregulates the p53 protein levels by ubiquitinylation and subsequent proteasomal degradation [30-32]. Moreover, MDM2 is suspected to induce tumorigenesis via p53-independent pathways due to its p53-independent overexpression [33,34].
Hu et al. [32] reported that SNPs in the MDM2 gene decreases p53 levels and decrease the efficiency of the p53 pathway. SNPs such as MDM2 SNP309 T>G (rs2279744) are of particular interest as they are known to influence the risk of cancer. The transcription factor replace with SP1 preferentially binds to the G allele compared to the T allele and hence increases the expression of MDM2. Increased expression of MDM2 reduces the tumor-suppressor function of p53 and can contribute to the development of cancer [35]. SNP309 is known to reduce the expression of p53, increasing the risks of cancer. In Bangladesh, it has been reported that P53 codon 72 polymorphisms are a risk factor for lung cancer [10]. Thus, we hypothesized that the aforementioned SNP could affect the risk of lung cancer, and factors such as age, sex, BMI, and smoking status could aggravate the effects.
Our data indicate that people carrying either TG or GG alleles of SNP309 are at a 2.17 times increased risk of lung cancer when compare to people carrying TT (Table 3). Further analysis revealed that older people are at a 3.1 times higher risk when carrying SNP309, which could potentially explain the increased incidence of lung cancer in the elderly (Table 4). It was also observed that men were at 2.24 times higher risk in comparison to female when carrying SNP309, which may reflect the accumulative effects of exposure to higher levels of mutagens [36-38]. Many studies have reported that smokers carrying SNP309 are at a significantly increased risk of lung cancer, and our results are in agreement with the studies showing 2.77 times higher risk with smoking, as well [39]. In addition, we have shown that the risk of lung cancer increases with obesity as well as smoking habit, age and in males. Our study indicates that the association follows a dominant model on G allele. However, our sample size was relatively small because most of the lung cancer patients were unwilling to provide consent. But the sample size is quite sufficient for such study as the results were adjusted for the small sample size using various robust statistical calculations. Previously, Park et al. [15], 2006 showed that people carrying GG at SNP309 were at greater risk compared to people carrying TT for lung adenocarcinoma (GG vs. TT: OR, 1.91; 95% CI, 1.16 to 3.14; p = 0.01). Despite this co-dominant model, the other models were insignificant [15]. On the other hand, Liu et al. [18] 2008 reported no significant association between SNP309 and non-small cell lung cancer in their stratification analyses. Overall, the dichotomy of which pathological subtype is affected by MDM2 SNP309 remains at large. In our study, SNP309 showed no significant association with lung cancer subtypes in all models.
We carried out the meta-analysis by pooling the published data with our own data in order to account for the varying effects observed in other studies. The meta-analysis revealed that select ethnic population such as Caucasians and Africans are unaffected by SNP309, while Asians are at considerable risk of lung cancer when carrying SNP309 TG or GG allele (Table 6). These effects are in accordance with the meta-analysis studies published by Zhuo et al. [11] and He et al. [40].
In summary, our data suggest that MDM2 SNP309 is associated with an increased risk of lung cancer especially in the Asian population, which was in agreement with our meta-analysis. Such rick could be increased in older people, overweight people, men, and smokers when carrying SNP309 G allele. Further validation with larger sample size from different ethnicities and sources, and a detailed molecular mechanism of the effect of SNP309 on MDM2 expression are required to elucidate the role of these polymorphisms.
KEY MESSAGE
1. The G allele of mouse double minute 2 homolog (MDM2) single nucleotide polymorphism (SNP) 309 is associated with increased risk of lung cancer development in Asian population.
2. Age, sex, smoking status, and body mass index can contribute further to enhance lung cancer risk in people with MDM2 SNP309 G allele.
Notes
No potential conflict of interest relevant to this article was reported.
Acknowledgements
The authors wish to acknowledge Neil Shephard from the Clinical Trials Research Unit, University of Sheffield for providing some of the Stata v14.1 code packages. The authors are grateful to Dr. Margaret Beucher of Utah Valley University, Orem, Utah, USA, for critically reviewing the article. We would also like to thank all the patient and control subjects for their participation. We are grateful to the Higher Education Quality Enhancement Project (HEQEP) authority for providing essential facilities at the Department of Genetic Engineering and Biotechnology, University of Dhaka for this research.