Impaired fasting glucose levels in overweight or obese subjects for screening of type 2 diabetes in Korea
Article information
 , Korean Diabetes Prevention Study Investigators
Abstract
Background/Aims
We examined the concordance rate among fasting plasma glucose (FPG), 2-hour post-challenge glucose (2hr PG), and hemoglobin A1c (HbA1c) in the diagnosis of diabetes in a population with a high-risk for type 2 diabetes mellitus (T2DM) in Korea.
Methods
Among the participants from the Korean Diabetes Prevention Study, individuals with FPG ≥ 100 mg/dL, body mass index (BMI) ≥ 23.0 kg/m2, and no previous history of T2DM were consecutively enrolled after a 75 g glucose tolerance test. We analyzed the differences in the clinical characteristics in subjects with stage 1 (FPG, 100 to 109 mg/dL) and stage 2 (FPG, 110 to 125 mg/dL) impaired fasting glucose (IFG).
Results
Of 1,637 participants, 27.2% had T2DM and 59.3% had IFG and/or impaired glucose tolerance (IGT). The mean age was 55.0 ± 8.1 years and the mean BMI was 26.3 ± 2.7 kg/m2. Based on FPG criteria, 515 (31.4%) and 352 (21.5%) subjects were classified as having stage 1 and stage 2 IFG, respectively. The 19.0% of stage 1 and 43.5% of stage 2 subjects showed 2hr PG levels in the diabetic range. Even for those in the normal FPG range, 63 (9.5%) participants showed a 2hr PG level of ≥ 200 mg/dL. Of 446 subjects with newly-diagnosed diabetes, 340 (76.2%) showed FPG levels < 126 mg/dL.
Conclusions
The oral glucose tolerance test should be actively considered for Korean adults who are overweight or obese with the IFG range (FPG, 100 to 125 mg/ dL) to allow for early detection of diabetes and prompt intervention.
INTRODUCTION
In 2016, the prevalence of diabetes in adults aged 30 years and older in Korea was 14.4%, and the number of patients with diabetes was estimated to be about 5 million people [1]. Moreover, the high prevalence of prediabetes (increased risk for diabetes), as compared to that of diabetes, is a serious health concern that requires urgent intervention. The overall prevalence of impaired fasting glucose (IFG) in Korea was estimated at 8.7 million, or approximately 25.3% of the Korean population in 2016 [1]. Early detection of prediabetes is extremely important because early intervention with lifestyle modification can prevent the progression of prediabetes to type 2 diabetes mellitus (T2DM) [2]. Without prompt intervention, nearly two-thirds of individuals with prediabetes who have both IFG and impaired glucose tolerance (IGT) are likely to progress to diabetes within several years [3]. With limited resources and budgets, targeted screening and early identification of subjects with a high risk of T2DM will maximize the efficiency of health care policy and ultimately lead to a reduced health burden [4].
Fasting plasma glucose (FPG) level has long been the gold standard used to diagnose diabetes [5]. However, many epidemiologic studies have shown that FPG alone cannot detect early diabetes in all patients who have 2-hour post-challenge glucose (2hr PG) concentrations from a 75 g oral glucose tolerance test (OGTT) within the diabetic range [3,6-10]. In addition, if FPG rather than 2hr PG is used for the diagnosis of diabetes, many subjects with IGT who are at risk of future cardiovascular disease (CVD) would not be identified. Practically, an OGTT is not routinely performed. Therefore, the addition of hemoglobin A1c (HbA1c) or other clinical marker with FPG is helpful to increase the detection rate of undiagnosed diabetes in routine clinical settings.
In the clinical practice guidelines (CPG) of the Korean Diabetes Association (KDA), screening for T2DM in non-pregnant adults (individuals 40 years and older or high-risk individuals aged 30 years and older) should be performed annually using FPG, a 75 g OGTT, or HbA1c [11]. Specifically, the KDA classifies prediabetes into two stages in the general population: stage 1 (FPG 100 to 109 mg/dL or HbA1c 5.7% to 6.0%) and stage 2 (FPG 110 to 125 mg/dL or HbA1c 6.1% to 6.4%). Based on these IFG criteria, the KDA recommends different action strategies in the clinical practice guidelines. For subjects with stage 1 IFG, the KDA recommends only FPG and HbA1c measurements every year. In addition, the 75 g OGTT is recommended in individuals with stage 2 IFG to detect undiagnosed diabetes immediately [11]. However, it is not clear if this recommendation is applicable for the overweight or obese population based on the same criteria.
Currently, the Korean Diabetes Prevention Study (KDPS), which is the first randomized controlled clinical trial to prevent T2DM in high-risk adult individuals with diabetes through intensive lifestyle management or metformin administration has been going on since July 2016 [12,13]. Subjects who are overweight or obese (body mass index [BMI] ≥ 23.0 kg/m2) with FPG ≥ 100 mg/dL were screened, after which a 75 g OGTT with HbA1c level measurement was performed. From this screening data, we analyzed and compared the three diagnostic results to detect diabetes according to the FPG stage.
The aim of this study was to investigate whether stage 1 and 2 criteria were applicable in the overweight or obese individuals of the IFG population in Korea.
METHODS
The study design of the KDPS has been described elsewhere [12,13]. In brief, the KDPS was divided into two intervention studies: a hospital-based (H-KDPS) and a community-based intervention study (C-KDPS). The H-KDPS is a prospective, multi-center, randomized, open-label controlled trial for preventing T2DM performed throughout 10 university-affiliated hospitals in Korea. The C-KDPS is a prospective, community-based randomized intervention trial for preventing T2DM that uses a web-based program conducted in two public health centers in Korea (Chungju and Suwon City). The baseline examination was performed between 1 July, 2016 and 31 October, 2018 for a 75 g OGTT with HbA1c determination and a cardiovascular risk factor assessment [12,13]. We analyzed the screening data of subjects aged 30 to 70 years with a BMI of ≥ 23.0 kg/m2 who also had IFG but no history of T2DM.
Exclusion criteria were as follows: previous diagnosis of diabetes or diabetes treatment; uncontrolled hypertension or significant ischemic heart disease requiring hospitalization within 6 months of enrollment; either heart failure, anemia, cancer requiring treatment in the past 5 years, or renal insufficiency; severe liver dysfunction or alcohol abuse; significant arthritis or psychiatric problems; either pregnant or planning to become pregnant; several medications (thiazide, beta blockers, steroid, immune-modulating agents, agents for weight reduction); and other systemic illnesses affecting the performance of this intervention program.
Data collection
After providing informed consent, subjects underwent a 75 g OGTT with HbA1c level measurement. Then, completed questionnaires regarding the medical history of chronic disease (i.e., hypertension, diabetes mellitus and dyslipidemia), smoking or alcohol use, and lifestyle habits as well as anthropometric measurements were obtained from the participants.
We calculated the BMI from body weight and height, which were measured by standard methods. Waist circumference was measured in the standing position at a level midway between the lowest rib and the iliac crest after normal respiration. Measurement was performed by well-trained examiners using a standard nonstretchable tape. Blood pressure (BP) was measured with the participant in the seated position for 30 minutes. We calculated the mean value of BP from three measurements with less than 5 mmHg differences. Smoking status was classified into three main categories: current smokers, ex-smokers, and never smoked. Additionally, the amount of cigarette smoking was evaluated by pack per day multiplied by years (pack-year). Alcohol intake was evaluated by the frequency and quantity of Korean distilled spirits, beer, wine, and sake intake during the previous 12 months, and quantification of alcohol use was estimated in terms of average drinking (grams of pure alcohol per day).
We analyzed data from the baseline OGTT and HbA1c measurements. All laboratory parameters, including lipid profiles, were measured after overnight fasting and evaluated in the central laboratory (Seegene Medical Foundation, Seoul, Korea). FPG and 2hr PG were determined with a Cobas C702 analyzer (Cobas 8000 C702, Roche, Mannheim, Germany) with a NaF-contained bottle. HbA1c was measured on the same day with a high-performance liquid chromatography method (Tosoh HLC-723 G8, Sysmex, Tokyo, Japan). Serum total cholesterol, triglycerides (TG), high-density lipoprotein cholesterol and low-density lipoprotein cholesterol were determined by using a chemistry analyzer (Cobas 8000 C702).
The hospital-based KDPS (H-KDPS) has been registered with the Clinical Research Information Service, Republic of Korea (KCT0002260). In addition, the community- based KDPS (C-KDPS) has been registered with the Clinical Research Information Service, Republic of Korea (KCT0001981). Both KDPS program protocols have also been reviewed and certified by the KDA and the Catholic University of Korea. This study was approved by the Institutional Review Board of St. Vincent’s Hospital (No. VC16MISI0003).
Definition
We defined diabetes and prediabetes according to the 2018 American Diabetes Association (ADA) recommendations. Diabetes was diagnosed based on plasma glucose criteria, either the FPG value of ≥ 126 mg/dL or the 2hr PG value of ≥ 200 mg/dL during a 75-g OGTT, or A1C value of ≥ 6.5%. We defined prediabetes as an FPG value of 100 to 125 mg/dL and/or a 2hr PG value of 140 to 199 mg/dL. Furthermore, the HbA1c criteria for diagnosing diabetes and prediabetes were ≥ 6.5% and 5.7% to 6.4%, respectively [14].
Statistical analysis
All data are expressed as mean ± standard deviation or number (%). Initial statistical analyses included descriptive statistics and an assessment of normality of distributions. Distribution of variables was assessed by evaluation of the Shapiro-Wilk’s test. Fisher’s exact test was used to determine significant differences in proportions among categorical variables. Univariate analysis of variance was used with the least significant difference post hoc tests in order to determine the clinical characteristic difference according to the level of FPG. Nonparametric statistical tests were performed for HbA1c, TG, alcohol intake and pack-years. Cohen’s Kappa (κ) statistics were used to find the agreement level between different definitions. Statistical analyses were performed using SAS version 9.3 (SAS Institute, Cary, NC, USA). A p < 0.05 was considered significant.
RESULTS
In total, 1,637 participants were included in this study. The average age was 55.0 ± 8.1 years, 45.9% were males, the mean BMI value was 26.3 ± 2.7 kg/m2, and 29.4% had hypertension. The mean FPG, 2hr PG, and HbA1c values were 104.1 ± 14.2 mg/dL, 163.0 ± 55.3 mg/dL, and 5.9 ± 0.5%, respectively (Table 1).

Clinical characteristics and biochemical parameters of the study subjects
Based on ADA criteria for the diagnosis of diabetes (FPG, 2hr PG, HbA1c), the percentages of study participants with normal glucose tolerance (NGT) and prediabetes were 13.5% and 59.3%, respectively. Among all participants, 446 (27.2%) patients were newly diagnosed with diabetes according to the ADA criteria. We detected diabetes in 106 (6.5%) participants using only FPG, 128 (7.8%) using only HbA1c, and 396 (24.2%) using only 2hr PG (Table 2, Fig. 1). If the criteria were combined, the ADA criteria could best diagnose diabetes (27.2%), as compared to the criteria of FPG + 2hr PG (25.6%) and FPG + HbA1c (11.1%) levels in overweight or obese subjects (Table 2). The kappa coefficient was 0.829 for FPG + 2 h PG, 0.631 for FPG + HbA1c, and 0.898 for 2hr PG + HbA1c (Supplementary Table 1).
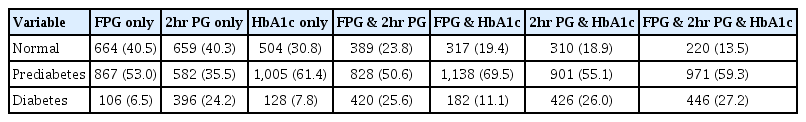
Proportion of pre-diabetes and diabetes by combination of diagnostic criteria
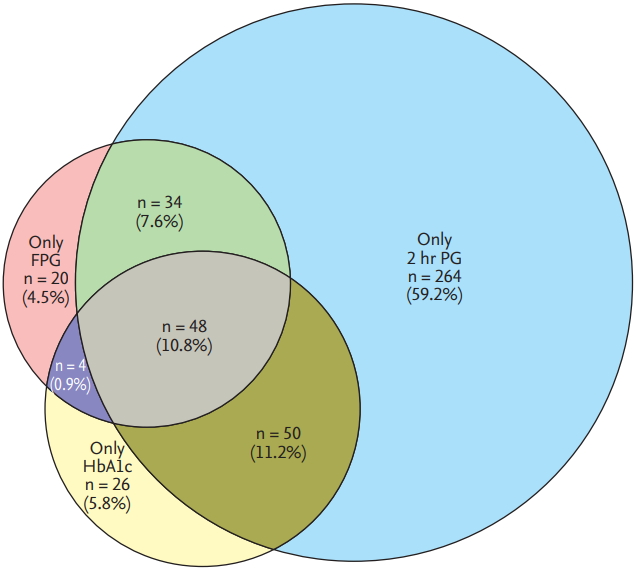
Proportional double Venn diagram. A proportional double Venn diagram has been used to quantify the distribution of fasting plasma glucose (FPG), 2-hour postchallenge glucose (2hr PG), and hemoglobin A1c (HbA1c) for the 446 subjects with newly-diagnosed diabetes among the overweight and obese population in this study.
We classified FPG levels into five categories from < 95 mg/dL to ≥ 126 mg/dL (< 95, 95 to 99, 100 to 109, 110 to 125, and ≥ 126 mg/dL), including stage 1 IFG (100 to 109 mg/dL) and stage 2 IFG (110 to 125 mg/dL) ranges (Table 3). The prevalence of diabetes increased with an increase in FPG category (p < 0.001). Among the whole population, 867 subjects (52.9%) demonstrated IFG (FPG, 100 to 125 mg/dL), and 515 (31.4%) and 352 (21.5%) subjects were included in stage 1 and stage 2 IFG ranges, respectively. The 19.0% of subjects with stage 1 IFG and 43.5% with stage 2 IFG showed 2hr PG levels of ≥ 200 mg/dL. In addition, of the 664 overweight and obese participants with a normal fasting glucose concentration (≤ 100 mg/ dL), 63 patients (9.5%) had diabetes (2hr PG ≥ 200 mg/ dL). When we lowered the FPG level to 95 mg/dL, 7.4% of subjects with FPG of < 95 mg/dL range and 12.6% with FPG of 95 to 99 mg/dL range were determined to have diabetes (2hr PG ≥ 200 mg/dL) (Table 3).
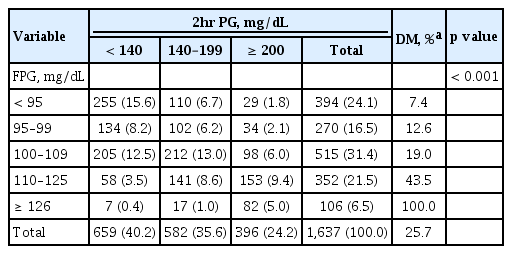
Comparison of the FPG and 2hr PG criteria for the diagnosis of diabetes
Mean HbA1c and BMI levels of subjects with stage 1 and 2 IFG were 5.8% ± 0.4% versus 6.1% ± 0.4% (p < 0.001) and 26.5 ± 2.9 kg/m2 versus 26.5 ± 2.5 kg/m2 (p = 0.003), respectively. Compared to the subjects with NGT, participants with IFG were more likely to be male, and had a higher BMI as well as higher systolic and diastolic BP levels. In addition, compared to subjects with stage 1 IFG, the mean systolic BP was higher in stage 2 IFG subjects (Table 4).

Clinical characteristics of subjects with IFG according to IGT
When we classified the study population into 3 BMI categories (23.0 ≤ BMI < 25.0 kg/m2; 25.0 ≤ BMI < 27.0 kg/m2, BMI ≥ 27.0 kg/m2), mean FPG and 2hr PG levels and a proportion of subjects with a family history of diabetes or hypertension were highest in the higher BMI group. By HbA1c definition, 7.1%, 7.2%, and 9.2% of subjects were classified as having diabetes, respectively. However, 18.5%, 29.0%, and 26.2% of participants were diagnosed with diabetes by 2hr PG criteria (Supplementary Table 2).
Even in overweight individuals with a normal fasting glucose level (< 100 mg/dL), 5.9% of subjects were diagnosed as having diabetes by the 2hr PG criteria. The 17.7% and 35.8% of overweight subjects with stage 1 and stage 2 were classified as having diabetes, respectively (Supplementary Table 3).
DISCUSSION
According to this population-based study recently performed among Korean adults with a high risk of diabetes, we found that overweight or obese individuals (BMI ≥ 23.0 kg/m2) with an IFG range (FPG, 100 to 125 mg/dL) should undergo an OGTT to exclude a diagnosis of diabetes. Without an OGTT, 19.0% of stage 1 and 43.5% of stage 2 IFG participants were not diagnosed with diabetes, and thus prompt intervention may be delayed for these overweight or obese individuals. Moreover, 9.5% of the population with a normal FPG level (< 100 mg/dL) showed a 2hr PG ≥ 200 mg/dL. Therefore, the active screening cut-off for the detection of diabetes in overweight or obese Korean adult individuals should be FPG value of ≥ 100 mg/dL.
Prediabetes is a long-term disorder, and thus there is sufficient time to perform an early diagnosis and intervention. In addition, although the condition may be reversible, it is associated with an increased risk of CVD [15,16]. An increasing number of patients with T2DM emphasizes the need for active screening of high-risk individuals and intensive lifestyle modification [17-19]. When considering data on prediabetes with no targeted intervention, the annual incidence of progression from prediabetes to T2DM is 5% to 10% [20].
Over the past 7 years, the prevalence of obesity (BMI ≥ 25.0 kg/m2) in the Korean population aged 20 years and older has increased steadily from 29.7% in 2009 to 32.4% in 2015, and the prevalence of abdominal obesity also increased from 18.4% in 2009 to 20.8% in 2015 [21]. With a continuous increase in the prevalence of obesity in individuals aged between 20 and 60 years, the incidence of T2DM also increased even from the lowest level of BMI [21]. Although being overweight or obese is a very important comorbidity and risk factor for T2DM, BMI has not yet been considered as a screening tool for T2DM. Only FPG and HbA1c levels have been considered as screening tests for diabetes. If a simple and easily measurable clinical variable is combined with FPG and HbA1c measurement when screening for T2DM, more patients with diabetes could be detected without delay. From this point of view, BMI or waist circumference among other anthropometric parameters could be an appropriate and effective clinical factor for this purpose [22].
Current recommendations to screen for diabetes are inconsistent across different guidelines. According to the ADA recommendation, testing for prediabetes and risk for future diabetes in asymptomatic people should be considered in adults of any age who are overweight or obese (BMI ≥ 25.0 or ≥ 23.0 kg/m2 for Asian Americans) and those who have ≥ 1 additional risk factors for diabetes [14]. According to the Japan Diabetes Society (JDS), the IFG category is defined as FPG levels of 110 to 125 mg/dL, and an FPG range of 100 to 109 mg/dL is classified into the ‘high normal’ category, falling within normal levels. However, subjects with a high-normal glucose level are at risk for developing diabetes and represent various degrees of IFG. Therefore, the OGTT is proactively considered for high-risk individuals (HbA1c ≥ 5.6%, obesity, dyslipidemia, family history of diabetes) [23].
The FPG cut-off values are far from being equivalent to their corresponding 2hr PG values [24]. In fact, the majority of subjects with FPG ≥ 100 mg/dL display normal or non-diabetic 2hr PG. More importantly, a consistent proportion of subjects with IGT display an FPG level ≤ 100 mg/dL [25,26]. Furthermore, in longitudinal epidemiological studies, around 40% of subjects who develop T2DM exhibit NGT at baseline blood glucose testing, indicating that there is a large number of NGT subjects who constitute the larger pool of future T2DM populations [27].
Since there is a large discordance rate in the diagnosis of diabetes and IGT using the FPG and 2hr PG criteria, the CPG of the KDA has classified subjects with IFG into two stages according to their FPG levels (stage 1 IFG [100 to 109 mg/dL] and stage 2 IFG [110 to 125 mg/dL]) to screen for those with a high risk of diabetes in the general population during the last decade [28]. This classification was based on four population-based studies conducted from 1993 to 2000 [29]. Their mean age and BMI levels were 52.1 years and 23.8 kg/m2, respectively. From the analysis, seven times more individuals with stage 2 IFG were diagnosed with diabetes as determined by 2hr PG, compared to stage 1 IFG in the general population (14.1% vs. 1.9%, p < 0.05). Based on the previous report, individuals with stage 2 IFG should be treated differently from those with stage 1 IFG. To detect more cases of diabetes, the OGTT is recommended for all individuals with stage 2 IFG as well as for cases with stage 1 IFG with some additional risk factors for diabetes.
Compared to a previous KDA report performed approximately 20 years ago, this recent study showed remarkable and important findings on the screening of diabetes. In the general population, the prevalence of diabetes in the normal FPG range (< 100 mg/dL) and stage 1 IFG was 1.2% and 1.9%, respectively. However, in the overweight or obese population, the corresponding proportions were 9.5% and 19.0%, respectively. Moreover, 43.5% of stage 2 IFG subjects were diagnosed with diabetes based on the 2hr PG criteria. From this result, we suggest that classification of stage 1 or 2 IFG does not have much meaning in the screening of diabetes in overweight or obese Korean individuals with IFG. Moreover, the FPG cutoff needs to be lower than 100 mg/dL in individuals who are overweight or obese. Even in subjects with FPG < 95 mg/dL, 7.4% of overweight or obese subjects were not diagnosed as having diabetes without an OGTT.
Korea has a national health screening examination service provided by the National Health Insurance Service, and adults aged 40 years and older have the opportunity to check their FPG concentration. Although the recommended screening measure for prediabetes consists of FPG, HbA1c, and the 2hr PG after OGTT, OGTT sampling is not feasible as a routine health check-up. However, the OGTT should be actively considered for Korean adults who are overweight or obese to allow for early detection of diabetes and prompt intervention.
There were some limitations in this study. First, glucose tolerance was determined on only one occasion. This could lead to a misclassification of glucose tolerance. We believe that such misclassification would affect all categories of glucose tolerance equally. Second, the prevalence of diabetes was calculated only by FPG and 2hr PG criteria, and the HbA1c level was not considered. In spite of this limitation, this study suggested that the FPG levels for the screening of diabetes should be lowered in overweight or obese individuals.
In conclusion, the prevalence and incidence of T2DM and obesity are steadily increasing in Korea, especially in young and middle-aged adults. To prevent a progression from prediabetes to T2DM, active screening with OGTT is needed in overweight or obese individuals with an FPG level of ≥ 100 mg/dL. Further investigation on the cutoff level of FPG in this group for the early detection of diabetes is warranted.
KEY MESSAGE
1. Overweight or obese individuals (body mass index ≥ 23.0 kg/m2 ) with an impaired glucose tolerance range (fasting plasma glucose [FPG], 100 to 125 mg/dL) should undergo an oral glucose tolerance test to exclude a diagnosis of diabetes.
2. Active screening with 75 g oral glucose tolerance test is required in overweight or obese individuals with an FPG level of ≥ 100 mg/dL to search for the presence of diabetes.
Notes
No potential conflict of interest relevant to this article was reported.
Acknowledgements
This study was funded by the Korean Health Technology R&D Project, Ministry of Health and Welfare, Republic of Korea (HC15C3364). The research team would like to thank the Korean Diabetes Association, and two healthcare centers of Chungju city and Paldal-gu, Suwon, Korea.
The full list of all participating university hospitals and contributors is as follows: Korean Diabetes Prevention Study. Moon-Kyu Lee (Department of Medicine, Samsung Medical Center, Sungkyunkwan University School of Medicine, Seoul, Korea), Kyong Soo Park (Department of Internal Medicine, Seoul National University College of Medicine, Seoul, Korea), Bong Soo Cha (Department of Internal Medicine, Yonsei University College of Medicine, Seoul, Korea), Sei-Hyun Baik (Division of Endocrinology and Metabolism, Department of Internal Medicine, Korea University Medical Center, Korea University College of Medicine, Seoul, Korea), Joong Yeol Park (Department of Internal Medicine, Asan Medical Center, University of Ulsan College of Medicine, Seoul, Korea), Kwan Woo Lee (Department of Endocrinology and Metabolism, Ajou University School of Medicine, Suwon, Korea), In-Kyu Lee (Division of Endocrinology and Metabolism, Department of Internal Medicine, Kyungpook National University School of Medicine, Daegu), Tae Sun Park (Department of Internal Medicine, Chonbuk National University Hospital, Chonbuk National University Medical School, Jeonju, Korea), In Joo Kim (Department of Nuclear Medicine and Biomedical Research Institute, Pusan National University Hospital, Pusan National University School of Medicine, Busan, Korea), Young Jung Cho (Department of Internal Medicine, National Medical Center, Seoul), Dong Hyeok Cho (Division of Endocrinology and Metabolism, Department of Internal Medicine, Chonnam National University Hospital, Chonnam National University Medical School, Gwangju, Korea), Sung Wan Chun (Department of Internal Medicine, Soonchunhyang University Cheonan Hospital, Soonchunhyang University College of Medicine, Cheonan, Korea), So Hun Kim (Department of Internal Medicine, Inha University School of Medicine, Incheon, Korea), Seo Young Sohn (Division of Endocrinology, Department of Medicine, Myongji Hospital, Goyang, Korea), You Cheol Hwang (Department of Endocrinology and Metabolism, KyungHee University Hospital at Gangdong, Kyung-Hee University School of Medicine, Seoul, Korea), Eunjeong Kang (Department of Endocrinology and Metabolism, Kyung Hee University Hospital, Kyung Hee University School of Medicine, Seoul, Korea), and Jihye Choi (Department of Endocrinology and Metabolism, Kyung Hee University Hospital, Kyung Hee University School of Medicine, Seoul, Korea).