Immunological measurement of aspartate/alanine aminotransferase in predicting liver fibrosis and inflammation
Article information
Abstract
Background/Aims
Enzymatic analysis of aspartate/alanine aminotransferase (AST/ALT) does not exactly represent the progression of liver fibrosis or inflammation. Immunoassay for AST (cytoplasmic [c] AST/mitochondrial [m] AST) and ALT (ALT1/ALT2) has been suggested as one alternatives for enzymatic analysis. The objective of this study was to evaluate the efficacy of immunoassay in predicting liver fibrosis and inflammation.
Methods
A total of 219 patients with chronic hepatitis B (CHB) who underwent hepatic venous pressure gradient (HVPG) and liver biopsy before antiviral therapy were recruited. Serum samples were prepared from blood during HVPG. Results of biochemical parameters including enzymatic AST/ALT and immunological assays of cAST, mAST, ALT1, and ALT2 through sandwich enzyme-linked immunosorbent assay (ELISA) immunoassay with fluorescence labeled monoclonal antibodies were compared with the results of METAVIR stage of live fibrosis and the Knodell grade of inflammation.
Results
METAVIR fibrosis stages were as follows: F0, six (3%); F1, 52 (24%); F2, 88 (40%); F3, 45 (20%); and F4, 28 patients (13%). Mean levels of AST and ALT were 121 ± 157 and 210 ± 279 IU/L, respectively. Mean HVPG score of all patients was 4.7 ± 2.5 mmHg. According to the stage of liver fibrosis, HVPG score (p < 0.001, r = 0.439) and ALT1 level (p < 0.001, r = 0.283) were significantly increased in all samples from patients with CHB. ALT (p < 0.001, r = 0.310), ALT1 (p < 0.001, r = 0.369), and AST (p < 0.001, r = 0.374) levels were positively correlated with Knodell grade of inflammation.
Conclusions
ALT1 measurement by utilizing sandwich ELISA immunoassay can be useful method for predicting inf lammation grade and fibrosis stage in patients with CHB.
INTRODUCTION
Aspartate aminotransferase (AST) and alanine aminotransferase (ALT) participate in intermediary metabolism and in liver gluconeogenesis [1]. AST can be detected in the liver, heart, muscle, kidneys, brain, and blood cells. ALT is found in plasma and other body organs, although it is most commonly found in the liver. AST and ALT are released by liver tissue into circulation in proportion to the degree of hepatocellular damage due to toxic substances, viral infections, or other causes of liver damage [2]. In most types of liver disease, serum ALT exhibits greater enzymatic activity than serum AST [3]. In clinical laboratories, serum AST and ALT activities are commonly measured by enzymatic assay in which transamination reaction is coupled to a secondary reaction that reduces pyruvate into lactate via lactate dehydrogenase [4].
The development of an accurate diagnostic method is critical for early detection and proper treatment of liver disease, because patients are often asymptomatic until their livers have deteriorated severely [5]. Most liver diseases can be diagnosed by enzymatic method for serum AST and ALT [6,7]. However, the enzymatic method does not represent the state of liver fibrosis. It can cause misdiagnosis in patients with chronic liver diseases such as fatty liver disease, cirrhosis, and hepatocellular carcinoma [8]. Although the definition of chronic hepatic injury by increased ALT is widely accepted, most patients with liver cirrhosis (LC) have persistently normal or mild elevated ALT.
Earlier studies have indicated there are two isoforms of ALT. ALT1 is mainly expressed in the liver and kidney while ALT2 is mainly expressed in the pancreas, brain, adrenal gland, skeletal muscle, and heart [9]. Two types of AST (isoenzymes) have also been found in animal tissues, one in the mitochondria (mAST) and the other in the cytosol matrix (cAST) [10]. Although they differ markedly in primary structure and chemical property, both mAST and cAST can catalyze the same reaction with subtly different catalytic steps [11,12].
Previous reports have suggested that ALT-immunoglobulin complex increased according to the severity of liver disease, and that high concentration of mAST might indicate a severely damaged liver [4,13]. Therefore, immunoassay might be useful as a screening method for differential diagnosis of liver fibrosis according to patients. The objective of the present study was to determine the efficacy of immunoassay in predicting liver fibrosis and inflammation in patients with chronic hepatitis B (CHB).
METHODS
Patients and diagnosis
Between January 2007 and December 2010, 271 patients with CHB, who simultaneously underwent hepatic venous pressure gradient (HVPG) and liver biopsy for the routine check-up prior to antiviral treatment, were prospectively recruited. Patients were selected according to inclusion criteria with CHB. Some of them were then excluded according to following exclusion criteria: (1) those with other cause of liver disease; (2) those with decompensated cirrhosis; or those who received antiviral treatment within the previous 6 months. Fifty-two patients with evidence of decompensated LC such as HVPG > 10 mmHg, ascites, or varix were excluded. Finally, a total of 219 patients with CHB were enrolled in the study. Their baseline characteristics are summarized in Table 1. None of these CHB patients had evidence of LC at initial time, verified by abdominal ultrasound, endoscopy, or neurological examination. The diagnosis of LC was established by a liver biopsy and/or imaging studies such as ultrasound and/or contrast-enhanced computed tomography in conjunction with laboratory results and clinical complications of cirrhosis (presence of ascites, hepatic encephalopathy, and esophageal varices). Decompensated LC was diagnosed according to the current definition in the presence of ascites, portal hypertensive gastrointestinal bleeding, encephalopathy, or jaundice [14,15].

Baseline patient characteristics
Protocols for this study conform to the ethical guidelines established by the 2013 Declaration of Helsinki as reflected in a priori approval by the Institutional Review Board for Human Research (2007-02). Informed consent to participate in the study was obtained from each patient (ClinicalTrials.gov Identifier: NCT03562585) (Fig. 1).

Study design. HVPG, hepatic venous pressure gradient; Bx, biopsy; CHB, chronic hepatitis B; ELISA, enzyme-linked immunosorbent assay; cAST, cytoplasmic aspartate aminotransferase; mAST, mitochondrial aspartate aminotransferase; ALT, alanine aminotransferase.
Researchers of this study conducted baseline evaluations which included family and alcohol history, X-ray, electrocardiography, electrolyte, liver function test, complete blood count, and virus markers. Serum biochemical parameters included total bilirubin, ALT, haptoglobin, AST, international normalized ratio (INR), albumin, blood urea nitrogen, creatinine, gamma glutamyl transpeptidase, alkaline phosphatase, α-fetoprotein, prothrombin time, blood glucose, triglycerides, and total cholesterol. Markers of hepatitis virus (hepatitis B virus surface antigen [HBsAg], hepatitis B surface antibody [anti-HBs], Hepatitis B e antibody [anti-HBe], hepatitis B virus [HBV] DNA, hepatitis B core antibody [anti-HBc], hepatitis B e antigen [HBeAg], anti-hepatitis C virus [HCV], and HCV RNA) were also checked.
HVPG measurement
HVPG measurement was performed by two hepatologists (K.T.S.). A 6 French balloon catheter was placed in the right hepatic venous (HV) through a right jugular vein puncture to measure free HV pressure. Wedged hepatic venous pressure (WHVP) was measured by inflating the balloon catheter at the right HV or middle hepatic vein. Subsequently, HVPG was determined by subtracting the free HV pressure from the WHVP. The procedure allowed at least 1 minute for the WHVP and 15 seconds for free HV pressure stabilization. The average was taken from three separate readings. For cases with the presence of a shunt, the measurement was taken at a different location to minimize error [16].
Sandwich enzyme-linked immunosorbent assay
A sandwich enzyme-linked immunosorbent assay (ELISA) system was used to measure enzymatic activity of ALT, AST, and immunologic activity of ALT1, ALT2, mAST, cAST using serum samples. A 96-well micro-plate was coated with capture antibodies in coating buffer (100 μL/well) and subsequently incubated at 4°C overnight. After washing with phosphate buffered saline-Tween (PBS-T) 0.05% three times, plates were blocked with 5% skimmed milk in PBS-T (200 μL/well) at 37°C for 2 hours. After another washing step, a 100 μL sample solution was added to each well, and the microplates were incubated at 37°C for 1 hour. After 100 μL of horseradish peroxidase-labeled anti-ALT, ALT1, ALT2, AST, cAST, or mAST antibody was added to each well, these micro-plates were incubated at 37°C for 1 hour. After washing three times, 3,3’,5,5’-tetramethylbenzidine (TMB) substrate solution was added to each well and reacted at 37°C for 15 minutes in the dark. The reaction was stopped by adding 2 M sulfuric acid (50 μL/well). Absorbance was measured at wavelength of 450 nm. All samples were processed in duplicates.
Histology
A percutaneous liver biopsy (ultrasound guided) was performed using an 18-gauge needle. Biopsy specimens were fixed with 10% formalin, routinely embedded in paraffin, and sectioned. These sections were processed for hematoxylin and eosin, Masson's trichrome, or reticulin fiber staining. Necroinflammatory change and liver fibrosis of all biopsy specimens were evaluated using Knodell grade and METAVIR scoring system, respectively. The Knodell grade includes three subcategories: periportal necrosis and inflammation, scored from 0 to 10; intralobular necrosis and inflammation, scored from 0 to 4; and portal inflammation, scored from 0 to 4 [17,18]. Fibrosis was scored from 0 to 4 as follows: F0, no fibrosis; F1, enlarged fibrotic portal tracts; F2, enlargement of portal tracts with rare periportal or portal-portal septa; F3, numerous septa without cirrhosis; and F4, cirrhosis [17,19].
Statistical analysis
Quantitative data were expressed as mean ± standard deviation unless otherwise stated. The correlation of HVPG and liver biopsy results was evaluated using Pearson bivariate correlations analysis and expressed box plot. The diagnostic difference between HVPG and biopsy was evaluated by McNemar’s test (matched-pair data) [20]. Age, gender, and some risk factors (p < 0.10) identified by the univariate analysis were entered into multivariate analysis using stepwise forward selection. Results from these analyses were used to develop a model for the diagnosis of stage 1 compensated LC based on findings of HVPG alone, biopsy alone, and both HVPG and biopsy. All statistical tests were two sided and performed with SPSS software version 19.0 (IBM Co., Armonk, NY, USA). For all tests, a p value of less than 0.05 was considered to be statistically significant.
RESULTS
Patient characterization
The mean age of all patients was 39.7 ± 11.3 years. The mean levels of AST and ALT were 121 ± 157 and 210 ± 279 IU/L, respectively. The average HVPG score for all patients was 4.7 ± 2.5 mmHg. Twelve biopsy specimens (5.4%) showed discordance in pathology. A consensus was reached through discussions for cases showing discordance. The distribution of the METAVIR fibrosis stages were as follows: F0, six (3%); F1, 52 (24%); F2, 88 (40%); F3, 45 (20%); and F4, 28 patients (13%). The distribution of Knodell inflammation grade were: G0, 15 (7%); G1, 62 (28%); G2, 82 (38%); G3, 57 (26%); and G4, 3 (1%) (Table 1).
Patients with LC on HVPG and biopsy were significantly older than those in other groups. Platelet count and albumin levels were remarkably higher in patients with LC diagnosed through HVPG alone compared to those in patients with LC diagnosed with liver biopsy alone. There were no significant differences in other variables between the two groups of patients (p > 0.05). In the analysis of the HVPG score according to ALT level, the ALT level did not affect the HVPG score (p > 0.05).
HVPG score according to METAVIR fibrosis stage
The mean level of HVPG score was positively correlated with the METAVIR fibrosis score (p < 0.001, r = 0.439) (Fig. 1). There were significant stepwise differences among METAVIR stage 1, 2, and 3. However, there were no significant differences between METAVIR stage 0 and stage 1. This result was seen in the relationship between METAVIR stages 3 and 4 (p > 0.05). Fifty-seven and 28 patients were diagnosed as stage 1 compensated LC through HVPG and biopsy, respectively. Twenty patients were diagnosed as stage 1 compensated LC diagnosed with both HVPG and biopsy. In general, there were significant differences between the two methods for the diagnosis of stage 1 compensated LC in patients with CHB (p < 0.01) (Fig. 2).

Hepatic venous pressure gradient (HVPG) score according to METAVIR score.
Correlation between ALT level and METAVIR stage
Mean levels of ALT (IU/L) according to fibrosis stage were F0 (41.2), F1 (149.9), F2 (200.4), F3 (242.8), and F4 (214.1) in each fibrosis stage (p = 0.135, r = 0.101), showing no significant correlation. ALT1 levels (ng/mL) according to fibrosis stage were F0 (19.6), F1 (101.5), F2 (147.2), F3 (165.6), and F4 (277.8), showing significant correlation (p < 0.001, r = 0.283). ALT2 levels (ng/mL) according to fibrosis stage were F0 (90.1), F1 (112.3), F2 (109.2), F3 (106.5), and F4 (86.8), showing no significant correlation (p = 0.112, r = 0.108). Mean level of ALT1 + ALT2 (ng/mL) according to fibrosis stage were F0 (91.9), F1 (169.3), F2 (216.0), F3 (242.5), and F4 (349.8), showing significant correlation (p < 0.001, r = 0.258). The ALT + ALT1 + ALT2 in each fibrosis stage were F0 (150.8), F1 (360.8), F2 (456.7), F3 (514.9), and F4 (578.6), showing significant correlation (p = 0.001, r = 0.216). Although ALT or ALT2 did not show significant correlation with METAVIR stages, ALT1, ALT1 + ALT2, and ALT + ALT1 + ALT2 were significantly related with the METAVIR stage (Fig. 3).
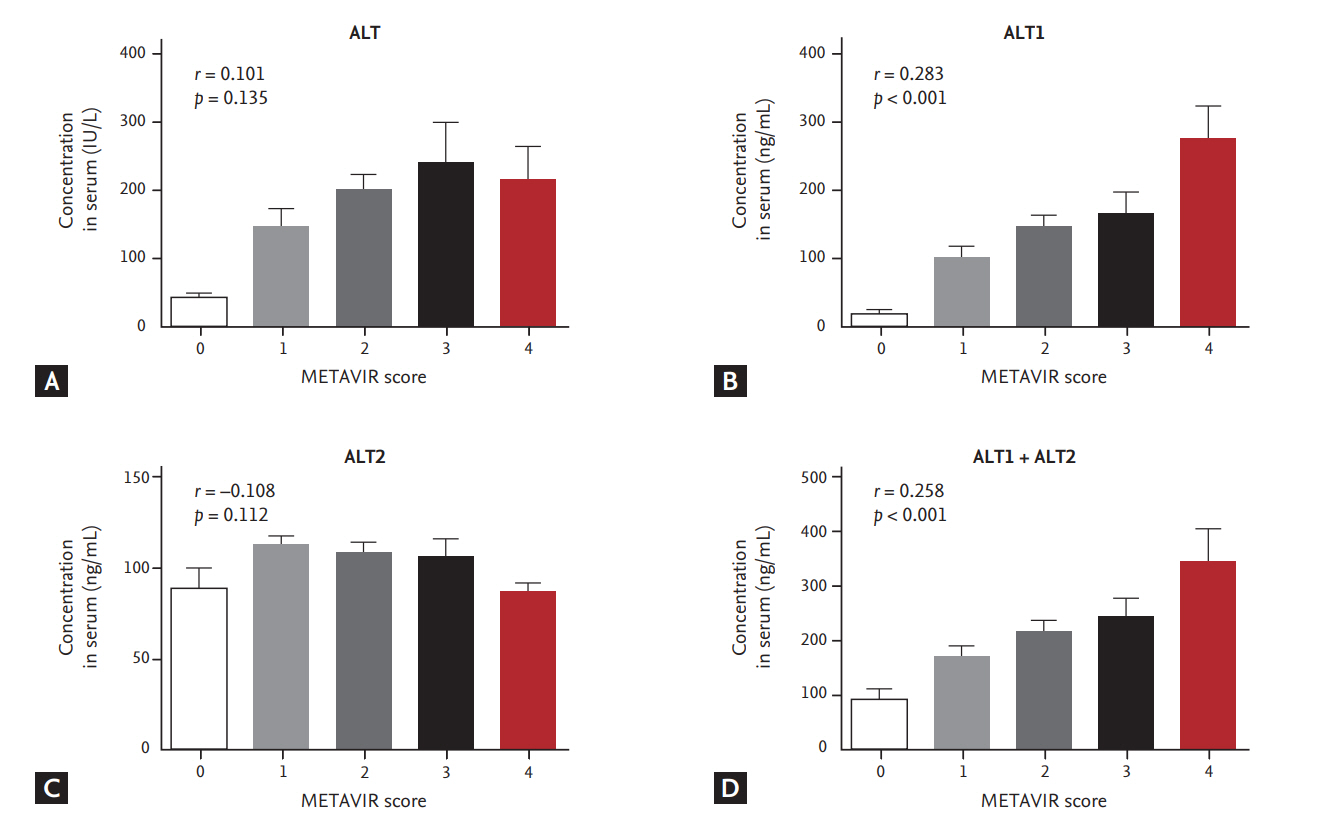
Distribution of alanine aminotransferase (ALT) mass concentration with METAVIR score. Serum samples were measured side by side for ALT concentration with an immunoassay. (A) Immunoassay of enzymatic ALT with METAVIR score. (B) Immunoassay of immunologic ALT1 with METAVIR score. (C) Immunoassay of immunologic ALT2 with METAVIR score. (D) Immunoassay of immunologic ALT1 + ALT2 with METAVIR score.
Correlation between ALT level and Knodell grade
For inflammation grades G0, G1, G2, G3, and G4, mean levels of ALT (IU/L) were 75.2, 126.9, 197.6, 261.6, and 911, respectively, showing significant correlation (p < 0.001, r = 0.310). ALT1 levels (ng/mL) according to Knodell grade were G0 (54.5), G1 (94.5), G2 (142.1), G3 (237.2), and G4 (549.9), showing significant correlation (p < 0.001, r = 0.369). ALT2 levels (ng/mL) according to inflammation grades were G0 (99.4), G1 (105.2), G2 (108.8), G3 (105.6), and G4 (94.6), showing no significant correlation (p = 0.771, r = 0.020). ALT1 + ALT2 levels (ng/mL) according to inflammation grade were determined as follows: G0 (139.9), G1 (159.8), G2 (208.1), G3 (316.8), and G4 (641.5), showing significant correlation (p < 0.001, r = 0.337) and levels of ALT + ALT1 + ALT2 were shown as G0 (229.2), G1 (326.5), G2 (448.5), G3 (604.4), and G4 (1552.5) (p < 0.001, r = 0.359). Although ALT2 did not show significant correlation with Knodell grade of inflammation, ALT, ALT1, ALT1 + ALT2, and ALT + ALT1 + ALT2 levels were significantly correlated with Knodell grade of inflammation (Fig. 4).
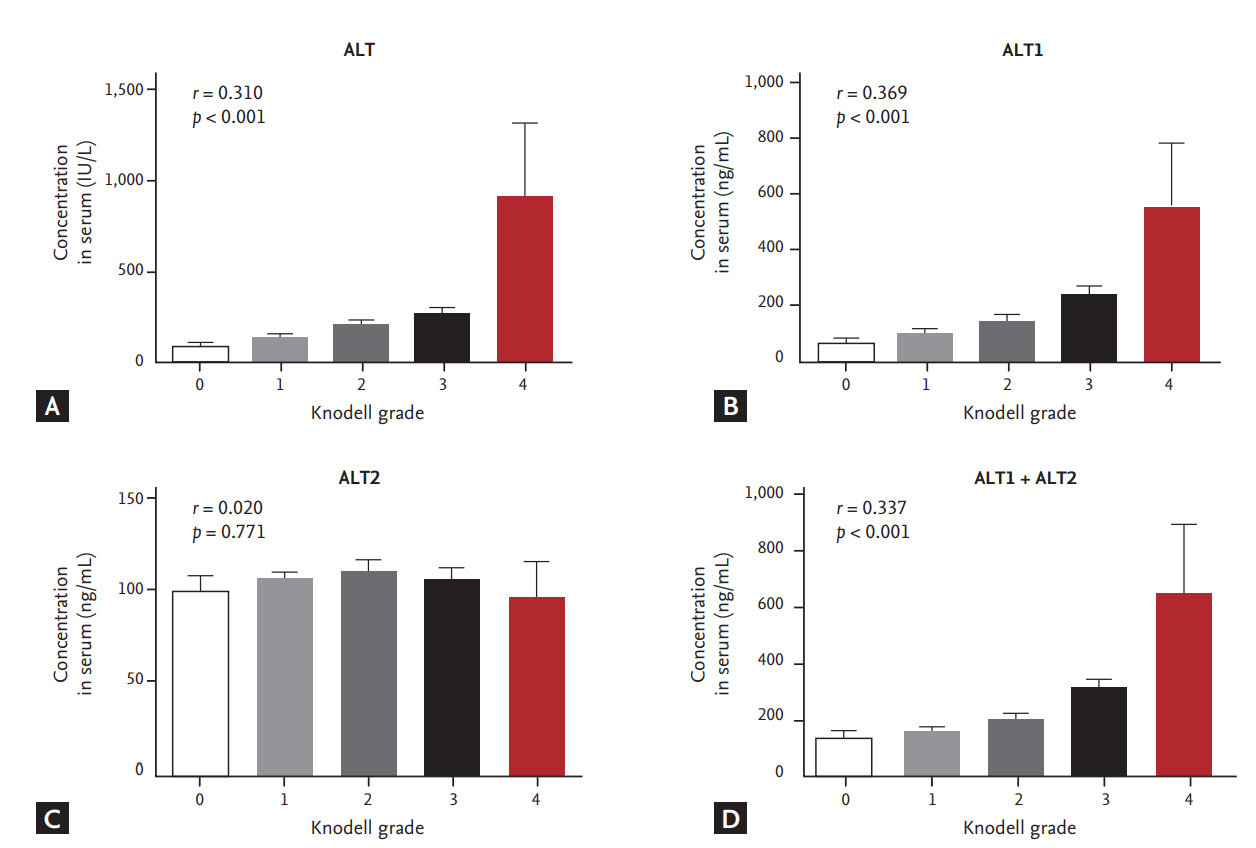
Distribution of alanine aminotransferase (ALT) mass concentration with Knodell grade. Serum samples were measured side by side for ALT concentration with an immunoassay. (A) Immunoassay of enzymatic ALT with Knodell grade. (B) Immunoassay of immunologic ALT1 with Knodell grade. (C) Immunoassay of immunologic ALT2 with Knodell grade. (D) Immunoassay of immunologic ALT1 + ALT2 with Knodell grade.
Correlation between AST and METAVIR stage
AST levels (IU/L) according to fibrosis stage were as follows: F0 (39.6), F1 (72.6), F2 (107.6), F3 (109.4), and F4 (156.9), showing no significant correlation (p = 0.103, r = 0.110), Levels of cAST (ng/mL) according to fibrosis stage were F0 (79.9), F1 (68.5), F2 (90.9), F3 (99.9), and F4 (102.5) (p = 0.254, r = 0.077). The mean levels of mAST (ng/mL) were observed as F0 (19.3), F1 (31.4), F2 (18.9), F3 (32.6), and F4 (38.8) (p = 0.164, r = 0.094), and levels of cAST + mAST (ng/mL) were shown as F0 (99.2), F1 (99.9), F2 (106.1), F3 (145.2), and F4 (147.6) in each fibrosis stage (p = 0.181, r = 0.091). The mean levels of AST, cAST, mAST, and cAST + mAST did not show correlation with the Knodell grade (Fig. 5).

Distribution of aspartate aminotransferase (AST) mass concentration with METAVIR score. Serum samples were measured side by side for AST concentration with an immunoassay. (A) Immunoassay of enzymatic AST with METAVIR score. (B) Immunoassay of immunologic cytoplasmic AST (cAST) with METAVIR score. (C) Immunoassay of immunologic alanine aminotransferase 2 (ALT2) with METAVIR score. (D) Immunoassay of immunologic cAST + mitochondrial AST (mAST) with METAVIR score.
Correlation between AST and Knodell grade of inflammation
Mean levels of AST (IU/L) according to Knodell inflammation grade were G0 (59.8), G1 (66.7), G2 (99.6), G3 (158.8), and G4 (492.0), showing significant correlation (p < 0.001, r = 0.374). Levels of cAST (ng/mL) according to Knodell inflammation grade were G0 (98.34), G1 (64.02), G2 (97.86), G3 (99.85), and G4 (79.5), showing no significant correlation (p = 0.227, r = 0.082). Levels of mAST levels according to Knodell grade were G0 (37.9), G1 (20.9), G2 (26.4), G3 (30.6), and G4 (35.6), showing no significant correlation (p = 0.477, r = 0.048). Levels of cAST + mAST levels (ng/mL) according to Knodell grade were G0 (136.2), G1 (84.9), G2 (124.3), G3 (130.4), and G4 (115.1), showing no significant correlation (p = 0.216, r = 0.084). Mean levels of AST + cAST + mAST according to inflammation grade were: G0 (169.04), G1 (151.62), G2 (223.85), G3 (289.23), and G4 (607.1), showing significant correlation (p < 0.001, r = 0.286). Thus mean levels of cAST, mAST, and cAST + mAST did not show significant correlation with the Knodell grade of inflammation. However, the levels of AST and AST + cAST + mAST were significantly correlated with Knodell grade of inflammation (Fig. 6).

Distribution of aspartate aminotransferase (AST) mass concentration with Knodell grade. Serum samples were measured side by side for AST concentration with an immunoassay. (A) Immunoassay of enzymatic AST with Knodell grade. (B) Immunoassay of immunologic cytoplasmic AST (cAST) with Knodell grade. (C) Immunoassay of immunologic alanine aminotransferase 2 (ALT2) with Knodell grade. (D) Immunoassay of immunologic cAST + mitochondrial AST (mAST) with Knodell grade.
DISCUSSION
Although HVPG is an invasive procedure, it is known as the best predictor for the development of varices and harbinger of decompensation [21-23]. In the present study, HVPG measurement showed a positive correlation with the fibrosis stage (r = 0.439). Previous reports have suggested that HVPG is a better diagnostic modality than serologic biomarkers in the prediction of advanced fibrosis [24]. Garcia-Tsao et al. [25] have reported that a significant proportion of patients who did not have cirrhosis according to histological diagnosis, had HVPG > 6 mmHg. In another study, HVPG was strongly correlated with biopsy results, with HVPG 6 mmHg demonstrating 78 % and 81 % accuracy in terms of sensitivity and specificity for the diagnosis of stage 1 compensated LC [26]. These results suggest that clinicians may consider performing HVPG measurement for the diagnosis of liver fibrosis in patients with CHB.
Although ALT has represented hepatocyte injury, most patients with LC have persistently normal ALT. Therefore, level of ALT has not been used as a marker for the diagnosis of chronic liver disease. In this study, measured results of ALT1 using immunologic assay showed significant correlation with fibrosis stage and inflammation grade in patients with CHB (Figs. 3B and 5B). Other studies using isoforms of ALT to analyze and diagnose of chronic liver disease or fibrosis have not been reported yet. Some previous studies demonstrated that the amount of the ALT-immunoglobulin complex is increased with the severity of liver disease [4]. Taken together, total ALT level might increase according to the progression of liver disease. Thus, the detection of ALT1 alone with its isoforms by immunoassay may be useful for the diagnosis of fibrosis and inflammation of liver disease.
Enzymatic measurements of ALT and AST were positively correlated with inflammation grade (r = 0.310 and r = 0.374, respectively) in patients with CHB (Figs. 4A and 6A). This result is consistent with the findings of a previous study. Early studies have suggested that a high AST/ALT ratio may be used as a biological marker in the diagnosis of inflammation [6,7]. Currently, clinicians are using AST/ALT ratio for the diagnosis of specific liver disease. Wong et al. [27] have suggested that a combined algorithm involving AST to platelet ratio index (APRI) and AST/ALT could improve the accuracy in predicting advanced liver fibrosis. Therefore, enzymatic measurements of ALT and AST, according to inflammation grade, may be useful in the diagnosis of liver disease.
In most types of liver disease, serum ALT exhibits greater enzymatic activity than serum AST. ALT activity has been considered as a more sensitive marker of hepatocellular injury and liver disease progression than AST activity [3]. However, the development of an accurate diagnostic method is critical for early detection and proper treatment of liver disease because patients are often asymptomatic until their livers have deteriorated severely. In this study, we developed a sandwich immunoassay that uses murine monoclonal antibodies generated against human recombinant ALT1, ALT2, cAST, and mAST protein [4,13].
Immunologic assay of ALT2, cAST, or mAST did not show correlation with the fibrosis stage and inflammation grade. Mean levels of ALT2 were negatively correlated with fibrosis stage (r = –0.108). However, they showed similarity in inflammation grade (r = 0.020). cAST + mAST levels were positively correlated with fibrosis stage, although the correlation was not statistically significant (r = 0.107) (Fig. 4D). They were significantly correlated with inflammation grade (r = 0.084) (Fig. 6D). Therefore, detection of ALT2, cAST, mAST, and cAST + mAST using immunoassay of may not be effective for the diagnosis of liver disease.
In general, serological markers such as AST/ALT used for the diagnosis of chronic liver disease have been found to have limited diagnostic value [28]. Thus, serological markers might only be utilized as supplementary information to clinicians. Although they cannot replace needle biopsy, serological tests may provide clinicians with important information regarding staging fibrosis. They may also play a role in determining the selection and timing of treatment [29-31]. ALT1 is a good candidate for the diagnosis of liver fibrosis and inflammation.
Nowadays, non-invasive methods involving elastography, magnetic resonance elastography, fibroscan, or contrast-enhancing ultrasound are available in the diagnosis of advanced fibrosis [27,32-34]. In the near future, the incorporation of genetics, proteomics, or metabolomics might allow us to identify liver fibrosis and inflammation. Further evaluation of novel markers is required to improve the accuracy of both diagnosis and treatment.
This study suggested several significantly correlation with fibrosis stage or inflammation grade. However, this study has limitations. Because evaluation criteria of all data were only mean values, low abundances of detection unit were observed in advanced fibrosis stage or inflammation grade while high abundances was observed in low stage or grade.
In conclusion, this study suggested that significantly correlated immunologic assay of ALT1 with fibrosis stage and inflammation grade might help diagnose various liver diseases in patients with CHB. Further studies are needed to understand the correct methods of using ALT and its individual isoforms for the diagnosis of liver disease in patients with CHB.
KEY MESSAGE
1. Alanine aminotransferase 1 (ALT1) measurement by utilizing sandwich enzyme-linked immunosorbent assay (ELISA) immunoassay can be useful method not only in predicting inflammation grade but also fibrosis stage in patients with chronic hepatitis B (CHB).
2. Hepatic venous pressure gradient measurement is necessary in the diagnosis of liver fibrosis in patients with CHB.
Notes
No potential conflict of interest relevant to this article was reported.
Acknowledgements
This study was funded by Hallym University Specialization Fund (HRF-S-53). This research was supported through a grant from Basic Science Research Program through the National Research Foundation of Korea (NRF) funded by the Ministry of Education, Science and Technology (NRF-2018M3A9F3020956 and NRF2018M3A9F3020942). This research was supported by Hallym University Research Fund and Hallym University Research Fund 2016 (HURF-2016-60).