The usefulness of fecal calprotectin in assessing inflammatory bowel disease activity
Article information
Abstract
Background/Aims
Fecal calprotectin (FC) is known to correlate with disease activity and can be used as a predictor for relapse or treatment response in inflammatory bowel disease (IBD). We evaluated the usefulness of FC as a biomarker for disease activity in patients with IBD using both enzyme-linked immunosorbent assay (ELISA) and a quantitative point-of-care test (QPOCT).
Methods
Fecal samples and medical records were collected from consecutive patients with IBD. FC levels were measured by both ELISA and QPOCT and patient medical records were reviewed for clinical, laboratory, and endoscopic data.
Results
Ninety-three patients with IBD were enrolled, 55 with ulcerative colitis (UC) and 38 with Crohn’s disease (CD). The mean FC-ELISA levels were 906.3 ± 1,484.9 μg/g in UC and 1,054.1 ± 1,252.5 μg/g in CD. There was a strong correlation between FC-ELISA level and clinical activity indices (p < 0.05). FC-ELISA level was significantly lower in patients with mucosal healing (MH) compared to those without MH in UC (85.5 ± 55.6 μg/g vs. 1,503.7 ± 2,129.9 μg/g, p = 0.005). The results from the QPOCT corresponded well to those from ELISA. A cutoff value of 201.3 μg/g for FC-ELISA and 150.5 μg/g for FC-QPOCT predicted endoscopic inflammation (Mayo endoscopic subscore ≥ 1) in UC with a sensitivity of 81.8% and 85.8%, respectively, and a specificity of 100% for both.
Conclusions
FC was strongly associated with disease activity indices, serologic markers, and endoscopic activity in patients with IBD. QPOCT can be used more conveniently than ELISA to assess FC in clinical practice.
INTRODUCTION
Mucosal healing (MH) is reported to be associated with sustained remission and a reduced risk of surgery in inflammatory bowel disease (IBD) [1]. Colonoscopy is essential for the assessment of intestinal inflammation. However, the standard criteria for the evaluation of disease severity as well as the definitions of MH on colonoscopy are still unclear. Moreover, long-term studies examining whether MH actually contributes to remission maintenance in IBD are few [2-4].
Fecal biomarkers, such as calprotectin, are non-invasive and have been evaluated for the ability to assess disease activity in patients with IBD. Calprotectin is a calcium and zinc binding protein of the S-100 protein family and is found in the cytosol of human neutrophils and macrophages. Calprotectin reflects the migration of neutrophils into the gut lumen and thus can be used as a sensitive marker of intestinal inflammation. Recently, several studies have demonstrated that fecal calprotectin (FC) may be the best available surrogate marker for the presence of mucosal inflammation in IBD [5-11].
FC is also known to have a good correlation with disease activity and may be a useful predictor for relapse or response to therapy in IBD. FC has been used as a follow-up marker in patients diagnosed with IBD. According to recent trials, the sensitivity of FC to detect any active mucosal disease ranges from 70% to 100% and the specificity ranges from 44% to 100%, depending on the cut-off value used [12-14]. However, FC is not currently widely used in clinical practice in Korea.
The current method to measure FC is based on the enzyme-linked immunosorbent assay (ELISA). The ELISA has disadvantages such as being a time-consuming process, requiring expertise, and needing multiple samples at the same time in order to run the assay. However, the recently developed, quantitative point-of-care test (QPOCT) is simple, easy to use, and able to produce more rapid results than the ELISA. Unfortunately, there has been a lack of data comparing the accuracy and availability of the two methods [15,16].
In the current study, we aimed to assess the usefulness of FC as a marker of disease activity and examine the correlation between FC and laboratory and endoscopic parameters, including MH, in patients with IBD. In addition, we compared the QPOCT with the established ELISA method.
METHODS
Patients
The prospective study was conducted at St. Vincent’s Hospital of the Catholic University of Korea, between May 2012 and December 2014. Consecutive patients with a diagnosis of IBD of at least 6 months in duration were enrolled. The diagnosis of IBD was made on the basis of standard clinical, endoscopic, and histological criteria. Exclusion criteria were as follows: concomitant gastrointestinal infection within 4 weeks prior to enrollment, peptic ulcer disease within 2 months prior to enrollment, regular use of non-steroidal anti-inflammatory agents (≥ 2 tablets/week), colorectal cancer, pregnancy, and an inability to collect fecal samples. The clinical phenotype was assessed according to the World Gastroenterology Organization’s (WGO) Montreal Classification [17]. In ulcerative colitis (UC), the extent of the disease was classified as proctitis, left-sided colitis, or extensive colitis. In Crohn’s disease (CD), the location of the disease was classified as ileal, colonic, or ileocolonic.
Serological markers
Serologic markers of inflammation including the white blood cell (WBC) count, C-reactive protein (CRP), and hematocrit were measured within 1 day before the collection of the fecal samples.
Clinical activity
In UC, clinical activity was assessed according to the partial Mayo score [18]. The partial Mayo score consists of three items: stool frequency, rectal bleeding, and the physician’s global assessment. Clinical remission was defined as a partial Mayo score ≤ 2 with a stool frequency subscore of 0 or 1 and a rectal bleeding subscore of 0.
In CD, clinical activity was assessed according to the Crohn’s disease activity index (CDAI) [19]. Clinical remission was defined as a CDAI score < 150.
Endoscopic activity
Endoscopic activity was assessed according to the Mayo endoscopic subscore (MES) in patients with UC [18]. The MES reflects the severity of intestinal inflammation on colonoscopy as follows: 0 point, normal or inactive disease; 1 point, mild disease (erythema, decreased vascular pattern, and mild friability); 2 points, moderate disease (marked erythema, absent vascular pattern, friability, and erosions); and 3 points, severe disease (spontaneous bleeding and ulcerations). Endoscopic remission (i.e., MH) was defined as an MES of 0.
In patients with CD, endoscopic activity was assessed by the simple endoscopic index for Crohn’s disease (SES-CD). The SES-CD consists of four components: the presence and size of ulcers (none, score 0; diameter 0.1 to 0.5 cm, score 1; 0.5 to 2 cm, score 2; > 2 cm, score 3); the extent of the ulcerated surface (none, 0; < 10%, 1; 10% to 30%, 2; > 30%, 3); the extent of the affected surface (none, 0; < 50%, 1; 50% to 75%, 2; > 75%, 3); and the presence and type of narrowings (none, 0; single, can be passed, 1; multiple, can be passed, 2; cannot be passed, 3). The definition of endoscopic remission using the SES-CD is still obscure. Thus, with reference to a previous study, we defined endoscopic remission as an SES-CD score < 4 points [20,21].
Fecal calprotection
Stool sample collection was performed 1 to 3 days before the endoscopy or outpatients visits. Stool samples (1 to 2 g per person) were collected and stored at –20°C until analysis. FC was determined using a commercially available ELISA kit (Bühlmann Laboratories AG, Schönenbuch, Switzerland) and QPOCT kit (Quantum Blue; Bühlmann). The laboratory personnel conducting the analysis was blinded to the clinical history and the endoscopic findings of the patients.
In the FC-ELISA method, aliquots of approximately 100 mg of feces were homogenized in 5 mL of extraction buffer. A 2 mL of the homogenate was then centrifuged in a microcentrifuge for 5 minutes. Then 3,000 g and 100 μL of the diluted supernatant (1:50 with incubation buffer) were incubated at room temperature and placed onto a microtiter plate coated with a monoclonal capture antibody highly specific to the calprotectin heterodimeric and polymeric complexes. After incubation, washing, a second incubation with a specific detection antibody, and a further washing step, tetramethylbenzidine followed by a stop solution were added. The measuring range of the FC-ELISA is 10 to 1,800 μg/g. The calprotectin cut-off level representing a positive value was ≥ 50 μg/g as stated by the manufacturer.
The FC-QPOCT relies on lateral flow assay technology and includes an easy to use reader system with a quantitative read out. There are two kinds of FC-QPOCT: the lower range Quantum Blue (LF-CAL) and the higher range Quantum Blue (LF-CHR). Both provide quantitative results within minutes, ranging from 30 to 300 or 100 to 1,800 μg/g, respectively. All samples scoring > 300 μg/g with LF-CAL were tested again with the LF-CHR kit in order to obtain the exact FC value.
Statistical analysis
The statistical analysis was carried out using the IBM SPSS version 20.0 (IBM Corp., Armonk, NY, USA). Numerical results are given as the mean ± standard deviation and range except when specified. Student t test, Mann-Whitney U test, and an analysis of variance were used to compare means. Qualitative results were based on the chi-square test. The correlation analyses between FC, clinical activity, endoscopic activity and other serologic markers was based on the Spearman rank correlation coefficient (r) for non-parametric correlations. The multivariate analysis consisted of multiple logistic regressions. In the comparison among three independent groups, the Kruskal-Wallis test was used. Receiver operator characteristic curves were constructed to find the best cutoff value for FC using the area under the curve (AUC). The best cutoff value was used to determine sensitivity and specificity. Differences with a p < 0.05 were considered statistically significant. The correlation between FC-ELISA and FC-QPOCT was analyzed by Spearman correlation coefficient rank and interclass correlation index.
Ethics statement
This study was approved by the Institutional Review Board of the Catholic University of Korea (IRB No. VC12RISI0015). Written informed consent was obtained from all subjects after a full explanation of the project.
RESULTS
Initially, 106 IBD patients, 64 with UC and 42 with CD, were considered for enrollment. Among them, thirteen patients were excluded; 12 for carrying inappropriate stool samples, and one for having a concomitant gastrointestinal infection. Thus, a total of 93 patients (55 UC and 38 CD) between 18 and 85 years of age were finally enrolled.
Using FC-ELISA, it took about 2 hours to measure FC in 88 samples at once. Using FC-QPOCT, it took 12–15 minutes for each sample depending on the kit type (12 minutes for LF-CAL and 15 minutes for LF-CHR).
Characteristics of the patients
In patients with UC, 62.8% were male and the mean age at the time of testing was 48.4 ± 13.2 years. The mean follow-up period was 17.2 ± 6.3 months. The mean partial Mayo score was 3.2 ± 2.2. The mean FC-ELISA and FC-QPOCT levels were 906.3 ± 1,484.9 and 529.0 ± 682.8 μg/g, respectively.
In patients with CD, 63.2% were male and the mean age at the time of testing was 34.5 ± 13.0 years. The mean CDAI was 148.2 ± 96.5. The mean FC-ELISA and FCQPOCT levels were 1,054.1 ± 1,252.5 and 579.0 ± 646.0 μg/g, respectively. Regarding disease location, ileal CD was most common (53%), followed by ileocolonic (39%) and colonic CD (8%). Involvement of the upper gastrointestinal tract was present in only two patients. Patients’ characteristics at the time of inclusion are summarized in Table 1.
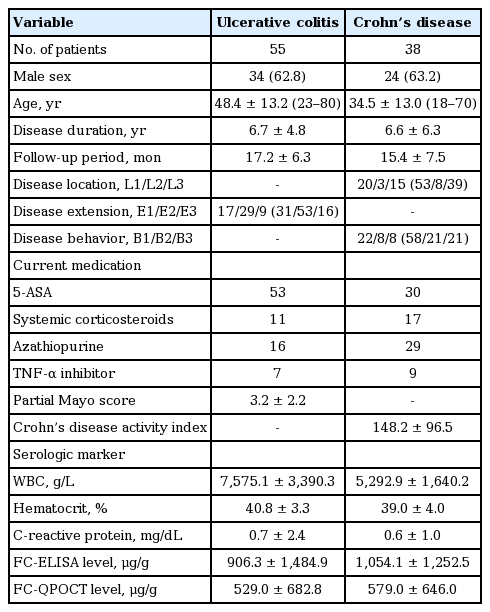
Patients’ characteristics
The correlation of FC with clinical activity and serologic markers
The partial Mayo score and FC-ELISA levels showed a significant correlation in UC patients (r = 0.541, p = 0.000) (Fig. 1A). In addition, there was significant correlation between the CDAI and FC-ELISA levels in CD patients (r = 0.520, p = 0.001) (Fig. 1B).
Correlations between clinical activity with FC-ELISA levels. Clinical indices and FC-ELISA shows significant correlation in both ulcerative colitis (A) and Crohn’s disease (B). FC, fecal calprotection; ELISA, enzyme-linked immunosorbent assay; CDAI, Crohn’s disease activity index.
In patients with UC, the FC-ELISA levels significantly correlated with the WBC (r = 0.314, p = 0.020) and CRP (r = 0.328, p = 0.014), but not with the hematocrit (r = 0.174, p = 0.203). In contrast, FC-QPOCT levels only significantly correlated with CRP (r = 0.395, p = 0.023). In patients with CD, the FC-ELISA levels significantly correlated with CRP (r = 0.358, p = 0.027) and the hematocrit (r = 0.322, p = 0.049), but not with the WBC (r = 0.303, p = 0.858). FCQPOCT also significantly correlated with CRP (r = 0.358, p = 0.027) and hematocrit (r = 0.322, p = 0.049).
In patients with UC, a cutoff value of 211.3 μg/g for the FC-ELISA had a sensitivity of 77.4% and a specificity of 75.0% for the prediction of clinical remission with an AUC value of 0.80 (Fig. 2A). A cutoff value of 180.5 μg/g for the FC-QPOCT had a sensitivity of 81.3% and a specificity of 73.7%, with an AUC value of 0.79 (Fig. 2B). In patients with CD, a cutoff value of 710 μg/g for the FC-ELISA had a sensitivity of 62.5% and a specificity of 59.1% for the prediction of clinical remission with an AUC of 0.69 (Fig. 2C). However, FC-QPOCT did not present a satisfactory cutoff value.

Receiver operating characteristic curves of fecal calprotection (FC) in relation to clinical remission. (A) FC-ELISA test in ulcerative colitis (UC) (sensitivity 77.4%; specificity 75.0% at FC-ELSIA 211.3 μg/g; AUC, 0.80). (B) FC-QPOCT in UC (sensitivity 81.3%; specificity 73.7% at FC-QPOCT 180.5 μg/g; AUC, 0.79). (C) FC-ELISA test in Crohn’s disease (sensitivity 62.5%; specificity 59.1% at FC-ELSIA 710 μg/g; AUC, 0.69). ELISA, enzyme-linked immunosorbent assay; AUC, area under the curve; QPOCT, quantitative point-of-care test.
The correlation of FC with endoscopic activity
Of the 55 patients with UC, 29 underwent endoscopy. Six colonoscopies and 23 sigmoidoscopies were performed by expert endoscopists who have performed more than 1,000 colonoscopies. Of the 38 patients with CD, only three underwent colonoscopy. Thus, we could not obtain reliable data regarding the correlation between FC and endoscopic activity in CD patients.
FC-ELISA levels showed a significant correlation with the MES (r = 0.564, p = 0.001). In contrast, there was no significant correlation between FC-QPOCT and endoscopic activity (r = 0.382, p = 0.130).
According to the MES, seven patients (24%) had endoscopic remission, seven (24%) had mid activity, nine (31%) had moderate activity, and six (21%) had severe activity. The mean FC-ELISA level was significantly lower in the endoscopic remission group (MES of 0) compared with the endoscopically active group (85.5 ± 55.6 μg/g vs. 1,503.7 ± 2,129.9 μg/g, p = 0.005) (Fig. 3).

Fecal calprotectin-enzyme-linked immunosorbent assay (FC-ELISA) levels according to Mayo endoscopic subscore (MES). FC-ELISA levels were significantly lower in mucosal healing group compared with endoscopically active group. MH, mucosal healing.
In UC, a cutoff value of 201.0 μg/g for the FC-ELISA had a sensitivity of 81.8% and a specificity of 100% for the prediction of endoscopic remission with an AUC of 0.88. For FC-QPOCT, a cutoff value of 150.5 μg/g predicted endoscopic remission with a sensitivity of 85.7% and a specificity of 100%. In the multivariate analysis, there were no independent variables significantly related to endoscopic remission.
The correlation between FC-ELISA and FC-QPOCT
FC levels measured by ELISA and QPOCT showed very close correlation in both UC (r = 0.874, p = 0.000) and CD (r = 0.908, p = 0.000) (Fig. 4).

Correlations between FC-ELISA and FC-QPOCT levels in ulcerative colitis (UC) and Crohn’s disease (CD). FC-ELISA and FC-QPOCT showed very close correlation in both UC (A) and CD (B). FC, fecal calprotection; ELISA, enzyme-linked immunosorbent assay; QPOCT, quantitative point-of-care test.
DISCUSSION
The current study evaluated the usefulness of FC as a biomarker for monitoring disease activity in patients with IBD using both ELISA and QPOCT. We confirmed that FC level was strongly associated with disease activity indices, serologic markers, and endoscopic activity in patients with IBD. In particular, both calprotectin assays could predict MH with high sensitivity (> 81%) and specificity (100%) in UC patients. Therefore, FC may be a useful alternative to repeated endoscopies. In addition, QPOCT can be used more conveniently than ELISA to assess FC in clinical practice.
Previous studies have demonstrated that MH is intimately related to a favorable clinical course of IBD in terms of treatment response, relapse, hospitalization, and surgery [4,22,23]. Colonoscopy is still considered the gold standard for the evaluation of mucosal inflammation, but is invasive, time-consuming and uncomfortable for patients. Therefore, an interest in noninvasive and reliable biomarkers of mucosal inflammation that have comparable performance to colonoscopy exists in clinical practice.
Several studies have previously suggested FC as a surrogate marker for endoscopic disease activity in IBD patients. However, some studies have shown contrary results [7,11,24-26]. A Belgian study showed a significant correlation between FC levels and endoscopic activity in both UC and CD [7]. In a small population-based cohort study, FC was significantly related to the endoscopic activity score in patients with IBD [27]. A Spanish study showed that FC predicts endoscopic remission (Crohn's Disease Endoscopic Index of Severity [CDEIS] < 3) and postoperative endoscopic recurrence in CD patients [15]. In contrast, Denis et al. [26] failed to find a significant correlation between CDEIS and FC in symptomatic CD patients with normal CRP levels. In addition, there are still numerous controversial issues. The current data are not yet conclusive enough to establish an FC cutoff level as a predictor of MH or postoperative recurrence. The published cut-off values for predicting mucosal inflammation varies from 50 to 250 μg/g. Xiang et al. [25] showed that FC with a 50 μg/g cutoff level had a specificity of 79.4% and a sensitivity of 91.9% in the discrimination of active and inactive disease according to the Sutherland score. Schoepfer et al. [11] illustrated that with a 100 mg/L cutoff level, FC predicted endoscopic activity as defined by a Rachmilewitz index ≥ 4 with a specificity of 88% and a sensitivity of 86%. Recently, D’Haens et al. [7] found a 250 μg/g cutoff level to be the most accurate for the prediction of the presence of any mucosal inflammation in patients with UC as defined by a Mayo endoscopic sub-score ≥ 1 with a specificity of 100% and a sensitivity of 71% as well as for the prediction of the presence of large ulcers in CD. In line with these results, we demonstrated that FC with a 201.3 μg/g cutoff level for the FC-ELISA or a 150.5 μg/g cutoff level for the FC-QPOCT is the most accurate for the prediction of any endoscopic activity as defined by a MES > 0.
Although the FC-ELISA method is the most commonly used method to measure FC, recent studies have been conducted to evaluate the accuracy of the FC-QPOCT in predicting disease activity in IBD. Lobaton et al. [15] demonstrated that, in patients with CD with ileocolonic resection, the prediction of endoscopic remission using FC-QPOCT presented an AUC of 0.933. The same authors showed that the prediction of endoscopic remission with FC-QPOCT presented an AUC of 0.906 in patients with UC [12]. The current study also explored the validity of the FC-QPOCT compared with the FC-ELISA method. Our results suggest that the FC-QPOCT is comparable to the FC-ELISA in the prediction of disease activity in IBD. The FC-QPOCT is easy to perform and able to produce more rapid quantitative results than the FC-ELISA method. Therefore, the FC-QPOCT appears to be more suitable for real practice and could be more widely used in the future.
Our study has several limitations. First, there was a lack of follow-up data for FC in our patients. In order to show the close correlation between FC and disease activity, FC data taken at different time points with varying degree of disease activity in the same patient may be more useful and informative. Second, the number of patients included in our study was relatively small. Third, we did not assess histological findings. The definition of MH is still controversial and some researchers suggest that MH should include not only endoscopic healing but also the histological absence of mucosal inflammation [28,29]. Recently, Theede et al. [30] illustrated that the FC level correlated with endoscopic and histologic inflammatory activity in 120 UC patients who had endoscopic and histologic features of mucosal healing (positive predictive value 0.71 and 0.75, negative predictive value 0.65 and 0.90). Thus, future studies should evaluate the relationship between FC and histologic inflammation. Fourth, since colonoscopy was performed in too few CD patients, the correlation between FC and endoscopic activity in CD could not be assessed. Lastly, as showed in Fig. 1B, higher fraction of our CD patients showed relatively low disease activity (CDAI < 220). This uneven distribution could lead selection biases.
In conclusion, our results indicated that FC is a reliable surrogate marker of endoscopic activity in IBD. FC could be especially useful in the prediction of endoscopic remission in patients with UC. Therefore, FC has the potential to replace colonoscopy for the serial assessment of mucosal inflammation in IBD patients. In addition, the excellent correlation observed between the FC-ELISA and the rapid QPOCT allows a more easy assessment of FC in clinical practice.
KEY MESSAGE
1. Fecal calprotectin (FC) level was strongly associated with disease activity indices, serologic markers, and endoscopic activity in patients with inflammatory bowel disease.
2. In particular, calprotectin assays could predict mucosal healing with high sensitivity (> 81%) and specificity (100%) in ulcerative colitis patients. Therefore, FC may be a useful alternative to repeated endoscopies.
3. Quantitative point-of care test can be used more conveniently than enzyme-linked immunosorbent assay to assess FC in clinical practice.
Notes
No potential conflict of interest relevant to this article was reported.