Comparison of enhancement and image quality: different iodine concentrations for liver on 128-slice multidetector computed tomography in the same chronic liver disease patients
Article information
Abstract
Background/Aims:
The objective of this study was to compare the degree of hepatic enhancement and image quality using contrast media of different iodine concentrations with the same iodine dose.
Methods:
From July 2011 to June 2013, 50 patients with chronic liver disease who underwent baseline and follow-up 128-slice multidetector computed tomography(MDCT) using contrast media with 350 mg I/mL (group A) and 400 mg I/mL (group B) iodine concentrations were included in this prospective study. The patients were randomly allocated to one of two protocols: 350 mg I/mL initially and then 400 mg I/mL; and 400 mg I/mL initially and then 350 mg I/mL. The bolus tracking technique was used to initiate the arterial phase scan. The computed tomography values of hepatic parenchyma, abdominal aorta and portal vein were measured. The degrees of hepatic and vascular enhancement were rated on a 4-point scale for qualitative assessment. The paired Student t test was used to compare outcome variables.
Results:
The mean hepatic enhancement was significantly higher in group B than in group A during the portal (p = 0.025) and equilibrium phases (p = 0.021). In all phases, group B had significantly higher mean liver-to-aorta contrast (p < 0.05) and mean visual scores for hepatic and vascular enhancement (p < 0.001).
Conclusions:
This study showed that a higher iodine concentration (400 mg I/mL) in contrast media was more effective at improving hepatic enhancement in portal and equilibrium phase images and overall image quality using 128-slice MDCT in chronic liver disease patients.
INTRODUCTION
Contrast-enhanced multidetector computed tomography (MDCT) is a commonly used imaging modality for patients with chronic hepatitis or liver cirrhosis. Hepatocellular carcinomas (HCCs) are commonly hypervascular, and contrast-enhanced MDCT has improved detection of HCCs in these patients [1]. Factors affecting HCC detection include contrast medium volume, injection rate, type of contrast material, scan delay time, iodine concentration in the contrast material and body weight [2-8]. Many studies have compared the effects of different iodine concentrations in contrast media on hepatic parenchyma visualization in different patient groups [2,4,5,7-9]. However, few reports have made such comparisons in the same group of patients [1,10,11]. There have been no prospective studies comparing repeat MDCT scans using contrast media with different iodine concentrations in the same patient. Therefore, the purpose of this prospective study was to evaluate the degree of hepatic enhancement and image quality between moderate (350 mg/mL) and high (400 mg/mL) iodine concentrations in contrast media, using the same iodine dose, in chronic liver disease patients who underwent 128-slice MDCT at least twice.
METHODS
Patient population
This prospective study was reviewed and approved by the institutional review board at Samsung Changwon Hospital (Changwon, Korea), and written informed consent was obtained from all participants. We performed 128-slice MDCT scans in 62 cirrhosis or chronic hepatitis patients (52 men and 10 women) at least twice using contrast medium with 350 mg/mL (group A) and 400 mg/mL (group B) iodine concentrations from July 2011 to June 2013 for multiple dysplastic nodules or suspicious malignant nodules on ultrasound, increased serum α-fetoprotein levels and poor sonic window due to body habitus. The patients were allocated prospectively and randomly to one of two groups using the closed envelope method (31 sealed envelopes contained a paper labeled “350 to 400 mg I/mL group” and 31 envelopes contained a paper labeled “400 to 350 mg I/mL group”). Each patient selected one sealed envelope. Patients who selected the 350 to 400 mg I/mL group received initial 128-slice scans using 350 mg I/mL contrast media and follow-up scans with 400 mg I/mL contrast media. Conversely, patients who selected the 400 to 350 mg I/mL group underwent scans using 400 mg I/mL contrast media initially and then follow-up scans with 350 mg I/mL contrast media. We then compared the effect of different iodine concentrations using the same iodine dose in the same patients on hepatic enhancement and image quality. The exclusion criteria were as follows: (1) patients who received hepatic resection or hepatic interventional procedures (transcatheter arterial chemoembolization, percutaneous alcohol injection or radiofrequency ablation) between the two MDCT examinations with possible alteration of the hepatic and portal perfusion in liver; (2) patients with a history of iodine contrast hypersensitivity, renal failure, congestive heart failure (CHF), bronchial asthma or hyperthyroidism and; and (3) patients whose weight change was more than 5% between the MDCT examinations. Four patients with renal failure and three patients with CHF were excluded from the study. Five patients were lost to follow-up. Of the remaining 50 patients, 44 were male (88.0%) and six were female (12.0%). The mean age ± standard deviation at the time of the initial MDCT examination was 64.18 ± 11 years (age range, 40 to 88). The mean weight was 64.8 ± 10.9 kg (range, 48 to 104), and the time interval between the two MDCT examinations was 111.06 ± 45.92 days (range, 57 to 271; median, 97). The patient characteristics are shown in Table 1.

Baseline study population characteristics
MDCT protocol
For the initial and follow-up examinations, patients received 120 mL intravenous (IV) contrast medium with 350 mg/mL iomeprol (Iomeron 350, Bracco Imaging, Milan, Italy) or 105 mL IV contrast medium with 400 mg/mL iomeprol (Iomeron 400, Bracco Imaging) using the same MDCT protocol. Iomeprol is a non-ionic monomeric contrast medium. Iomeprol of 350 and 400 mg/mL has an osmolality of 620 and 730 mOsmol/kg, respectively and a viscosity of 7.5 and 12.6 mPa.s at 37°C, respectively. All examinations were performed using the same MDCT scanner (Somatom Definition AS+, Siemens Medical Solutions, Forchheim, Germany) with 0.6 × 64-beam collimation, 120 kVp, 210 mAs, 0.5-second gantry rotation speed, 26-mm per rotation table speed, and 5-mm section thickness and interval. Before the examinations, patients were instructed to hold their breath to avoid motion artifacts. Scans were performed from the top of the liver in the cephalocaudal direction. Contrast medium (warmed to body temperature) was administered using a dual-power injector (Medrad, Indianola, PA, USA) at a rate of 3.0 mL/sec, followed by a 20-mL saline flush at the same rate through a 20-gauge IV catheter in the antecubital vein. Total iodine loads were 42 g for the 350 mg I/mL contrast media and 42 g for the 400 mg I/mL contrast media. Acquisition of the hepatic arterial phase was bolus-triggered after the attenuation value reached 100 Hounsfield units (H) in the thoracic aorta. The scan delay for the portal venous phase was 35 seconds after the start of the arterial phase acquisition and the equilibrium phase was 105 seconds after the start of the portal phase acquisition.
Quantitative analysis
After image acquisition, attenuation values for the abdominal aorta, hepatic parenchyma, and portal vein were measured by radiologists (YGS and BGJ) with 14 and 3 years of radiology experience, respectively, using a 1.0 to 2.0 cm2 circular region-of-interest cursor in unenhanced scans and in the three phases of contrast-enhanced scans. Measurements from the two radiologists were averaged.
For assessment of hepatic parenchyma, region-of-interest measurements were performed in eight areas per liver, as specified in Couinaud’s segmental classification. The mean attenuation value was calculated by averaging all measurements in each phase. When comparing anatomic structures (branches of the hepatic artery, portal vein and hepatic vein and shape of the pancreas, spleen, ribs, and vertebral bodies for each patient) an attempt was made to maintain a constant region of interest between initial and follow-up examinations. Visible hepatic and portal vessels, bile ducts, calcifications, possible hepatic lesions and regions of posttreatment changes were excluded from region-of-interest areas.
In the abdominal aorta, attenuation values were measured at the porta hepatis level, lower hepatic angle and top of the diaphragm. The results were averaged for each phase.
In the portal vein, attenuation values were measured at two areas where the main portal vein was clearly visible. Results were averaged in the portal and equilibrium phase.
Changes in attenuation of these structures were calculated by subtracting attenuation values of contrast-enhanced images obtained during each phase from corresponding baseline values on unenhanced images. In the arterial, portal and equilibrium phases, liver-to-aorta contrast was also evaluated by calculating the difference in attenuation values between the liver and aorta. To compare the adequacy of contrast enhancement between the two iodine concentrations, differences in attenuation values of hepatic parenchyma during the arterial, portal and equilibrium phases, as compared with pre-contrast images, were classified into the following grades: 3, fine (mean increase > 50 H); 2, moderate (mean increase, 30 to 50 H); and 1, insufficient (mean increase < 30 H).
Visual analysis
Two radiologists (YGS and BGJ, with 14 and 3 years of radiology experience, respectively) without prior knowledge of the injection protocol, independently assessed the image qualities of the contrast-enhanced scans. All images were analyzed on a picture archiving and communications system (PACS-Marosis, Infinitt, Seoul, Korea). The radiologists visually scored the degree of vascular and hepatic enhancement using the following 4-point scale: 4, excellent (very good contrast between the hepatic parenchyma and hepatic vessels, with clear visualization of the peripheral vascular branches and excellent overall image quality); 3, good (good contrast between the hepatic parenchyma and hepatic vessels and adequate image quality; 2, fair (insufficient contrast between the hepatic parenchyma and hepatic vessels); and 1, poor (little contrast between the hepatic parenchyma and hepatic vessels). The measurements made by the two radiologists were averaged.
Statistical analysis
Results are presented as mean ± standard deviation (range). Paired Student t test or analysis of variance was used to compare outcome variables between contrast media containing 350 or 400 mg I/mL. All statistical analyses were performed using PASW version 18.0 (SPSS Inc., Chicago, IL, USA). Statistical significance was accepted at p < 0.05. The sample size was calculated based on a 5% significance level and 80% statistical power by the GPOWER program.
RESULTS
Mean hepatic parenchyma enhancement values from group B (400 mg I/mL) were significantly higher than those from group A (350 mg I/mL) during the portal (p = 0.025) and equilibrium phases (p = 0.021); however, no significant differences in arterial phase images were observed between the two groups (Fig. 1). Mean differences in hepatic parenchyma enhancement values between the two groups were 7.5 H (range, 0.3 to 16.2) and 4.8 H (range, 0.3 to 11.5) during the portal and equilibrium phases, respectively. The mean aortic enhancement values from group B were significantly higher than those from group A during the arterial phase (p = 0.005) and portal phase (p = 0.002). Mean differences in aortic enhancement values between the two groups during the arterial phase and the portal phase were 28 H (range, 2 to 135.7) and 17.1 H (range, 0.3 to 47.3), respectively. Mean portal venous enhancement values from group B were significantly higher than those from group A during the portal phase (p = 0.005) and the equilibrium phase (p = 0.008). Mean differences in portal venous enhancement values in individuals between the two groups during the portal phase and the equilibrium phase were 17.6 H (range, 1 to 67.5) and 10.2 H (range, 1 to 37.5), respectively (Table 2). Mean liver-to aorta contrast ratios during the arterial, portal and equilibrium phases from group B were significantly higher (p < 0.05) than the corresponding values from group A (Table 3, Fig. 2).
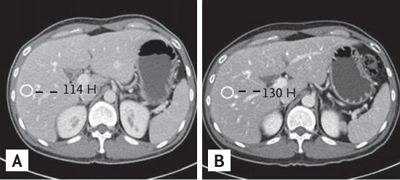
Multidetector computed tomography (MDCT) scan of the abdomen from a 45-year-old man with chronic hepatitis. MDCT scans of the abdomen obtained during the portal venous phase using contrast media of 350 (A) and 400 mg I/mL (B). There were statistically significant differences in contrast enhancement values of the hepatic parenchyma, aorta and portal vein between the two groups.
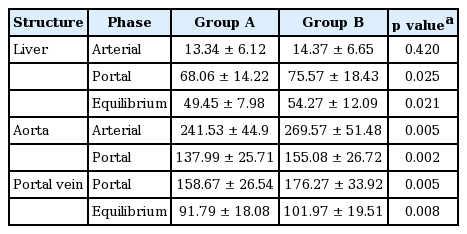
Comparison of contrast enhancement values in the hepatic parenchyma, aorta, and portal vein in groups A and B

Comparison of liver-to-aorta contrast in groups A and B
Multidetector computed tomography (MDCT) scan of the abdomen from a 67-year-old man with cirrhosis. MDCT scans of the abdomen obtained during the arterial phase using contrast media of 350 (A) and 400 mg I/mL (B). There was a statistically significant difference in liver-to-aorta contrast between the two groups.
The adequacy of hepatic contrast enhancement varied. From group B, grade 3, and grade 2 contrast enhancements during the portal phase were noted in 43/50 patients (86%) and 7/50 (14%), respectively. There were no patients with grade 1 contrast enhancement from group B. From group A, grade 3, and grade 2 contrast enhancements during the portal phase were noted in 42/50 patients (84%) and 6/50 (12%), respectively. Additionally, there were 2/50 patients (4%) with grade 1 contrast enhancement from group A. During the equilibrium phase, grade 1 contrast enhancement was noted in 6/50 patients (12%) from group A and in 4/50 patients (8%) from group B (Table 4).
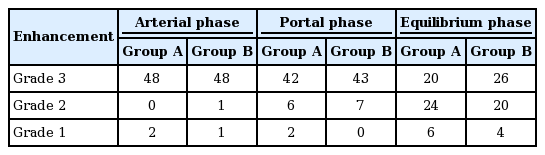
Comparison of hepatic parenchymal enhancement grades
In multiple phases, mean visual scores of the hepatic parenchyma and vascular enhancement were significantly higher in group B than group A (p < 0.001). In group B, during the arterial and portal phases, 22 cases (40%) and 40 (80%), respectively, were assessed as grade 4 (excellent). In group A, during the arterial and portal phases, 3 cases (6%) and 12 (24%), respectively, were assessed as grade 4 (excellent). During the equilibrium phase, 16 cases (32%) were assessed as grade 4 (excellent) in group B, compared with only 1 case (2%) in group A (Tables 5 and 6).
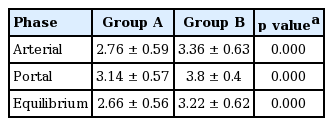
Visual scores of image quality between the two groups

Image quality in vascular and hepatic enhancement between the two groups
In our study, two patients from group A (350 mg I/mL) experienced minor side effects: nausea and urticaria. No patients from group B (400 mg I/mL) experienced side effects. No patients had symptoms of contrast-induced nephropathy, oliguria or anuria.
DISCUSSION
Varying degrees of contrast enhancement in multiple organs and vascular structures is expected with contrast materials containing different iodine concentrations, and many researchers have reported a relationship between iodine concentration and contrast enhancement [1,12-15]. In some patients, it is very important to serially compare contrast media of different iodine ratios to prevent overuse of contrast materials and limit radiation exposure. Most contrast materials are excreted through the renal system, and patients with chronic liver disease or liver cirrhosis often have renal system dysfunctions. In these cases, delayed excretion through the hepatobiliary system is expected. As such, overuse of contrast material is not recommended in patients with chronic liver disease [1,10,11].
Patients with chronic liver disease or liver cirrhosis are regularly referred for anatomic and functional evaluation. CT is the imaging modality of choice for early detection and anatomic evaluation of HCC or malignant masses in patients with chronic liver disease. Many studies have revealed that multiphasic (arterial, portal, and equilibrium phase) contrast-enhanced MDCT is essential for screening CT examinations in patients with chronic liver disease [5,16-18]. High contrast between hepatic parenchyma and abnormal lesions and between scanning phases is necessary for the detection of hypervascular and hypovascular HCCs.
Few reports have evaluated hepatic enhancement using different contrast media iodine concentrations in the same patients [1,10,11]. In our study, mean contrast enhancement values in the hepatic parenchyma, aorta, and portal vein were significantly greater in group B than group A between (1) the portal and equilibrium phase, (2) arterial and portal phase, and (3) portal and equilibrium phase. When scoring the image quality of vascular and hepatic enhancement during the equilibrium phase, 45 cases (90%) were scored as grade 3 or 4 in group B, whereas 33 cases (66%) were scored as grade 3 or 4 in group A. These results suggest that higher iodine concentrations in contrast media yield greater enhancement of hepatic parenchyma and probably improve lesion detection and conspicuity of hypovascular HCCs in the portal and equilibrium phase. Previous studies have shown that higher iodine concentrations in contrast media lead to greater image enhancement on CT images [1,14,15,19]. HCCs are supplied by the hepatic artery and are usually hypervascular. Therefore, hypervascular HCC enhancement seems to correlate with aortic enhancement [2,20]. Awai et al. [8] reported that the administration of a higher concentration of iodine in contrast material produced significantly higher tumor-to-liver contrast during the arterial phase. These findings are comparable to the results of this study. Additionally, results from our study and the study by Awai et al. [8] showed that hepatic parenchymal enhancement during the arterial phase was not significantly changed by iodine concentration.
Overall, greater enhancement of the hepatic parenchyma and vascular structure was obtained using contrast media containing a higher concentration of iodine. Many studies have reported that a higher iodine concentration is advantageous in CT scans [1,13,21-23]. In the portal venous phase, iodine concentration did not have an effect on the degree of enhancement, but total iodine dose affected the degree of enhancement in CT scans [10,22-26]. Total iodine was higher in the high iodine concentration group compared with the moderate iodine concentration group, and this could have led to the differences observed in tissue enhancement [22,23]. However, in our study, the total iodine dose was the same in both groups.
Low viscosity fluids distribute more evenly in vessels than do high viscosity fluids, and iodine increases the viscosity of contrast agents. In contrast to our results, previous studies reported peak enhancement of the aorta and liver when contrast agents with lower iodine ratios were used [8,10,27]. The viscosities of 350 and 400 mg I/mL iomeprol were 7.5 and 12.6 mPa.s at 37°C, respectively. Further investigations will be needed to explain these discrepancies.
The iodine delivery rate is another factor that directly influences arterial enhancement [7,24-26,28,29]. To ensure this was not a factor in our study, the iodine delivery rate was constant between groups A and B.
To enhance visualization of low-attenuated hepatic lesions, investigators reported that a minimum hepatic parenchymal enhancement of at least 50 H was necessary [30]. Therefore, suboptimal equilibrium phase MDCT scans may not be adequate for distinguishing hypovascular HCCs from the surrounding hepatic parenchyma in patients with chronic liver disease. In our study, insufficient equilibrium phase contrast enhancement was noted in 30/50 images (60%) from group A and 24/50 images (48%) from group B. Similarly, Furuta et al. [1] reported that insufficient equilibrium phase contrast enhancement was noted in 16/20 (80%) and 9/20 (45%) images from 300 and 370 mg I/mL iodine concentrations, respectively. These results suggest that contrast media containing a higher iodine ratio increase contrast enhancement in the hepatic parenchyma of chronic liver disease patients.
There were several limitations in our study. First, there was a time interval between the initial and follow-up CT scans. During this period, changes in heart rate, hepatic conditions and body weight could have influenced the study results. To minimize these variables, patients with renal failure, CHF and body weight changes of more than 5% during two scanning periods were excluded from the study.
Second, our study was conducted in an Asian population, and the results may not be generalizable to other populations. A large-scale, multicenter study should be conducted to obtain stronger scientific evidence.
In conclusion, this study showed that a higher iodine concentration (400 mg I/mL) used in contrast media was more effective at improving hepatic enhancement in portal and equilibrium phase images and in overall image quality using 128-slice MDCT in chronic liver disease patients.
KEY MESSAGE
1. Higher iodine concentration in contrast media was more effective at improving hepatic enhancement in portal and equilibrium phase images and overall image quality.
Notes
No potential conflict of interest relevant to this article was reported.