Accelerated progression of arterial stiffness in dialysis patients compared with the general population
Article information
Abstract
Background/Aims
The aim of this study was to compare the progression of aortic stiffness in chronic hemodialysis patients (CHP) with that of general population patients (GPP) over a 36-month period and to evaluate the determinants of this progression.
Methods
The study group included 80 patients undergoing hemodialysis (aged 59.3 ± 11.8 years; duration of dialysis 5.47 ± 5.16 years). The control group consisted of 60 patients (aged 57.5 ± 10.9 years) with a glomerular filtration rate of > 60 mL/min/1.73 m2. Pulse wave velocity (PWV) was determined from time diversity propagation of the common carotid artery and femoral artery by Doppler ultrasound. Clinical and biochemical parameters were determined in serum using standard laboratory procedures.
Results
The mean PWV values at baseline and 36 months were 11.18 ± 2.29 and 11.82 ± 2.34 m/sec in the CHP group, and 9.02 ± 1.89 and 9.29 ± 1.93 m/sec in the GPP group, respectively. The average PWV progressions were 63.95 ± 18.373 cm/sec in CHP and 27.28 ± 28.519 cm/sec in GPP. By multiple regression analysis, hemoglobin (standardized coefficient β [βst] = -0.405, p = 0.004; βst = -0.364, p = 0.011), albumin (βst = -0.349, p = 0.042; βst = -0.303, p = 0.034), CRP (βst = 0.458, p = 0.002; βst = 0.187, p = 0.008), and total cholesterol (βst = 0.236, p = 0.038; βst = 0.171, p = 0.078) were independently associated with PWV in the CHP and GPP groups, respectively.
Conclusions
Accelerated arterial stiffness was more pronounced in the CHP group than in the GPP group. The independent determinants of this progression in both groups include traditional risk factors and blood levels of hemoglobin, albumin and CRP. Cholesterol and uremia-related factors are determinants only in CHP.
INTRODUCTION
Arterial stiffness describes the reduced capability of an artery to expand and contract in response to pressure changes. Parameters that describe vessel stiffness include compliance and distensibility. The consequence of reduced compliance/distensibility is an increased propagation velocity of the pressure pulse along the arterial tree, called pulse wave velocity (PWV). PWV is inversely correlated with arterial distensibility and relative arterial compliance [1].
Increased central arterial stiffening is a hallmark of the aging process and the consequence of many disease states, such diabetes, atherosclerosis, and chronic renal compromise. The most consistent and well-reported changes are luminal enlargement with wall thickening (remodeling) and reduction of elastic properties (stiffening) at the level of large elastic arteries, namely arteriosclerosis [2]. Arteriosclerosis refers to reduced arterial compliance due to increased fibrosis, loss of elasticity, and vessel wall calcification affecting the media of large and middle-sized arteries. In dialysis patients, both atherosclerosis (affecting mainly the intima of the arteries) and arteriosclerosis (affecting predominantly the media of large and middle-sized arteries diffusely) are prominent [3]. Increasingly, arterial stiffness is recognized as an important component in the determination of cardiovascular (CV) risk, particularly among chronic kidney disease (CKD) and end stage renal disease (ESRD) populations [4].
Arteriosclerosis characterized by reduced arterial compliance (i.e., reduced elasticity of the arteries) is due to increased fibrosis, loss of elastic fibers, and extensive vessel wall calcification. Mechanically, increased arterial stiffness increases systolic pressure because the reflected waves are prematurely returned in late systole. The PWV and left ventricular afterload increase, thereby altering coronary perfusion. Arteriosclerosis is closely related to arterial stiffness. Currently, several noninvasive methods are used to assess vascular stiffness. PWV and the augmentation index are the two major noninvasive methods of assessing arterial stiffness [5]. PWV reflects the elasticity of the segmental artery. Cardiac contraction generates a pulse wave, which is propagated distally to the extremities. Increased arterial stiffness results in an increased speed of the pulse wave in the artery. PWV is calculated as the distance traveled by the pulse wave divided by the time taken to travel the distance [6]. PWV can be measured in any arterial segment between two regions. Carotid-femoral PWV is considered to be the gold standard for assessing central arterial stiffness, and is an independent predictor of CV mortality and morbidity in elderly and ESRD subjects, as well as in the general population [7]. PWV as measured in this study represents the velocity of the pulse wave transit from the common carotid artery (CCA; equivalent to the aortic arch) to the femoral artery (FA). Thus, it is a measure of stiffness of the aorta, an elastic artery with muscular contributions to its compliance [8].
The aim of this study was to compare the progression of aortic stiffness in chronic hemodialysis patients (CHPs) with that of general population patients (GPPs) over a 36-month period and to evaluate the determinants of this progression.
METHODS
Patients
The study group included 80 patients undergoing hemodialysis (53 males and 27 females, aged 59.3 ± 11.8 years, mean body mass index [BMI] 23.4 ± 3.6 kg/m2). Twenty patients were smokers, 16 were diabetics and 37 were hypertensive. The mean duration of dialysis was 5.47 ± 5.16 years. All subjects were on dialysis therapy for at least 3 months. We used data from patients who maintained an unchanged medication and dialysis membrane for 3 years for the final analysis. Twenty-three patients on dialysis who died during the 36-month period of examination were excluded. The patients had been on regular hemodialysis for 4 to 5 hours each time, three times per week at a blood flow rate of 180 to 200 mL/min via their arteriovenous fistulas. A bicarbonate dialysate was used at flow rate of 500 mL/min in each patient.
The control group consisted of 60 patients from the general population. The number of participants recruited from ambulatory patients was equal to their proportion in the general population according to predefined criteria: age, gender, smoking, diabetes, and hypertension compared with those of patients in the study group. The group consisted of 36 males and 24 females aged 57.5 ± 10.9 years, their mean BMI was 27.8 ± 4.41 kg/m2. Eighteen patients were smokers, 12 were diabetics, and 24 were hypertensive. The exclusion criterion was a reduced glomerular filtration rate (≤ 60 mL/min/1.73 m2) estimated by the modification of diet in renal disease formula. During the follow-up period, four deaths were recorded in these 60 patients and two patients refused further examinations. Finally, 54 patients (33 males and 21 females) completed the study.
No patients had an acute infection, congestive heart failure, or a malignancy at entry into study. All participants signed an informed consent and the study was approved by the Ethics Committee of our institution.
Assessment
The study group is referred to as the CHP group and the control group as the GPP group. In both groups, we conducted aortic PWV at the beginning of the study (baseline) and after 36 months.
PWV measurements were taken under the same conditions during both examinations, in supine position after resting for at least 10 minutes, including a constant room temperature of 19℃ to 21℃. The PWV in CHP was measured after a dialysis session, because interdialytic weight gain is associated with increased aortic PWV. Two Doppler waves were recorded transcutaneously at the base of the neck for the right CCA and over the right FA [9]. The examination began with the patient in a supine position after locating the CCA with B-mode at the supraclavicular level (1 to 2 cm of the bifurcation). Although it is not possible to analyze the carotid and femoral waves simultaneously, they can be normalized separately with the electrocardiogram (ECG) getting. We used a pulsed-Doppler ultrasound with a linear array 7.5 MHz probe (Toshiba SSA-340A, Toshiba Medical System Co., Tokyo, Japan) synchronized with ECG. We then identified the wave Doppler flow simultaneously with ECG. The process was repeated on the common FA in the groin. We performed three recordings of the CCA and three recordings of the FA in the groin [10]. Each recording involved two or three cardiac cycles. PWV was determined as the foot to foot velocity. The distance traveled by the pulse wave was measured over the body surface as the distance between the two recording sites. The distance was assessed using a tape measure located at the same place as the ultrasound probe, with two dimensional guidance to localize the exact position of the analyzed arterial site. Aortic PWV was calculated as the ratio of distance to transit time (TT). To determine the TT, we measured the time from the R wave of three graphical deflections seen on typical ECG: Q wave, R wave and S wave which occur in rapid succession (QRS) complex to the foot of the waveform using digital calipers. Six heart rate measurements were taken and the average was calculated. To determine the velocity, we used the distance (D) measured from the sternal notch to the FA at the groin. The measurement of carotid-femoral PWV was made by dividing the D by the so-called TT. Hence, PWW = D (meters)/Dt (seconds) [11]. ΔPWV was defined as PWV2 measured at 36-month follow-up minus PWV1 measured at baseline. A positive ΔPWV indicated progression of PWV.
Original snapshot images of ECG, CCA, and FA flow specter are presented in Fig. 1. The time diversity of their electric and Doppler signals is shown.
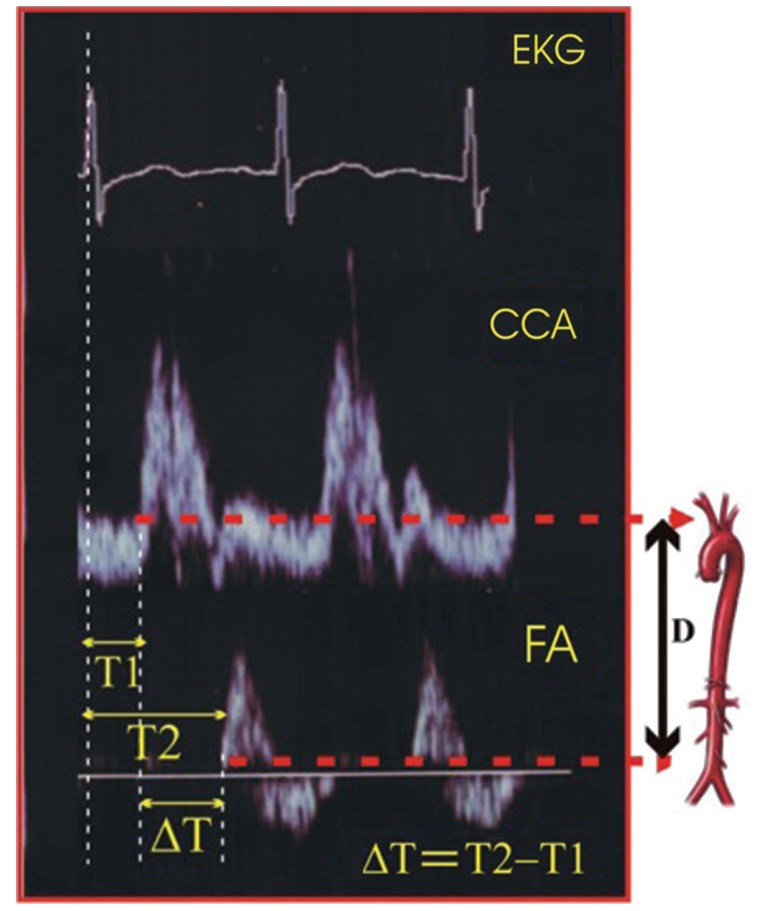
Pulse wave velocity determination. ECG, electrocardiography; CCA, common carotid artery; FA, femoral artery; ΔT, transit time; D, carotid-femoral distance.
TT was estimated by the foot to foot method. The foot of the wave is defined at the end of diastole, when the steep rise of the waveform begins. The TT is the time of travel for the foot of the wave over a known distance.
Clinical and biochemical parameters (urea, creatinine, hemoglobin, albumin, C-reactive protein [CRP], cholesterol, low density lipoprotein cholesterol [LDL-C], high density lipoprotein cholesterol [HDL-C], triglycerides, calcium, and plasma glucose) were determined in all participants using standard laboratory procedures, performed on a Cobas Mira S Analyzer (Roche Diagnostics, Holliston, MA, USA). Blood was drawn immediately before the start of a dialysis session in a fasting state. Mean values obtained from three measurements during the 3 months before PWV measurements were used in the analysis.
Statistical analysis
The data were analyzed using SPSS version 20.0 (IBM Co., Armonk, NY, USA). Mean initial values of the main variables were compared using Student t test. Student paired t test was used to compare differences between the first (baseline) and second (36 months) visits. Student test for unpaired data was used to compare the GPP and CHP groups. Pearson's correlations were calculated to explore the relationships between PWV and other variables, as appropriate. Multiple regression analysis was performed to determine the relationship between PWV to control the influence of laboratory markers. All tests were two-sided. A value of p < 0.05 was considered to indicate statistical significance.
RESULTS
During the 3-year period from December 2009 to December 2012, PWV measurements and other demographic and laboratory examinations were successfully conducted for two groups (GPP and CHP) in a total of 140 subjects at baseline and 111 subjects after 36 months. The numerical differences in the demographic composition of both groups between baseline and 36 months were due to deaths: 23 patients on dialysis and six in the general population group, resulting in a final analysis of 57 patients in the CHP group and 54 in the GPP group.
The demographics and clinical characteristics of the patients studied are presented in Table 1. Patients from both groups were predominantly male (66.2% in CHP, 60% in GPP). The lower height, weight and BMI index in dialysis patients than in those in the GPP (constitutional characteristic of dialysis patients) resulted in significant differences (p = 0.035, p < 0.001, and p < 0.001, respectively) between groups. Other characteristics of both groups were also assessed; there were no statistically significant differences among them.
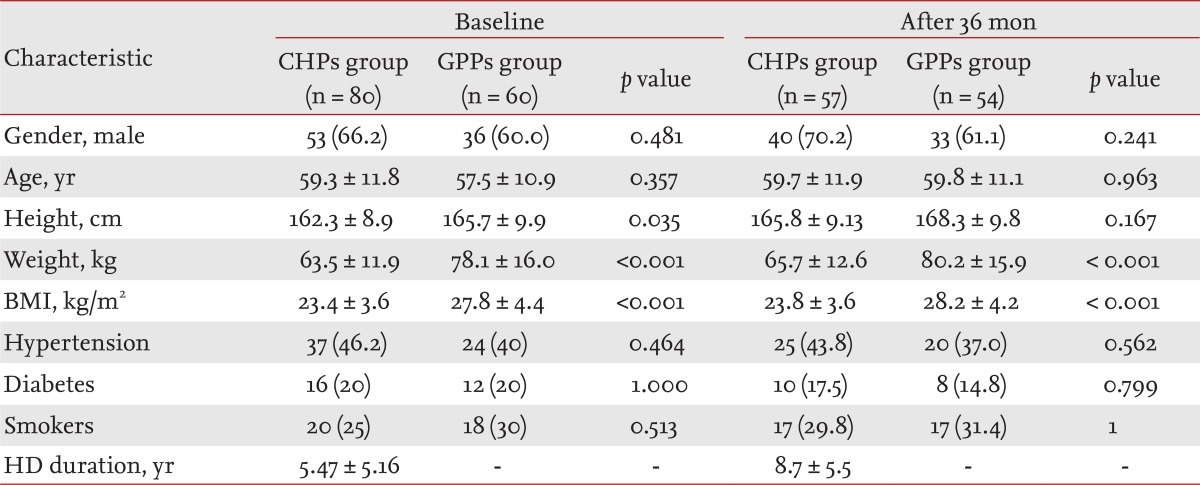
Demographic characteristics of the patients studied
The mean aortic PWVs were: PWV1 = 11.18 ± 2.29 m/sec (baseline) and PWV2 = 11.82 ± 2.34 m/sec (36 months) in the CHP group, and PWV1 = 9.02 ± 1.89 m/sec and PWV2 = 9.29 ± 1.93 m/sec in the GPP group. The average aortic PWV progression in the CHP group (ΔPWVCHP) was 63.95 ± 18.373 cm/sec (5.72%) during the investigated period of 36 months, or 1.78 ± 0.510 cm/sec per month. The average aortic PWV progression in the GPP group (ΔPWVGPP) for the same period was 27.28 ± 28.519 (2.99%) or 0.75 ± 0.792 cm/sec per month.
There was no regional heterogeneity (p = 0.2056) in ΔPWV progression (ΔPVW1 and ΔPVW2) with advancing age in GPP: PWVbaseline = 7.20 ± 1.03 m/sec and PWV36 mon = 7.44 ± 1.06 m/sec with the average PWV progression ΔPVW1 = 28.06 ± 12.67 cm/sec during 36 months (in individuals aged ≤ 50 years, mean age 44.5 ± 4.04 years) and PWVbaseline = 9.81 ± 1.6 m/sec and PWV36 mon = 10.11 ± 1.65 m/sec with the average PWV progression ΔPVW2 = 32.35 ± 0.105 cm/sec during 36 months, which was evident in individuals aged > 50 years (mean age, 62.24 ± 8.58 years).
The mean PWV in CHP aged equal to or less than 50 years at baseline was 9.90 ± 2.41 m/sec versus 7.20 ± 1.03 m/sec in the GPP group with same age and estimate period. The ΔPWV in relatively young subjects in the CHP group was 55.4 ± 18.2 cm/sec versus 28.06 ± 12.67 cm/sec in the GPP after 36 months (p < 0.001).
There was no statistical significance to our finding of a sex-related difference in the stiffening progression of aorta in the CHP group (p = 0.1698). In the GPP group, the progression of PWV was expressed more in females (30.4 ± 12.8 cm/sec for the 36-month period, mean age 57.0 years) than in males (23.5 ± 8.12 cm/sec in the same period, mean age 56.8 years) (p = 0.001).
Comparison of PWV values between baseline and first-point estimation within the CHP and GPP groups (mean difference, t test, and two-tailed probability p) is presented in Fig. 2.

Paired t test between baseline and 36 months within each group. PWV, pulse wave velocity; CHP, chronic hemodialysis patient; GPP, general population patient; CI, confidence interval.
There was a pronounced progression of PWV in CHP during the 36-month period (mean difference 0.639 ± 0.183 m/sec, p < 0.001) compared to the progression of PWV in GPP during the same period (mean difference 0.272 ± 0.285 m/sec, p < 0.001). The value of the t statistic of the CHP group (26.278) was significantly greater than that of the GPP group (6.964), resulting in greater statistical significance between the rates of progression in the CHP (p = 0.001) compared to the GPP (p = 0.001) group.
The comparison of PWV values at the same estimation point (baseline or 36 months) between two groups by t test for unpaired data between GPPs and CHPs is presented in Fig. 3.

Test for unpaired data between the general population patient (GPP) and chronic hemodialysis patient (CHP) groups. PWV, pulse wave velocity.
There was high statistical significance between the mean PWV in the GPP and CHP groups at baseline (9.02 ± 1.89 and 11.18 ± 2.29 m/sec, respectively, p < 0.001). There was also high statistical significance between the mean PWV in the GPP and CHP groups after 36 months (9.29 ± 1.93 and 11.82 ± 2.34 m/sec, respectively, p < 0.001). The F values, used to compare the variance of the two groups, were 0.177 at baseline and 0.164 after 36 months.
In Fig. 4, we present no absolute values of PWV for baseline and 36 months, but rather the change in PWV estimated in each of two groups: PWV36 mon - PWVbaseline = ΔPWV. Box plots of the mean progression of PWV (ΔPWV) are presented separately for the CHP and GPP groups. The mean, range, median, 25th and 75th percentiles, t statistic (0.001), difference, F value for equal variance, and two-tailed probability (p < 0.001) are also shown.

Pronounced progression of arterial stiffness in chronic hemodialysis patient (CHP) compared to the general population patient (GPP) group: t test for unpaired data. PWV, pulse wave velocity.
Tables 2 and 3 list the mean values of the clinical parameters assessed at baseline and after 36 months in the CHP and GPP groups, and their correlations with PWV as determined by bivariate Pearson's correlation analysis.
Bivariate Pearson's correlation analysis of pulse wave velocity and laboratory markers in the chronic hemodialysis patient group
Bivariate Pearson's correlation analysis of pulse wave velocity and laboratory markers in the general population patient group
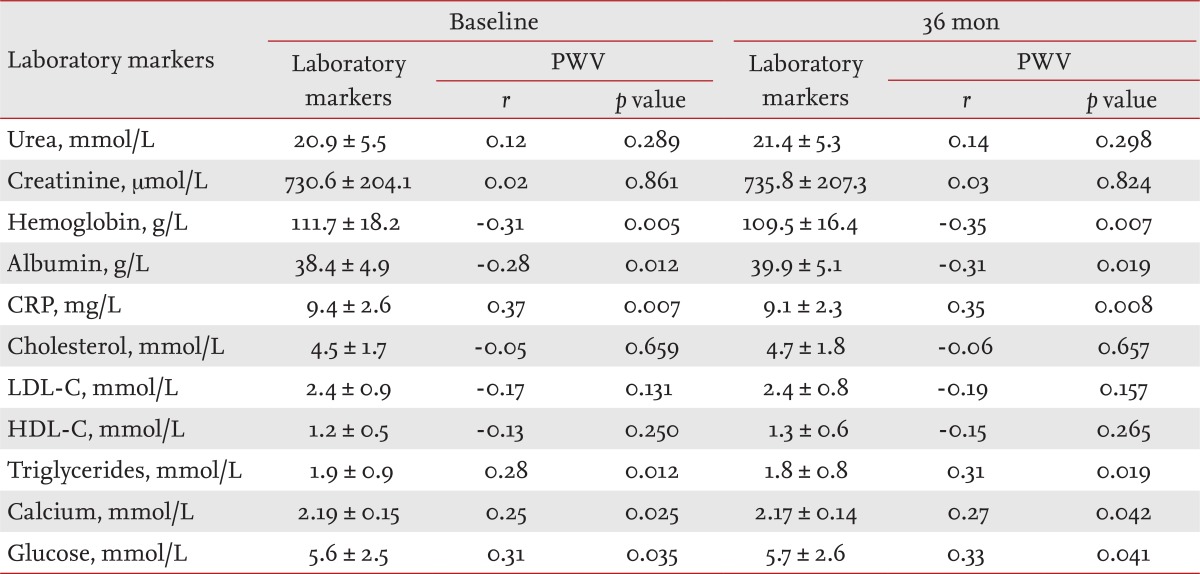
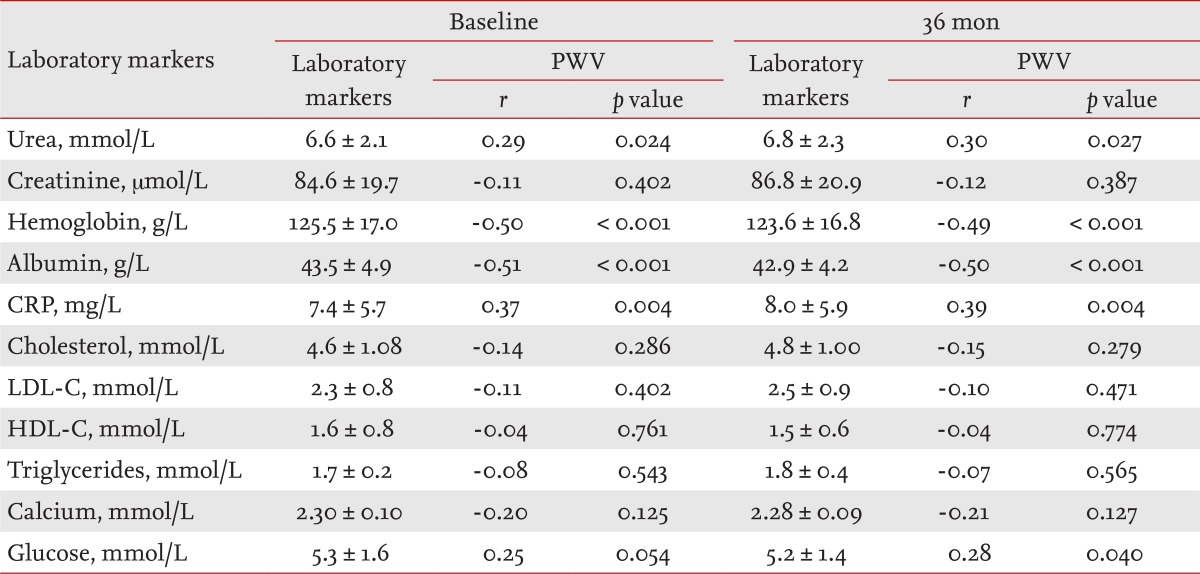
The levels of laboratory markers involved in atherosclerotic process (albumin, CRP, cholesterol, LDL-C, HDL-C, triglycerides), traditional blood renal markers (urea, creatinine), hemoglobin, serum calcium, and glucose are presented in Table 2 (CHP group) and Table 3 (GPP group), separately for baseline and 36 months. The results of the bivariate Pearson's correlation analysis of aortic PWV and laboratory markers are presented as r indexes and p values.
The positive value of Pearson product-moment correlation coefficient (r), as a measure of the strength of linear dependence between two variables in CHP (one of the measured laboratory markers and PWV) indicated significant positive correlations between: CRP and PWV (r = 0.37, p = 0.007), triglycerides and PWV (r = 0.28, p = 0.012), serum calcium and PWV (r = 0.25, p = 0.025), and glucose and PWV (r = 0.31, p = 0.035). Pearson's r values revealed significant negative correlations between: hemoglobin (r = -0.31, p = 0.005) and albumin (r = -0.28, p = 0.012) (Table 2).
Pearson's product-moment correlation coefficients (r), in the GPP group (one of the measured laboratory markers and PWV) indicated significant positive correlations between: urea and PWV (r = 0.29, p = 0.024), CRP and PWV (r = 0.37, p = 0.004, and glucose and PWV (r = 0.25, p = 0.054). Pearson's r revealed significant negative correlations between: hemoglobin (r = -0.50, p = 0.000 and PWV and albumin and PWV (r = -0.51, p = 0.000 (Table 3).
The above mentioned results were calculated using baseline data from the CHP and GPP groups.
A t test for unpaired data between laboratory markers in the CHP and GPP groups for both estimated periods showed significant differences in urea, creatinine, hemoglobin, albumin, and calcium (p = 0.001); HDL-C (p = 0.000 and CRP (p = 0.0062), but not glucose (p = 0.4178), cholesterol (p = 0.6905), triglycerides (p = 0.0935), and LDL-C (p = 0.4964) (Table 4).
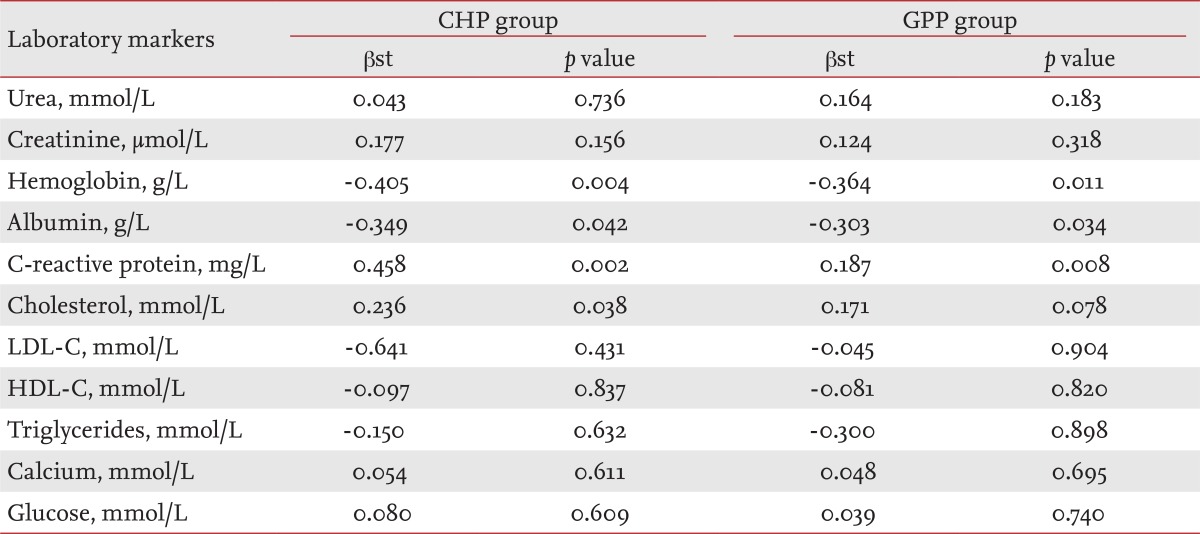
Multiple regression analysis of determinants of Δpulse wave velocity in the chronic hemodialysis patient and general population patient groups
Assessments (standardized coefficient β [βst] and p value) of independent predictors or determinants (laboratory markers) for increasing PWV in the CHP and GPP groups after multiple regression analysis are shown in Table 4. The absolute value of PWV was not chosen as a dependent variable for either time period; instead, we used the difference in PWV at baseline and after 36 months (ΔPWV = PWV36 mon - PWVbaseline). We conducted a multiple regression analysis to determine the effect on the dependent variable (ΔPWV) of variations in one of the independent variables (hemoglobin, albumin, CRP, etc.), while the other independent variables were fixed. p values followed the order of: CRP (0.002), hemoglobin (0.004), cholesterol (0.038) and albumin (0.042) in the CHP group; and CRP (0.008), hemoglobin (0.011), and albumin (0.034) in the GPP group.
DISCUSSION
To our knowledge, this is the first longitudinal prospective study to evaluate the progression of arterial stiffness over an extended period of time and make comparisons between a hemodialysis group and the general population. In this study, 80 patients from two hemodialysis centers and 60 GPPs from ambulatory internal medicine were recruited and examined between December 2009 and December 2012. Each participant was subjected to noninvasive diagnostic Doppler ultrasonography and blood biochemistry tests.
We examined whether the increase in arterial stiffness is greater among CHP than among GPP. In our study, the control group (GPP) did not include a young healthy population; it consisted of participants from the general population who were not spared from the normal process of atherosclerosis, aging, and osteoporosis. The patients in this group had functioning kidneys, to exclude the influence of renal comorbidity.
In this Doppler-based study to estimate arterial stiffness, we detected a high prevalence of increased PWV in a relatively young hemodialysis patient population. Vascular stiffening likely begins much earlier and progresses more rapidly in hemodialysis patients (p < 0.001). The PWV value measured at baseline was markedly higher (24%) in CHP than in GPP, with a greater than twofold higher annual increase.
The CHP group showed higher aortic PWV than GPP subjects of similar age, but whether increased PWV is a consequence of renal disease or reflects vascular disease, diabetes, and hypertension is unknown. In the GPP group, only factors associated with the progression of arterial stiffness in the elderly were evident (traditional risk factors), but in CKD patients, arterial stiffness (i.e., PWV) is accelerated due to synergism between age and traditional risk factors plus factors related to renal comorbidity (nontraditional risk factors). Because an increase of 1 m/sec in aortic PWV has been shown to equate to a 39% increased risk of CV events [12], our data suggest that the risk in the CHP group increases about every 5 years. For CKD patients, for every decade of age there is an increase in PWV of 1.1 m/sec (95% confidence interval [CI], 0.9 to 1.2) compared to 0.3 m/sec (95% CI, 0.29 to 0.39) for healthy controls [13]. The marked increase in aortic stiffness with age with little change in peripheral arterial stiffness results in a reversal of the gradient of arterial stiffness from the youthful pattern of a compliant proximal aorta, which was evident in individuals aged < 50 years, to a pattern of greater aortic stiffness in older participants [14]. Aortic PWV in the GPP group increased more rapidly with age in females than in males, crossing over around age 45, whereas there is no significant difference between the sexes in carotid-femoral PWV. Although it remains controversial, a greater increase in aortic stiffness with age among females in the general population, particularly with menopause, has been reported. In particular, ΔPWW is higher in females by ~3.5% (our result) after menopause, in part because of the lesser height, and therefore closer physical proximity between the heart and reflecting sites, of females [15].
In our study (by bivariate Pearson correlation, at baseline) we found that among CHP, there were significant positive correlations between PWV and CRP (p < 0.007), PWV and triglycerides (p = 0.012), PWV and serum calcium (p = 0.025), PWV and glucose (p = 0.035); we also found negative correlations for PWV with hemoglobin (p = 0.005), and serum albumin (p = 0.012) (Table 2).
Low serum albumin in the CHP group has been reported to be a powerful predictor of mortality in cross-sectional studies of hemodialysis patients. Danielski et al. [16] found significantly higher oxidative stress in a hypoalbuminemia group of hemodialysis patients than in a normoalbuminemia group. Increased oxidative stress may, in turn, accelerate the atherosclerotic process with consecutive acceleration of arterial stiffness with increased PWV. Recently, Washida et al. [17] reported that arterial stiffness constitutes a novel predictor of the severity of CV disease in patients with ESRD, in addition to the classical risk factors. They reported lower serum albumin levels and higher serum CRP levels in hemodialysis patients with severe lacunes [18]. In summary, our results suggest that the significance of the correlation between PWV and serum CRP levels (p = 0.007) in the CHP group was superior to that of the correlation between PWV and serum albumin (p = 0.012). We also found greater statistical significance for the correlation of PWV with CRP (p = 0.002) than with albumin (p = 0.042) by multiple regression analysis.
Hypoalbuminemia is often accompanied with dyslipidemia in patients with nephrotic syndrome and dialysis patients. Dyslipidemia plays an important role in the pathogenesis of atherosclerosis and is a risk factor for CV disease. Elevated levels of circulating triglycerides and increased arterial stiffness were associated with CV disease (p = 0.012) only in the CHP group, but PWV was more significantly associated with the triglycerides after adjusting for age, sex, BMI, hemodialysis duration, and diabetes mellitus status (p = 0.005). Our findings suggest that patients with diabetes have increased central (aortic) artery stiffness. In addition, in multiple regression analysis, diabetes was not a predictor of central artery stiffness, indicating that glucose is not a determinant of peripheral artery stiffness (βst = 0.080, p = 0.609) in CHP. Our data demonstrate that in hemodialysis patients, aortic PWV is significantly (p = 0.005) negatively associated with serum hemoglobin concentration; in the multivariate regression analysis serum hemoglobin was one of the most powerful predictors (βst = -0.405, p = 0.004) of an increased PWV.
We identified associations between arterial stiffness and urea; arterial stiffness and hemoglobin; arterial stiffness and serum albumin; arterial stiffness and CRP, and arterial stiffness and glucose in the GPP group (Table 3). An elevated plasma concentration of CRP, an acute-phase marker of systemic inflammation and hypoalbuminemia, has been shown to predict events in the general population and CV and total mortality in hemodialysis patients [19]. CRP was the most powerful independent predictor (βst = 0.187, p = 0.008) of an increased PWV in the GPP group (multivariate regression analysis).
While traditional risk factors predominated in the general population, in CHPs, nontraditional risk factors play an increasingly important role, being perhaps dominant in ESRD patients. Recently, many studies have focused on newly discovered nontraditional risk factors, such as vitamin D deficiency, CRP, fibrinogen, hyperhomocysteinemia, high plasma norepinefrin, accumulation of the endogenous inhibitor of the nitric oxide synthase asymmetric dimethylarginine, extracellular volume overload, hyperphosphatemia, and oxidant stress as a link between traditional and other nontraditional risk factors in CHPs. Nontraditional risk factors are more prevalent in ESRD patients compared to the general population [20]. These include specific factors like uremia, infection, biocompatibility of dialysis membranes, hyperhomocysteinemia, acidosis, and hyperphosphatemia. However, while the genesis of these factors and their role in atherosclerosis are out with the scope of this study, we can ascertain that the progression of blood vessel aging is significantly greater in dialysis patients. In this population, the chronological age is greater than biological age, expressed through the increased arterial stiffness. The progression of PWV in our study over a 36-month period, and the significant difference between the CHP and GPP groups, suggest that arterial stiffening has progressed further in dialysis patients compared to the general population, which suggests a significant distinction in the aging and stiffness of their arteries, and so the biological age of both populations. Fortunately, arterial stiffening can be monitored by a simple noninvasive method, measuring the PWV, which enables evaluation of the risk of CV events.
In conclusion, accelerated arterial aging with consecutive accelerated progression of arterial stiffness was more pronounced in the CHP group than in the GPP group. The independent determinants of this progression in both groups were traditional risk factors and blood hemoglobin, albumin and CRP levels. Cholesterol and uremia-related factors are determinants only in CHP.
GPPs have an increased vascular stiffness; this is associated with traditional risk factors and urea, hemoglobin, albumin, CRP, and glucose levels. Nontraditional risk factors, or uremia-related specific factors-such as anemia (hemoglobin), inflammation (CRP), hypoalbuminemia, and abnormal lipoproteins-might play a role in the accelerated progression of arterial stiffness only in CHPs.
KEY MESSAGE
1. Progression of arterial stiffness between hemodialysis and general population patients evaluated in longitudinal prospective study in 3 years period.
2. Comparative presentation of monthly and annual pulse wave velocity (PWV) progression between chronic hemodialysis patients and general population patients.
3. Interesting way of measuring arterial stiffness with noncommercial, not specialized device for PWV evaluation which presents a difference of atherosclerosis progression between two mentioned groups.
Notes
No potential conflict of interest relevant to this article is reported.