Pleural fluid cytokines in malignant pleural effusion: associations with lung expandability and prediction of pleurodesis outcome
Article information

Abstract
Background/Aims
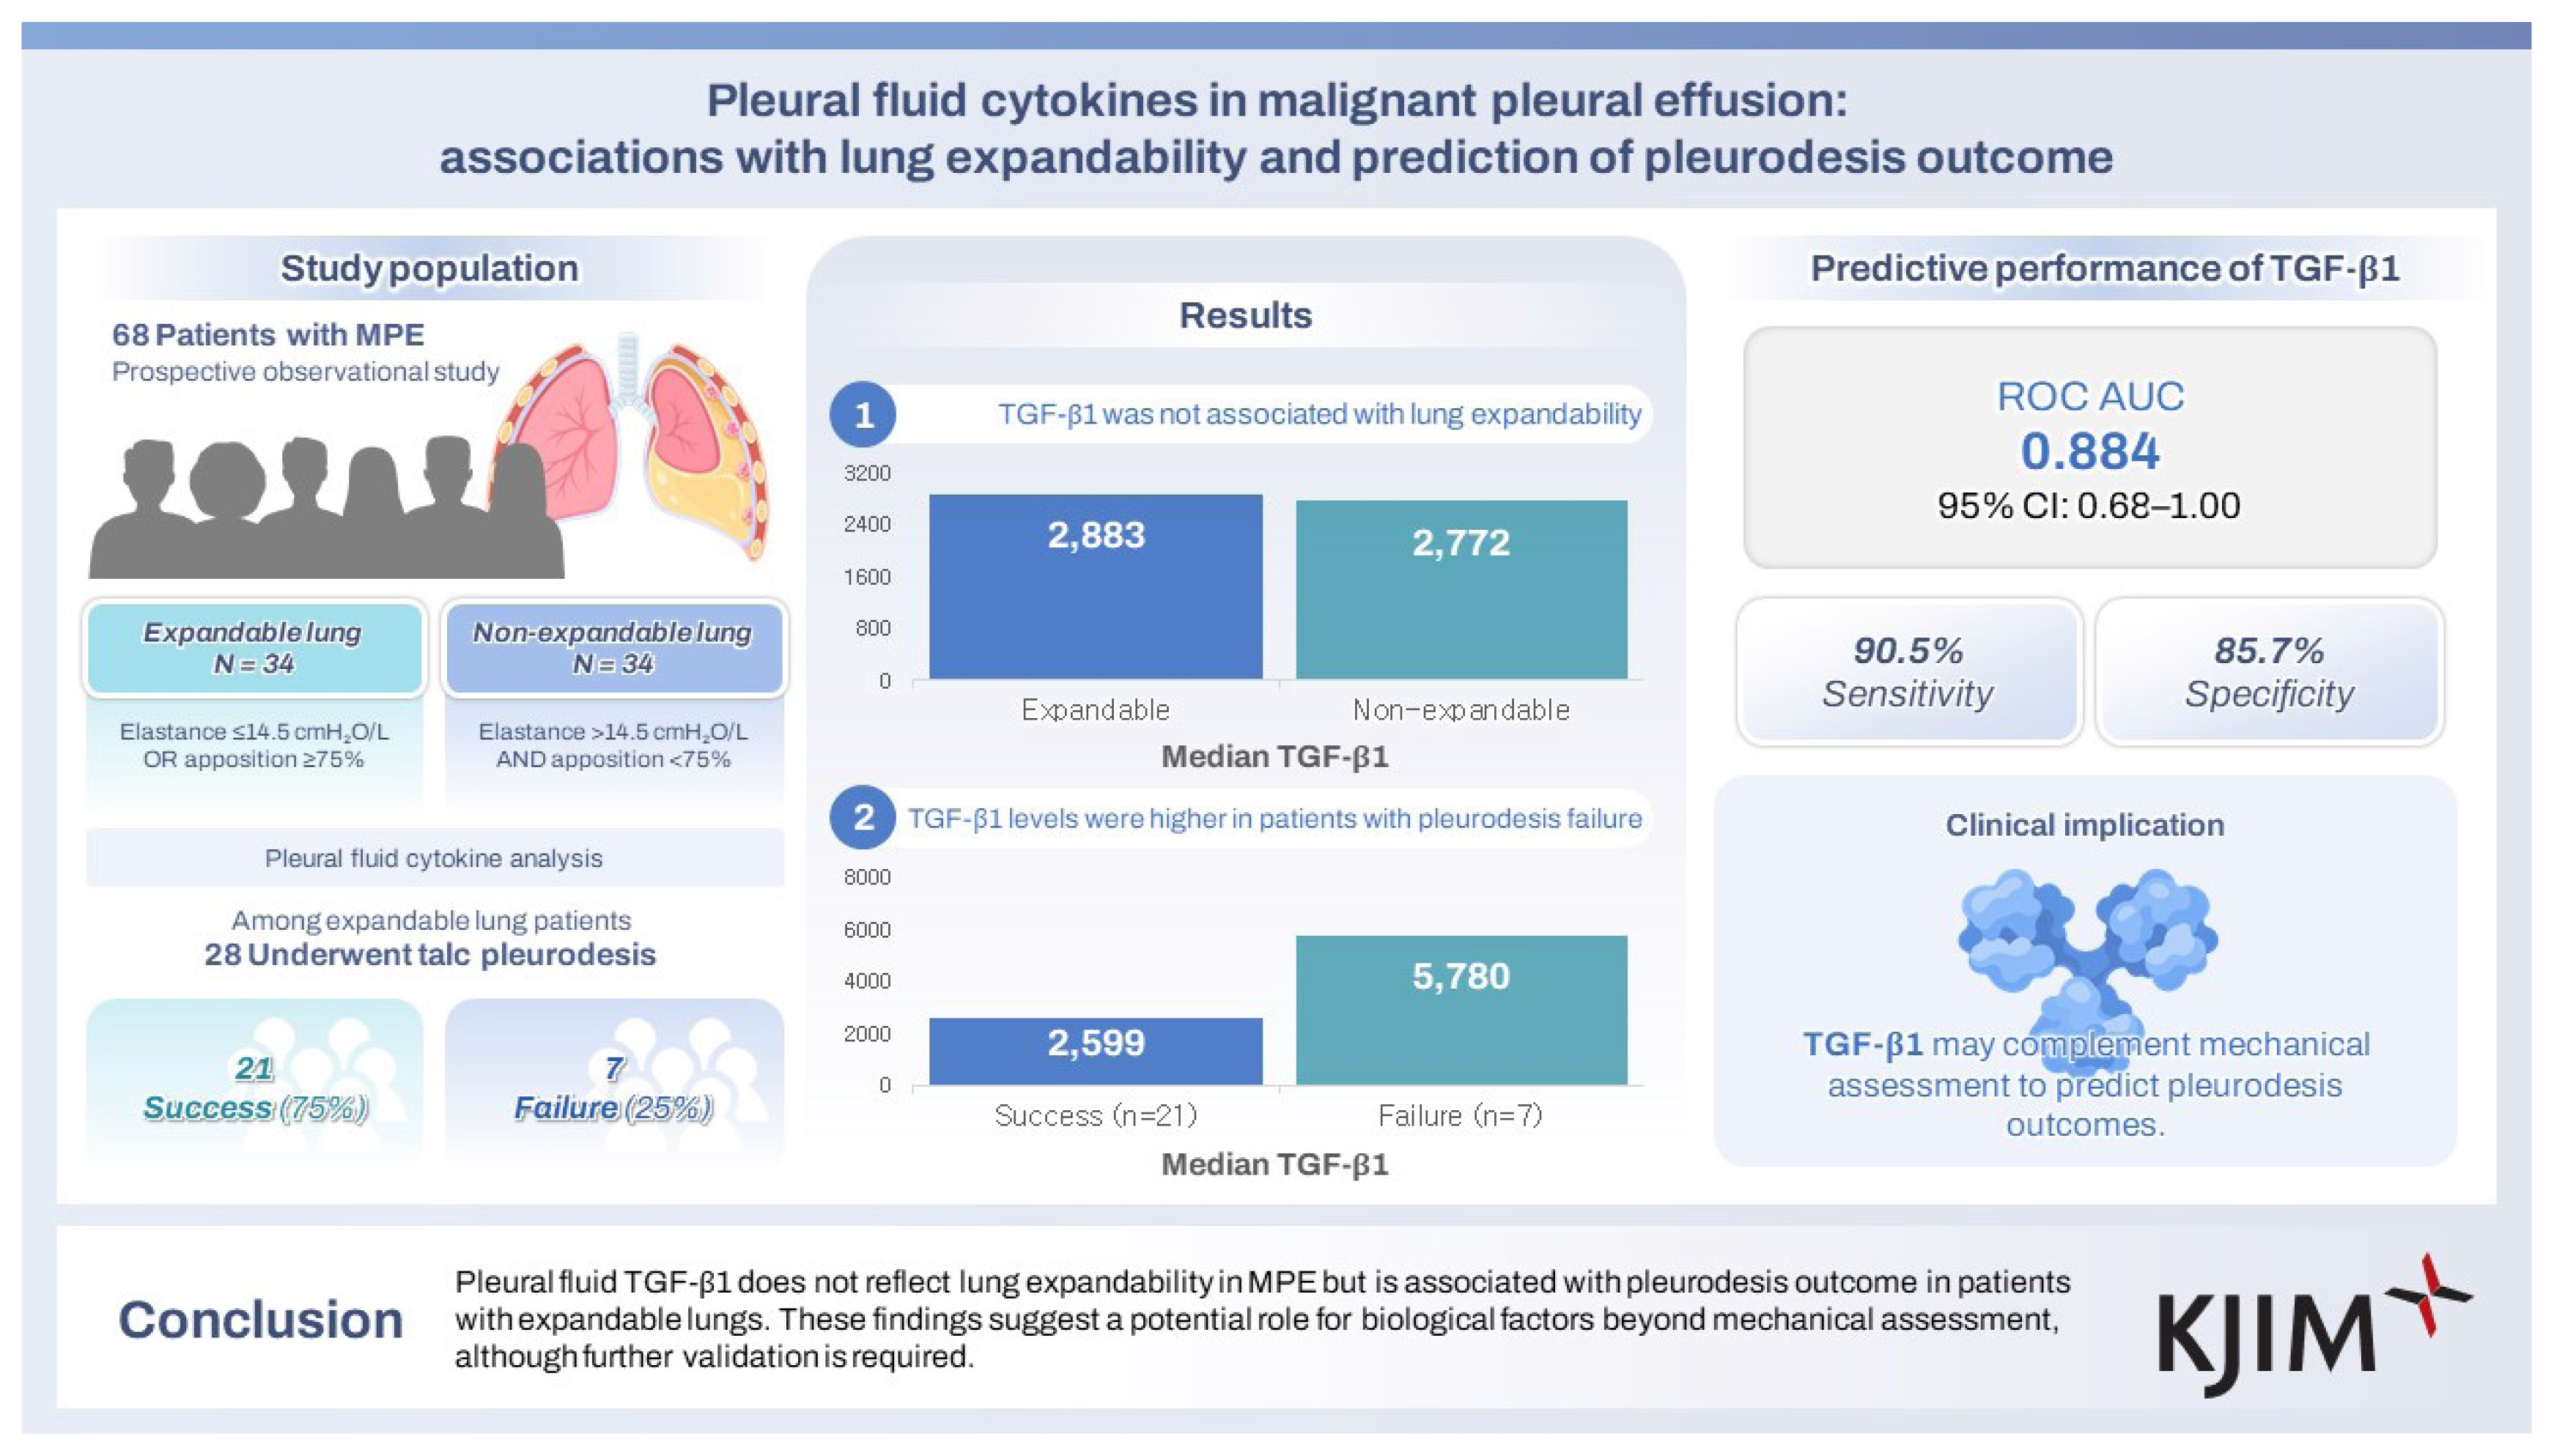
Lung expandability is a key determinant of successful pleurodesis in malignant pleural effusion (MPE). Although pleural elastance is widely used to assess expandability, pleurodesis may still fail in some patients with low elastance. This study investigated pleural fluid cytokines as potential biomarkers for lung expandability and pleurodesis outcome in MPE.
Methods
Sixty-eight patients with MPE were prospectively enrolled and categorized into expandable lung (n = 34; pleural elastance ≤ 14.5 cmH2O/L or pleural apposition ≥ 75%) and non-expandable lung (n = 34; pleural elastance > 14.5 cmH2O/L and pleural apposition < 75%) groups. Pleural fluid concentrations of 28 cytokines, including transforming growth factor-β1 (TGF-β1), were measured using multiplex immunoassays and compared between groups. Among patients with expandable lungs, pleurodesis outcomes were recorded, and the discriminative performance of cytokines was evaluated.
Results
Cytokine levels, including TGF-β1, did not differ significantly between expandable and non-expandable lungs, and no significant correlations were observed between pleural elastance and cytokine concentrations. Among the 28 patients undergoing pleurodesis, those with pleurodesis failure (25%) had significantly higher TGF-β1 levels than those with successful pleurodesis (median [interquartile range]: 5,779.83 [3,924.54–9,705.53] pg/mL vs. 2,598.93 [1,425.35–3,294.35] pg/mL; p = 0.0016). TGF-β1 demonstrated good discriminative performance for predicting pleurodesis outcome (area under the curve 0.884).
Conclusions
Pleural fluid TGF-β1 does not reflect lung expandability in MPE but is associated with pleurodesis outcome in patients with expandable lungs. These findings suggest a potential role for biological factors beyond mechanical assessment, although further validation is required.
INTRODUCTION
Malignant pleural effusion (MPE) is a clinically significant condition associated with substantial morbidity, mortality, and symptom burden. Medical pleurodesis, most commonly performed using talc, is a standard palliative treatment that achieves pleural symphysis through inflammation and fibrotic processes [1]. Successful pleurodesis requires adequate visceral–parietal pleural apposition; however, fibrotic stiffening of the visceral pleura—commonly referred to as non-expandable or trapped lung—is a major cause of pleurodesis failure [2].
Accurate assessment of lung expandability before pleurodesis is therefore essential. Measurement of pleural elastance remains the preferred method, while chest radiography provides supportive but limited information [3]. Nevertheless, even among patients classified as having expandable lungs, pleurodesis success rates reach only approximately 78%, highlighting the limitations of mechanical assessment alone and the need for more precise predictive markers [4].
MPE is characterized by a high fibrotic potential, driven in part by transforming growth factors secreted by tumor cells within the pleural space. These cytokines promote fibroblast proliferation and extracellular matrix deposition, leading to fibrotic organization of the visceral pleura [5]. Such biological processes may restrict pleural plasticity and impair effective pleural symphysis, even when lung expansion appears mechanically adequate.
This study therefore aimed to (1) compare pleural fluid cytokine levels between expandable and non-expandable lungs in patients with MPE, and (2) evaluate the potential of these cytokines as biomarkers for predicting pleurodesis outcomes.
METHODS
Study design
This prospective observational study was conducted at King Chulalongkorn Memorial Hospital, affiliated with The Thai Red Cross Society, in Bangkok, Thailand, between October 2024 and January 2025. Consecutive patients with cancer-related pleural effusion were prospectively enrolled. The study was approved by the Institutional Review Board of the Faculty of Medicine, Chulalongkorn University (IRB No.547/67). Written informed consent was obtained from all participants in accordance with the Declaration of Helsinki and Good Clinical Practice guidelines.
Study population
Patients aged ≥ 18 years with cytology-confirmed MPE were classified into two groups based on pleural elastance (measured by pleural manometry) and pleural apposition (assessed on post-thoracentesis chest radiography):
Expandable lung: pleural elastance ≤ 14.5 cmH2O/L or pleural apposition ≥ 75%.
Non-expandable lung: pleural elastance > 14.5 cmH2O/L and pleural apposition < 75% [6].
Exclusion criteria included: pleural infection or pneumonia within the preceding three months; prior pleural interventions (e.g., chest drain, pleurodesis, or pleuroscopy) other than diagnostic thoracentesis; or current use of immuno-modulating agents other than standard oncologic therapy.
Pleural manometry, sample collection, and processing
Pleural fluid was obtained via therapeutic thoracentesis, during which pleural manometry was performed manually using a custom-made U-tube water manometer. A sterile, fluid-filled extension tube was connected to a three-way stopcock attached to the thoracentesis catheter, with the distal end of the tube open to the atmosphere and positioned against a centimeter-scaled ruler. To ensure standardized pressure readings, the zero level of the water column was referenced to the puncture level while in a seated or semi-recumbent position. Pleural pressure (Ppl) was measured as the vertical displacement of the water column in cmH2O at the end of expiration. Measurements were recorded at the initiation of drainage and after every 200 mL of pleural fluid removal. Fluid drainage was manually terminated if the patient developed an intractable cough, significant chest pain, or if the Ppl dropped to −20 cmH2O or lower [7]. Pleural elastance was then calculated as the total change in Ppl (cmH2O) divided by the total volume of fluid removed in liters.
Routine biochemical and cytological analyses were performed, including cell count, lactate dehydrogenase (LDH), protein, glucose, cholesterol, and triglycerides. An additional 50 mL of pleural fluid was refrigerated at 4°C during transport, centrifuged at 2,000 g for 10 minutes, and the supernatant stored at −70°C for cytokine analysis.
Cytokine measurement
Pleural fluid cytokine concentrations were measured using the Bio-Plex Pro transforming growth factor-β1 (TGF-β1) assay and Bio-Plex Pro Human Cytokine 27-plex assay (Bio-Rad Laboratories, Inc., Hercules, CA, USA). Samples, standards, and controls were incubated with capture beads, followed by detection antibodies and streptavidin-phycoerythrin. Fluorescence intensity was measured using the Bio-Plex 200 System, and data were analyzed using Bio-Plex Manager Software (Bio-Rad Laboratories, Inc.).
Pleurodesis assessment
Patients with expandable lungs underwent talc pleurodesis. Talc pleurodesis was performed using either 4–8 g of sterile graded talc poudrage during medical thoracoscopy or 4 g of talc slurry administered via a small-bore chest tube. The choice of method was at the discretion of the attending pulmonologist. Of the 28 patients, 19 (67.9%) received talc poudrage and 9 (32.1%) received talc slurry. Pleurodesis outcomes were assessed at baseline, two weeks, and four weeks after the procedure. Pleurodesis success was defined as:
Complete: resolution of dyspnoea with no radiographic fluid re-accumulation.
Partial: improvement in dyspnoea with < 50% radiographic re-accumulation and no requirement for further thoracentesis.
Pleurodesis failure was defined as persistent symptoms, > 50% fluid re-accumulation, or the need for repeat thoracentesis within 30 days [8].
Outcomes
The primary outcome was the difference in pleural fluid TGF-β1 levels between expandable and non-expandable lungs. Secondary outcomes included: (1) differences in pleural fluid concentrations of 27 cytokines (interleukin [IL]-1β, IL-1ra, IL-2, IL-4, IL-5, IL-6, IL-7, IL-8, IL-9, IL-10, IL-12, IL-13, IL-15, IL-17, basic fibroblast growth factor, eotaxin, granulocyte colony-stimulating factor, granulocyte–macrophage colony-stimulating factor, interferon-γ, interferon gamma-induced protein 10, monocyte chemoattractant protein-1, macrophage inflammatory protein-1α, macrophage inflammatory protein-1β, platelet-derived growth factor-BB, regulated on activation, normal T-cell expressed and secreted, tumor necrosis factor-α, and vascular endothelial growth factor) between expandable and non-expandable lungs; (2) differences in cytokine levels between successful and failed pleurodesis within the expandable lung group; and (3) correlations between pleural elastance and cytokine concentrations. TGF-β1 was prespecified as the primary biomarker of interest based on its established role in pleural fibrosis, while the remaining cytokines were analyzed in an exploratory manner.
Statistical analysis
The required sample size (n = 68; 34 per group) was calculated using G*Power, assuming a large effect size (Cohen’s d = 0.8), 90% power, and a two-sided α of 0.05. Baseline characteristics were summarized using descriptive statistics and reported as frequency (percentage), mean (standard deviation), or median (interquartile range, IQR), as appropriate. Categorical variables were compared using the chi-square test or Fisher’s exact test, and continuous variables using the independent t-test for normally distributed data or the Mann–Whitney U-test for non-normally distributed data.
The primary outcome (difference in pleural fluid TGF-β1 between expandable and non-expandable lungs) was prespecified and analyzed using the Mann–Whitney U-test. Secondary outcomes included exploratory analyses of the broader cytokine panel, associations with pleurodesis outcomes, correlations with pleural elastance, and evaluation of discriminative performance using receiver operating characteristic (ROC) analysis.
Initial comparisons between groups were performed using unadjusted analyses. For cytokine panel analyses, results were considered exploratory and p-values were adjusted for multiple comparisons using the Benjamini–Hochberg false discovery rate (FDR) procedure.
Multivariable logistic regression analysis was performed to identify independent predictors of pleurodesis success. Given the limited number of outcome events, the model was restricted to a small number of clinically relevant covariates (age and pleural fluid LDH) to reduce the risk of overfitting.
Correlations were assessed using Spearman’s correlation coefficient. ROC analysis was performed to evaluate discriminative performance, including area under the curve (AUC), sensitivity, specificity, positive predictive value (PPV), negative predictive value (NPV), and accuracy, with internal validation using bootstrap resampling (1,000 iterations).
Statistical significance was defined as p < 0.05. All analyses were conducted using SPSS version 29.0.1.0 (IBM Corp., Armonk, NY, USA) and Stata version 19.5 (StataCorp LLC, College Station, TX, USA).
RESULTS
A total of 68 patients with MPE were enrolled, with 34 patients in each group (Fig. 1). The mean age was 64.4 ± 13.0 years. There were no significant differences between the expandable and non-expandable lung groups in age, sex, smoking status, or cancer type. An Eastern Cooperative Oncology Group performance status ≥ 2 was more frequent in the expandable lung group than in the non-expandable lung group (97.1% vs. 76.5%, p = 0.027).
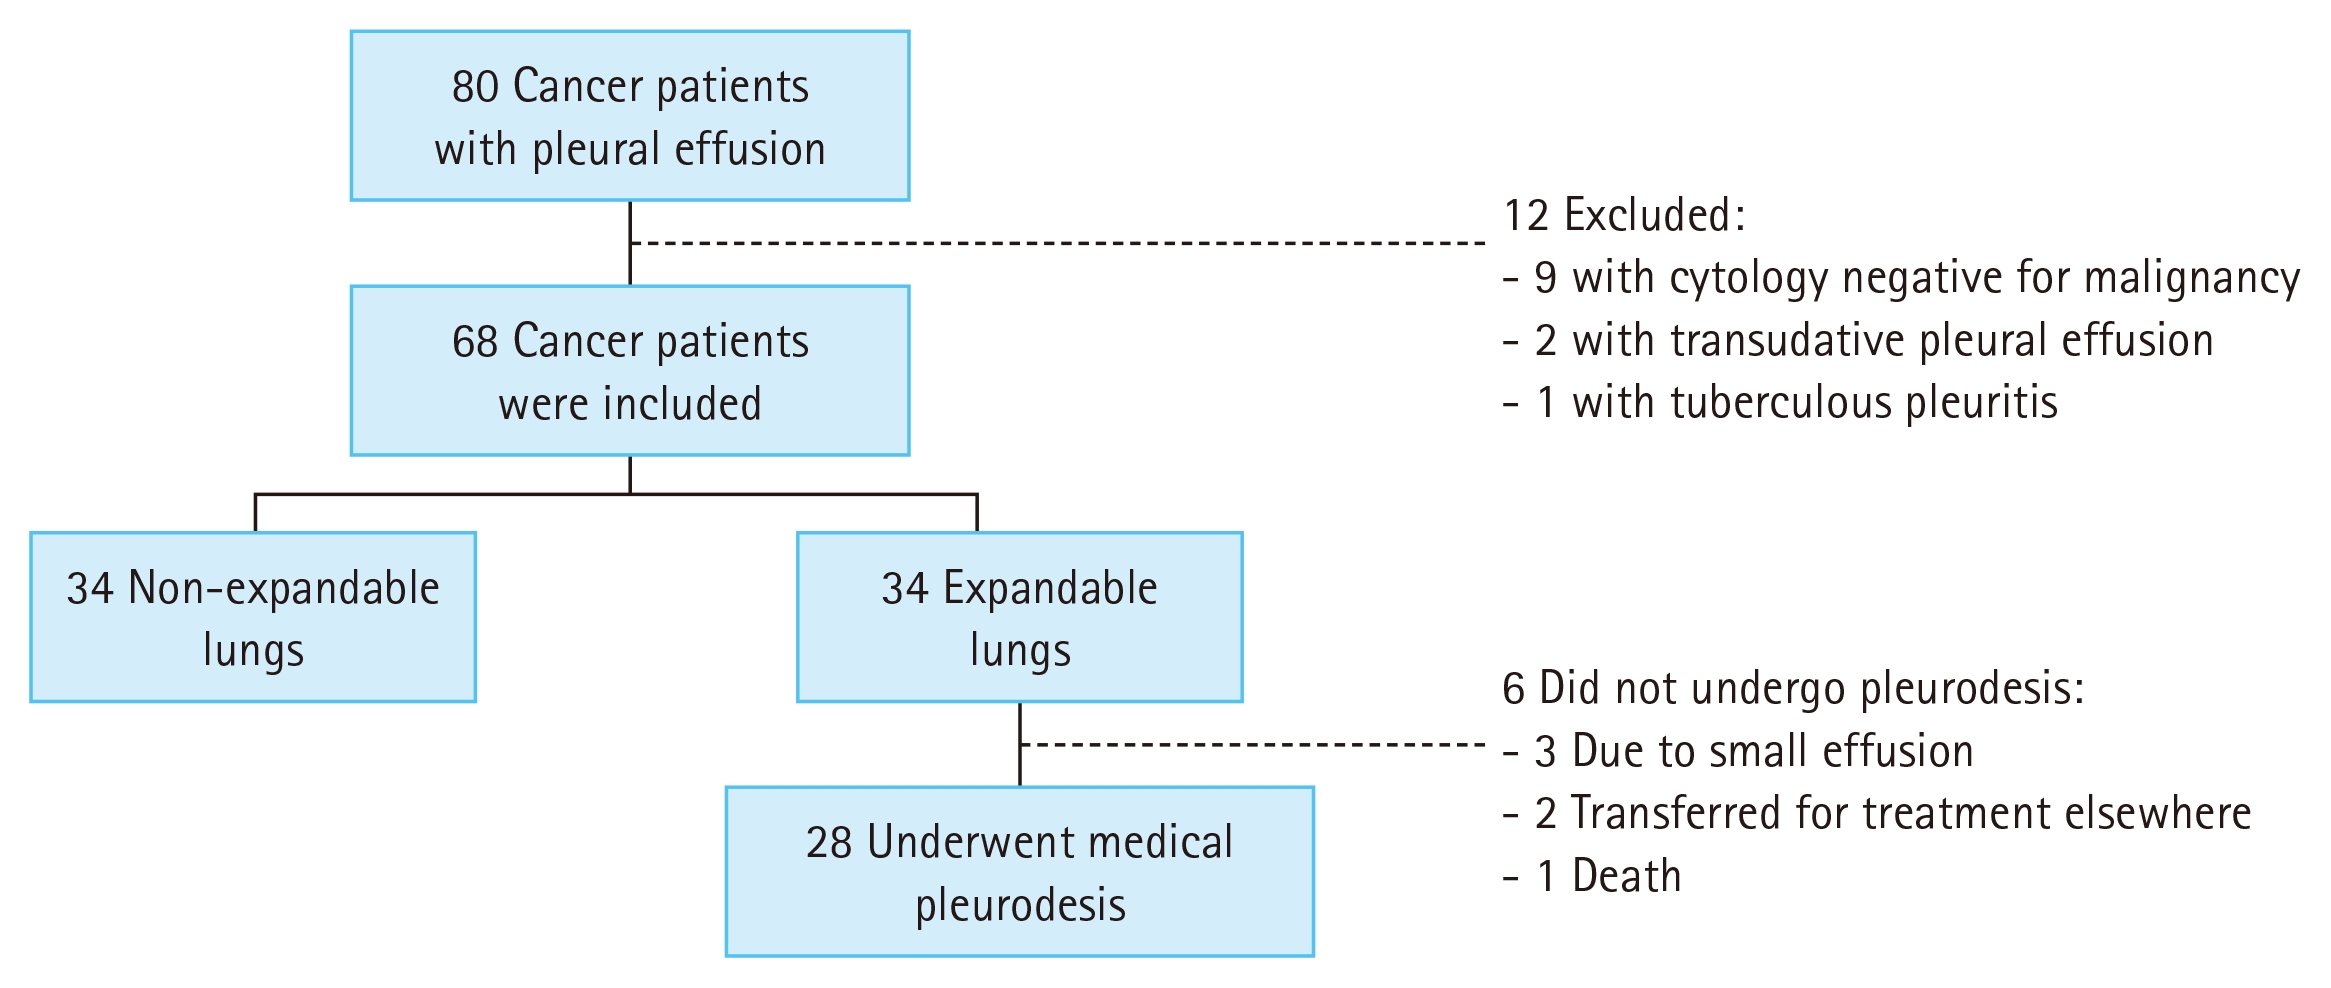
Patient flow diagram.
Pleural elastance was significantly higher in the non-expandable lung group compared to the expandable lung group (median [IQR]: 20.0 [16.5–28.9] cmH2O/L vs. 8.3 [6.6–10.0] cmH2O/L; p < 0.001), whereas pleural apposition after thoracentesis was significantly greater in the expandable lung group (p < 0.001). Pleural fluid characteristics, including total cell count, protein, LDH, and glucose, did not differ significantly between groups (Table 1).

Baseline demographic and clinical characteristics of patients with expandable and non-expandable lungs
Unadjusted analyses were first performed to screen for potential differences across the cytokine panel, followed by FDR adjustment to control for multiple testing. Pleural fluid TGF-β1 concentrations were similar between expandable and non-expandable lungs (median [IQR]: 2,882.87 [1,647.35–3,945.03] pg/mL vs. 2,772.09 [1,573.95–4,438.08] pg/mL; unadjusted p = 0.912). No significant intergroup differences were observed across the broader cytokine panel. Although IL-17 levels appeared higher in the non-expandable group in unadjusted analysis (p = 0.056), this trend did not reach statistical significance. After FDR adjustment across all 28 cytokines, no significant differences were identified (all adjusted p ≥ 0.967) (Table 2).

Comparison of pleural fluid cytokine levels between expandable and non-expandable lung groups
Among the 34 patients with expandable lungs, 28 underwent talc pleurodesis, achieving an overall success rate of 75.0% (21/28). Baseline characteristics, including cancer type, pleural apposition, and pleurodesis method, were not significantly different between pleurodesis success and failure groups (Supplementary Table 1).
While most cytokine concentrations were comparable between patients with successful and failed pleurodesis, pleural fluid TGF-β1 levels were significantly higher in those with pleurodesis failure (median [IQR]: 5,779.83 [3,924.54–9,705.53] pg/mL vs. 2,598.93 [1,425.35–3,294.35] pg/mL; unadjusted p = 0.0016; FDR-adjusted p = 0.044) (Fig. 2).
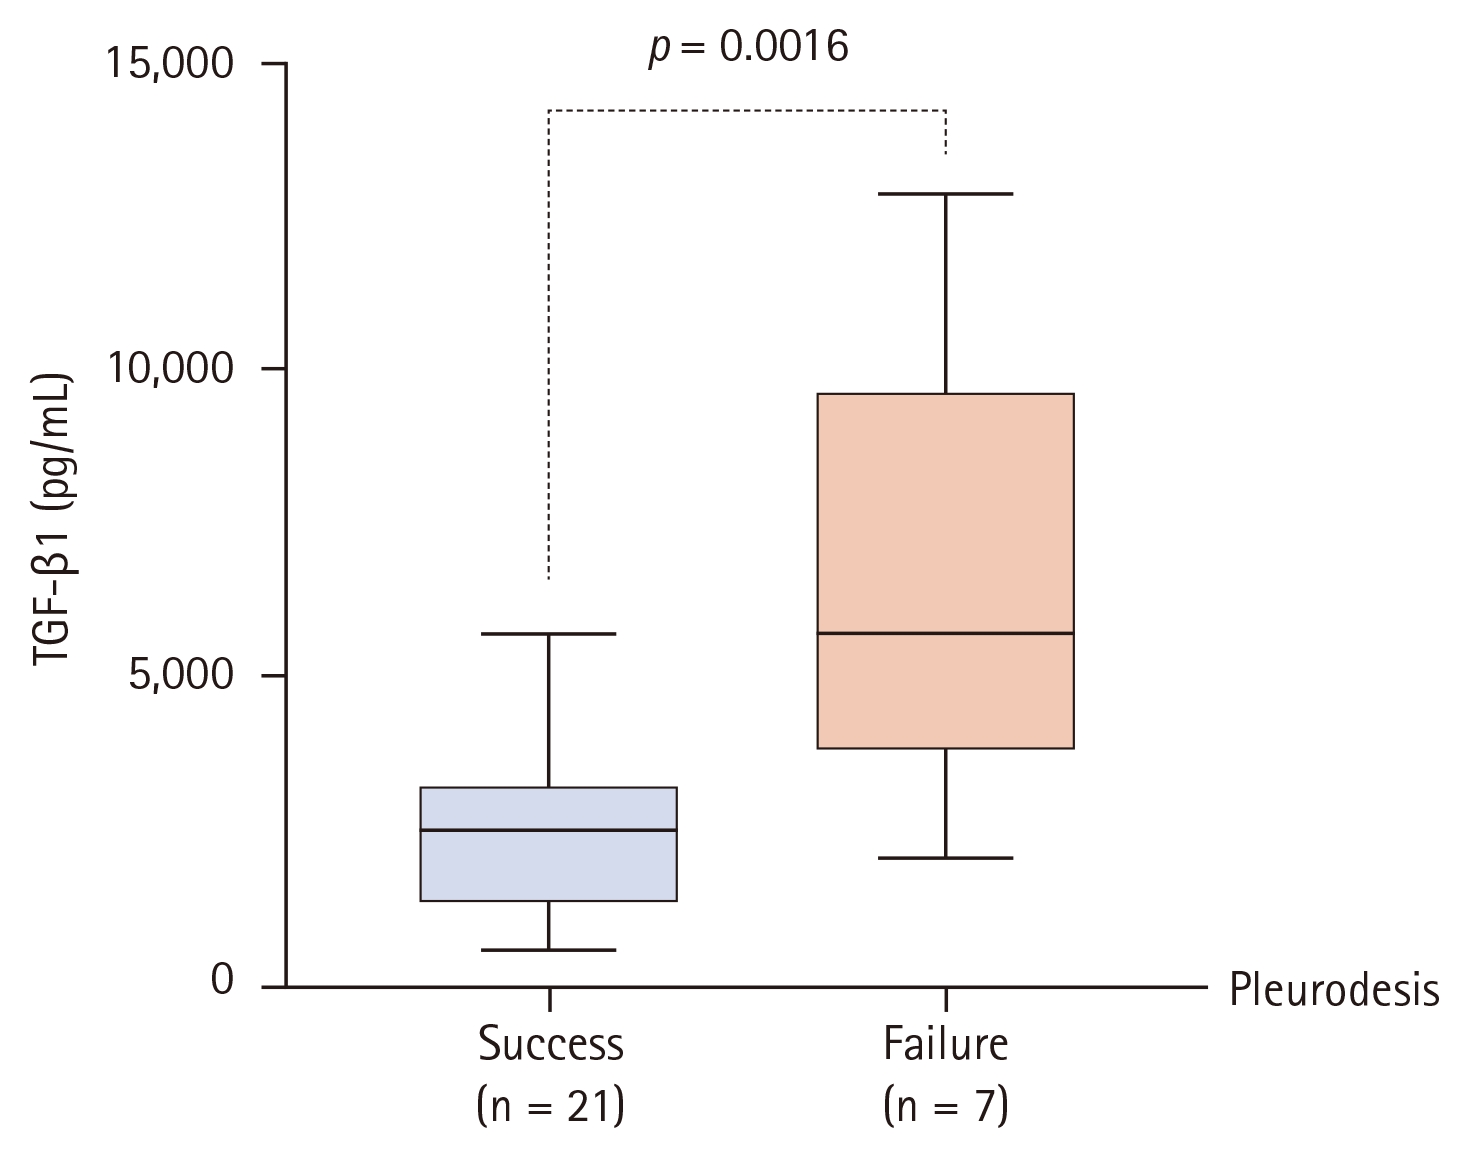
Comparison of pleural fluid TGF-β1 concentrations between patients with pleurodesis success and failure. Box plots represent the median, IQR, and range. TGF-β1 levels were significantly higher in the failure group (median values 5,779.83 pg/mL vs. 2,598.93 pg/mL; unadjusted p = 0.0016). This difference remained statistically significant after adjusting for multiple testing across the 28-cytokine panel using the Benjamini–Hochberg procedure (adjusted p = 0.044) and in a multivariable model adjusted for age and pleural LDH (p = 0.035). TGF-β1, transforming growth factor-β1; IQR, interquartile range; LDH, lactate dehydrogenase.
Given the limited number of outcome events, the multi-variable model was restricted to a small number of clinically relevant covariates to reduce the risk of overfitting. In multivariable logistic regression analysis adjusted for age and pleural fluid LDH, TGF-β1 remained an independent predictor of pleurodesis outcome, with higher levels associated with lower odds of pleurodesis success (odds ratio = 0.999 per 1 pg/mL increase; p = 0.035). Pleural elastance did not differ significantly between the pleurodesis success and failure groups (median [IQR]: 8.33 [4.72–10.00] cmH2O/L vs. 8.33 [7.14–11.00] cmH2O/L; p = 0.689).
ROC analysis demonstrated that pleural fluid TGF-β1 had good discriminative performance for predicting pleurodesis outcome, with an AUC of 0.884. Internal validation using bootstrap resampling (1,000 iterations) yielded a 95% confidence interval of 0.68–1.00 (Fig. 3). The wide confidence interval reflected the limited number of outcome events.
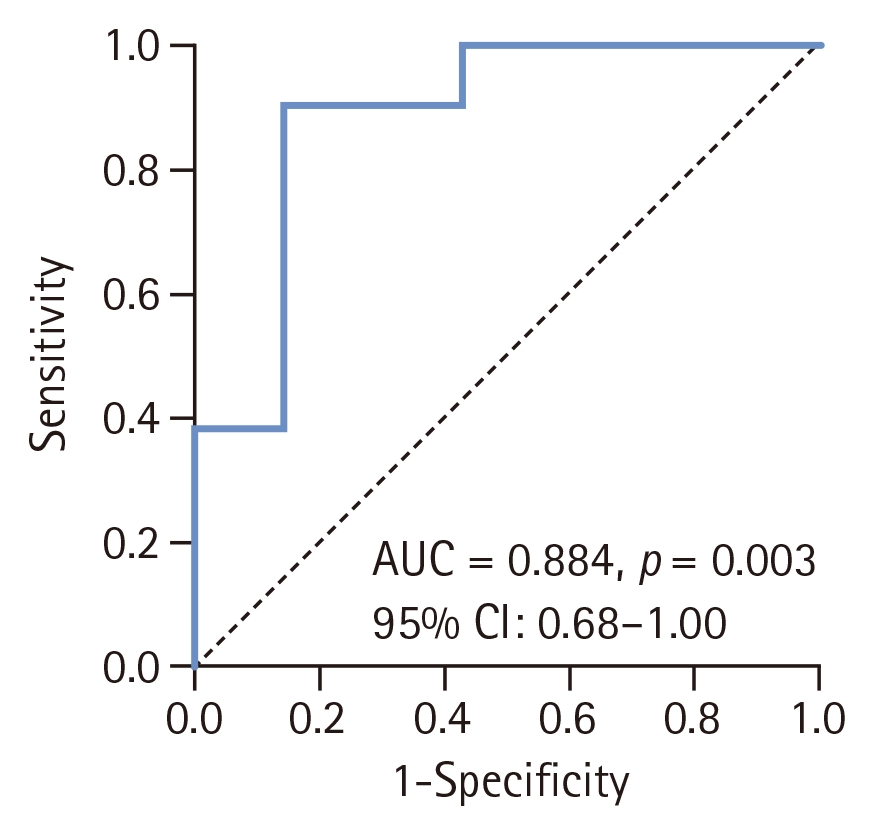
ROC curve of pleural fluid TGF-β1 levels for predicting pleurodesis outcome in the expandable lung group. ROC, receiver operating characteristic; TGF-β1, transforming growth factor-β1; AUC, area under the curve; CI, confidence interval.
A TGF-β1 threshold of < 3,743.04 pg/mL predicted pleurodesis success with a sensitivity of 90.5%, specificity of 85.7%, PPV of 95.0%, NPV of 75.0%, and an overall accuracy of 89.3%. No significant correlations were observed between pleural elastance and any cytokine concentration, including TGF-β1 (Spearman’s rs = 0.028, p = 0.818) (Fig. 4).
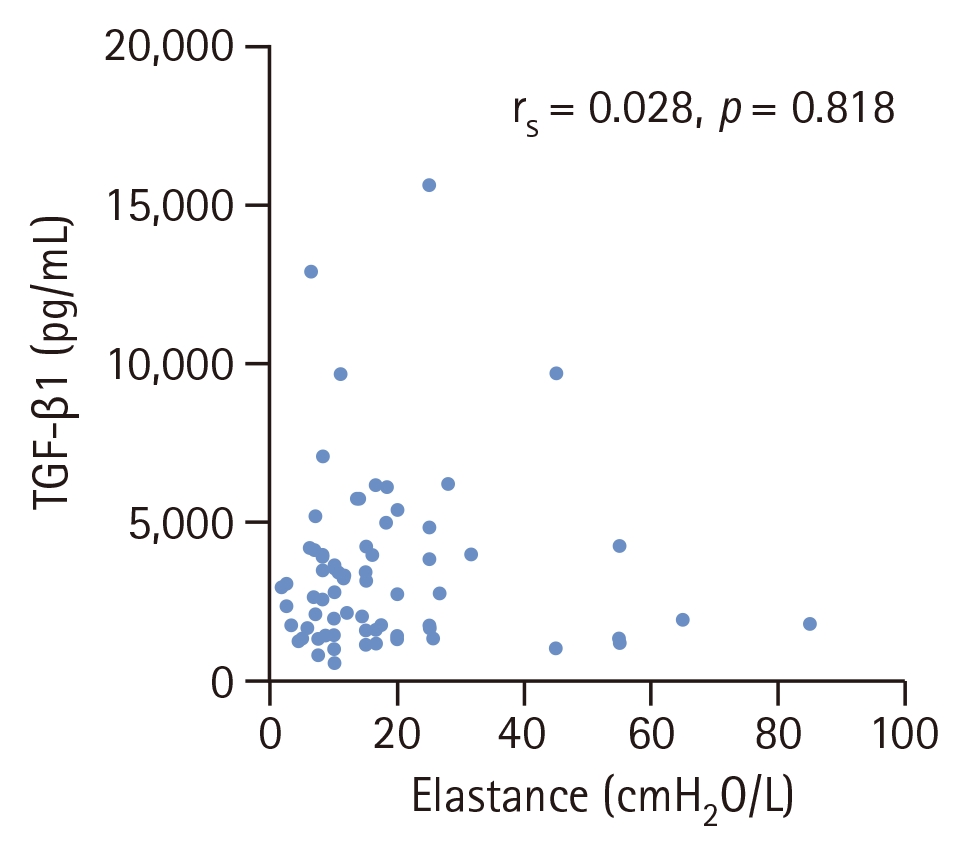
Correlation between pleural fluid TGF-β1 and pleural elastance. TGF-β1, transforming growth factor-β1.
DISCUSSION
This study investigated the role of pleural fluid cytokines, implicated in pleural fibrosis, in predicting lung expandability—assessed by pleural elastance and pleural apposition—and pleurodesis outcomes in MPE. We found that pleural fluid TGF-β1 and other cytokines did not differ significantly between expandable and non-expandable lungs. In contrast, higher TGF-β1 concentrations were significantly associated with pleurodesis failure among patients with expandable lungs, highlighting its potential role as a biomarker for pleurodesis outcome rather than lung expandability itself.
TGF-β1 is a well-established profibrotic mediator in various pulmonary conditions [9]; however, its lack of association with lung expandability in our study suggests that mechanical lung expansion and pleural fibrotic biology may represent distinct processes. The development of pleural fibrosis in MPE involves complex interactions among inflammatory cells, profibrotic mediators, and the coagulation–fibrinolytic system [5]. Measures of lung expandability such as pleural elastance and pleural apposition, although widely used, may therefore fail to capture the underlying biological activity of the pleura. In addition, lung expandability can be influenced by non-fibrotic mechanical factors, including metastatic visceral pleural involvement or endobronchial obstruction leading to lung collapse [10]. Together, these findings support a dual-pathway model of pleurodesis failure: a mechanical pathway driven by lung expandability, and a biological pathway characterized by profibrotic cytokine activity despite adequate lung expansion.
Pleural elastance and pleural apposition are widely accepted measures for evaluating lung expandability [11], yet discordance between these parameters is well recognized. Chopra et al. [12] reported discrepancies in 29% of patients, using > 90% pleural apposition to define lung re-expansion and a pleural elastance threshold of ≤ 14.5 cmH2O/L. In our study, a higher discordance rate of 62% was observed when applying broader clinical criteria (pleural elastance ≤ 14.5 cmH2O/L or pleural apposition ≥ 75%). This increased discordance likely reflects real-world procedural and measurement variability rather than a methodological flaw. Factors such as premature termination of fluid drainage due to patient discomfort, the presence of pleural adhesions, and technical challenges during pleural manometry may influence elastance measurements. Manual pressure recording is also susceptible to respiratory variation and interobserver variability, while two-dimensional chest radiography may underestimate residual non-apposition. Collectively, these findings highlight the limitations of relying on a single modality and suggest that the optimal integration of pleural elastance and radiographic assessment remains uncertain. This diagnostic uncertainty further supports the potential value of complementary biological markers to refine pleurodesis decision-making.
Despite meeting expandability criteria, pleurodesis failure still occurred in 25% of patients, consistent with previously reported failure rates of 17–20% [13]. This finding highlights the limitation of mechanical assessment alone in predicting pleurodesis outcome. In our study, pleural fluid TGF-β1 levels were significantly higher in patients with pleurodesis failure and demonstrated good discriminative performance for predicting pleurodesis outcome (AUC = 0.884). Biologically, TGF-β1 is a key profibrotic cytokine that promotes extracellular matrix deposition, suppresses matrix degradation, and recruits fibroblasts [9], processes that, when present at high baseline levels, may impair effective pleural symphysis. This interpretation is supported by studies in tuberculous pleurisy, in which elevated TGF-β1 levels were associated with increased pleural thickening [14], potentially limiting pleural apposition and reducing pleurodesis efficacy. Hsu et al. [15] similarly reported higher TGF-β levels in patients with pleurodesis failure, although the difference did not reach statistical significance. The discrepancy between their findings and ours may be explained by the lack of isoform-specific TGF-β measurement and the substantial variability in cytokine concentrations in their study.
Although multivariable analysis was performed, the limited number of outcome events restricted the number of covariates that could be included, and residual confounding cannot be excluded. Furthermore, TGF-β1 remained an independent predictor of pleurodesis failure after adjustment for age and LDH and after correction for multiple testing using the FDR approach. The absence of correlation between TGF-β1 and pleural elastance suggests that this cytokine reflects a biological barrier to successful pleural symphysis that is independent of the lung’s mechanical expandability.
Several pleural fluid biochemical parameters have been proposed as predictors of pleurodesis outcome. Pantazopoulos et al. [16] identified pleural fluid glucose < 65 mg/ dL as a predictor of pleurodesis failure, with a sensitivity of 90.7% and specificity of 76.8%, while Heffner et al. [17] reported pleural fluid pH < 7.25 as an indicator of poor outcome (sensitivity 46.2%, specificity 82.2%). However, these markers primarily reflect metabolic or inflammatory conditions within the pleural space rather than fibrotic activity. In contrast to these reports, our study did not demonstrate a significant association between pleural fluid glucose and pleurodesis success. This finding suggests that metabolic parameters have limited ability to capture the underlying pleural fibrotic milieu (i.e., profibrotic biological activity) that determines pleurodesis efficacy in patients with MPE.
Several limitations should be acknowledged. First, pleural manometry measurements are susceptible to premature termination of fluid drainage and respiratory variation, which can lead to underestimation of true lung expandability. Second, chest radiography provides only two-dimensional assessments and may not reliably detect residual pleural fluid, limiting its accuracy. Third, pleurodesis outcomes may be influenced by procedural variability, as both talc poudrage and talc slurry were included in this study. Fourth, pleural fluid TGF-β1 levels may not reflect pleural fibrotic activity at the time of pleurodesis because of variability in the interval between fluid sampling and the procedure. Fifth, the relatively small number of outcome events may have resulted in statistical instability and potential overestimation of diagnostic performance, including the observed AUC. Although internal validation using bootstrap resampling was performed, these findings should be interpreted cautiously and require external validation in larger cohorts. Finally, cytokine measurements reflect soluble mediators and may not directly correspond to tissue-level fibrotic signaling. Future studies incorporating pleural tissue analysis, such as gene expression profiling from pleural biopsies, may provide deeper insight into the molecular pathways driving pleural fibrosis and pleurodesis failure.
In conclusion, pleural fluid TGF-β1 levels did not differ between expandable and non-expandable lungs, suggesting limited utility for assessing lung expandability. However, higher TGF-β1 levels were associated with pleurodesis failure among patients with expandable lungs. These findings are exploratory and may overestimate diagnostic performance due to the limited number of events. External validation in larger cohorts is required before clinical application.
KEY MESSAGE
1. Pleural fluid cytokines, including TGF-β1, were not associated with lung expandability, as assessed by pleural elastance and post-thoracentesis radiographic findings.
2. Elevated pleural fluid TGF-β1 was significantly associated with pleurodesis failure, even among patients with expandable lungs, and demonstrated promising discriminative performance.
3. Biological factors may complement mechanical assessment in predicting pleurodesis outcomes. Pleural fluid TGF-β1 may serve as a potential biomarker to improve patient selection for pleurodesis; however, further validation in larger prospective studies is required.
Data availability
De-identified individual participant data underlying the results reported in this article, including cytokine measurement datasets and corresponding clinical variables, will be made available upon reasonable request. The data dictionary and study protocol will also be accessible to qualified researchers. Data will become available after publication of this manuscript and will remain accessible for five years thereafter. Access will be granted to investigators whose proposed use of the data is methodologically sound and aligns with the aims of the original study. Requests for data sharing should be directed to the corresponding author at the Faculty of Medicine, Chulalongkorn University.
Notes
Acknowledgments
The authors wish to thank the pulmonary and critical care fellows, nurses, and staff of King Chulalongkorn Memorial Hospital for their assistance with procedures and sample collection, as well as all patients who generously participated in this study.
Artificial intelligence tools (ChatGPT, OpenAI, GPT-5) were used solely to assist with the language editing, organization, and refinement of the manuscript text. The authors are fully responsible for the accuracy and integrity of all scientific content, data interpretation, and conclusions presented. No AI tools were used to generate, analyze, or manipulate any original research data or results.
CRediT authorship contributions
Jarudul Phocharoen: conceptualization, methodology, resources, investigation, data curation, formal analysis, validation, software, writing - original draft, project administration, funding acquisition; Pimpayao Sodsai: resources, investigation, validation, visualization; Virissorn Wongsrichanalai: conceptualization, methodology, resources, writing - review & editing, visualization; Vorawut Thanthitaweewat: resources, writing - review & editing, visualization; Thitiwat Sriprasart: resources, writing - review & editing, visualization; Nophol Leelayuwatanakul: conceptualization, methodology, resources, investigation, data curation, formal analysis, validation, writing - original draft, writing - review & editing, visualization, supervision, project administration, funding acquisition
Conflicts of interest
The authors disclose no conflicts.
Funding
This research was financially supported by the Ratchadapiseksomphot Endowment Fund, Faculty of Medicine, Chulalongkorn University (Grant No. RA68/016).