Predicting renal function using fundus photography: role of confounders
Article information

Abstract
Background/Aims
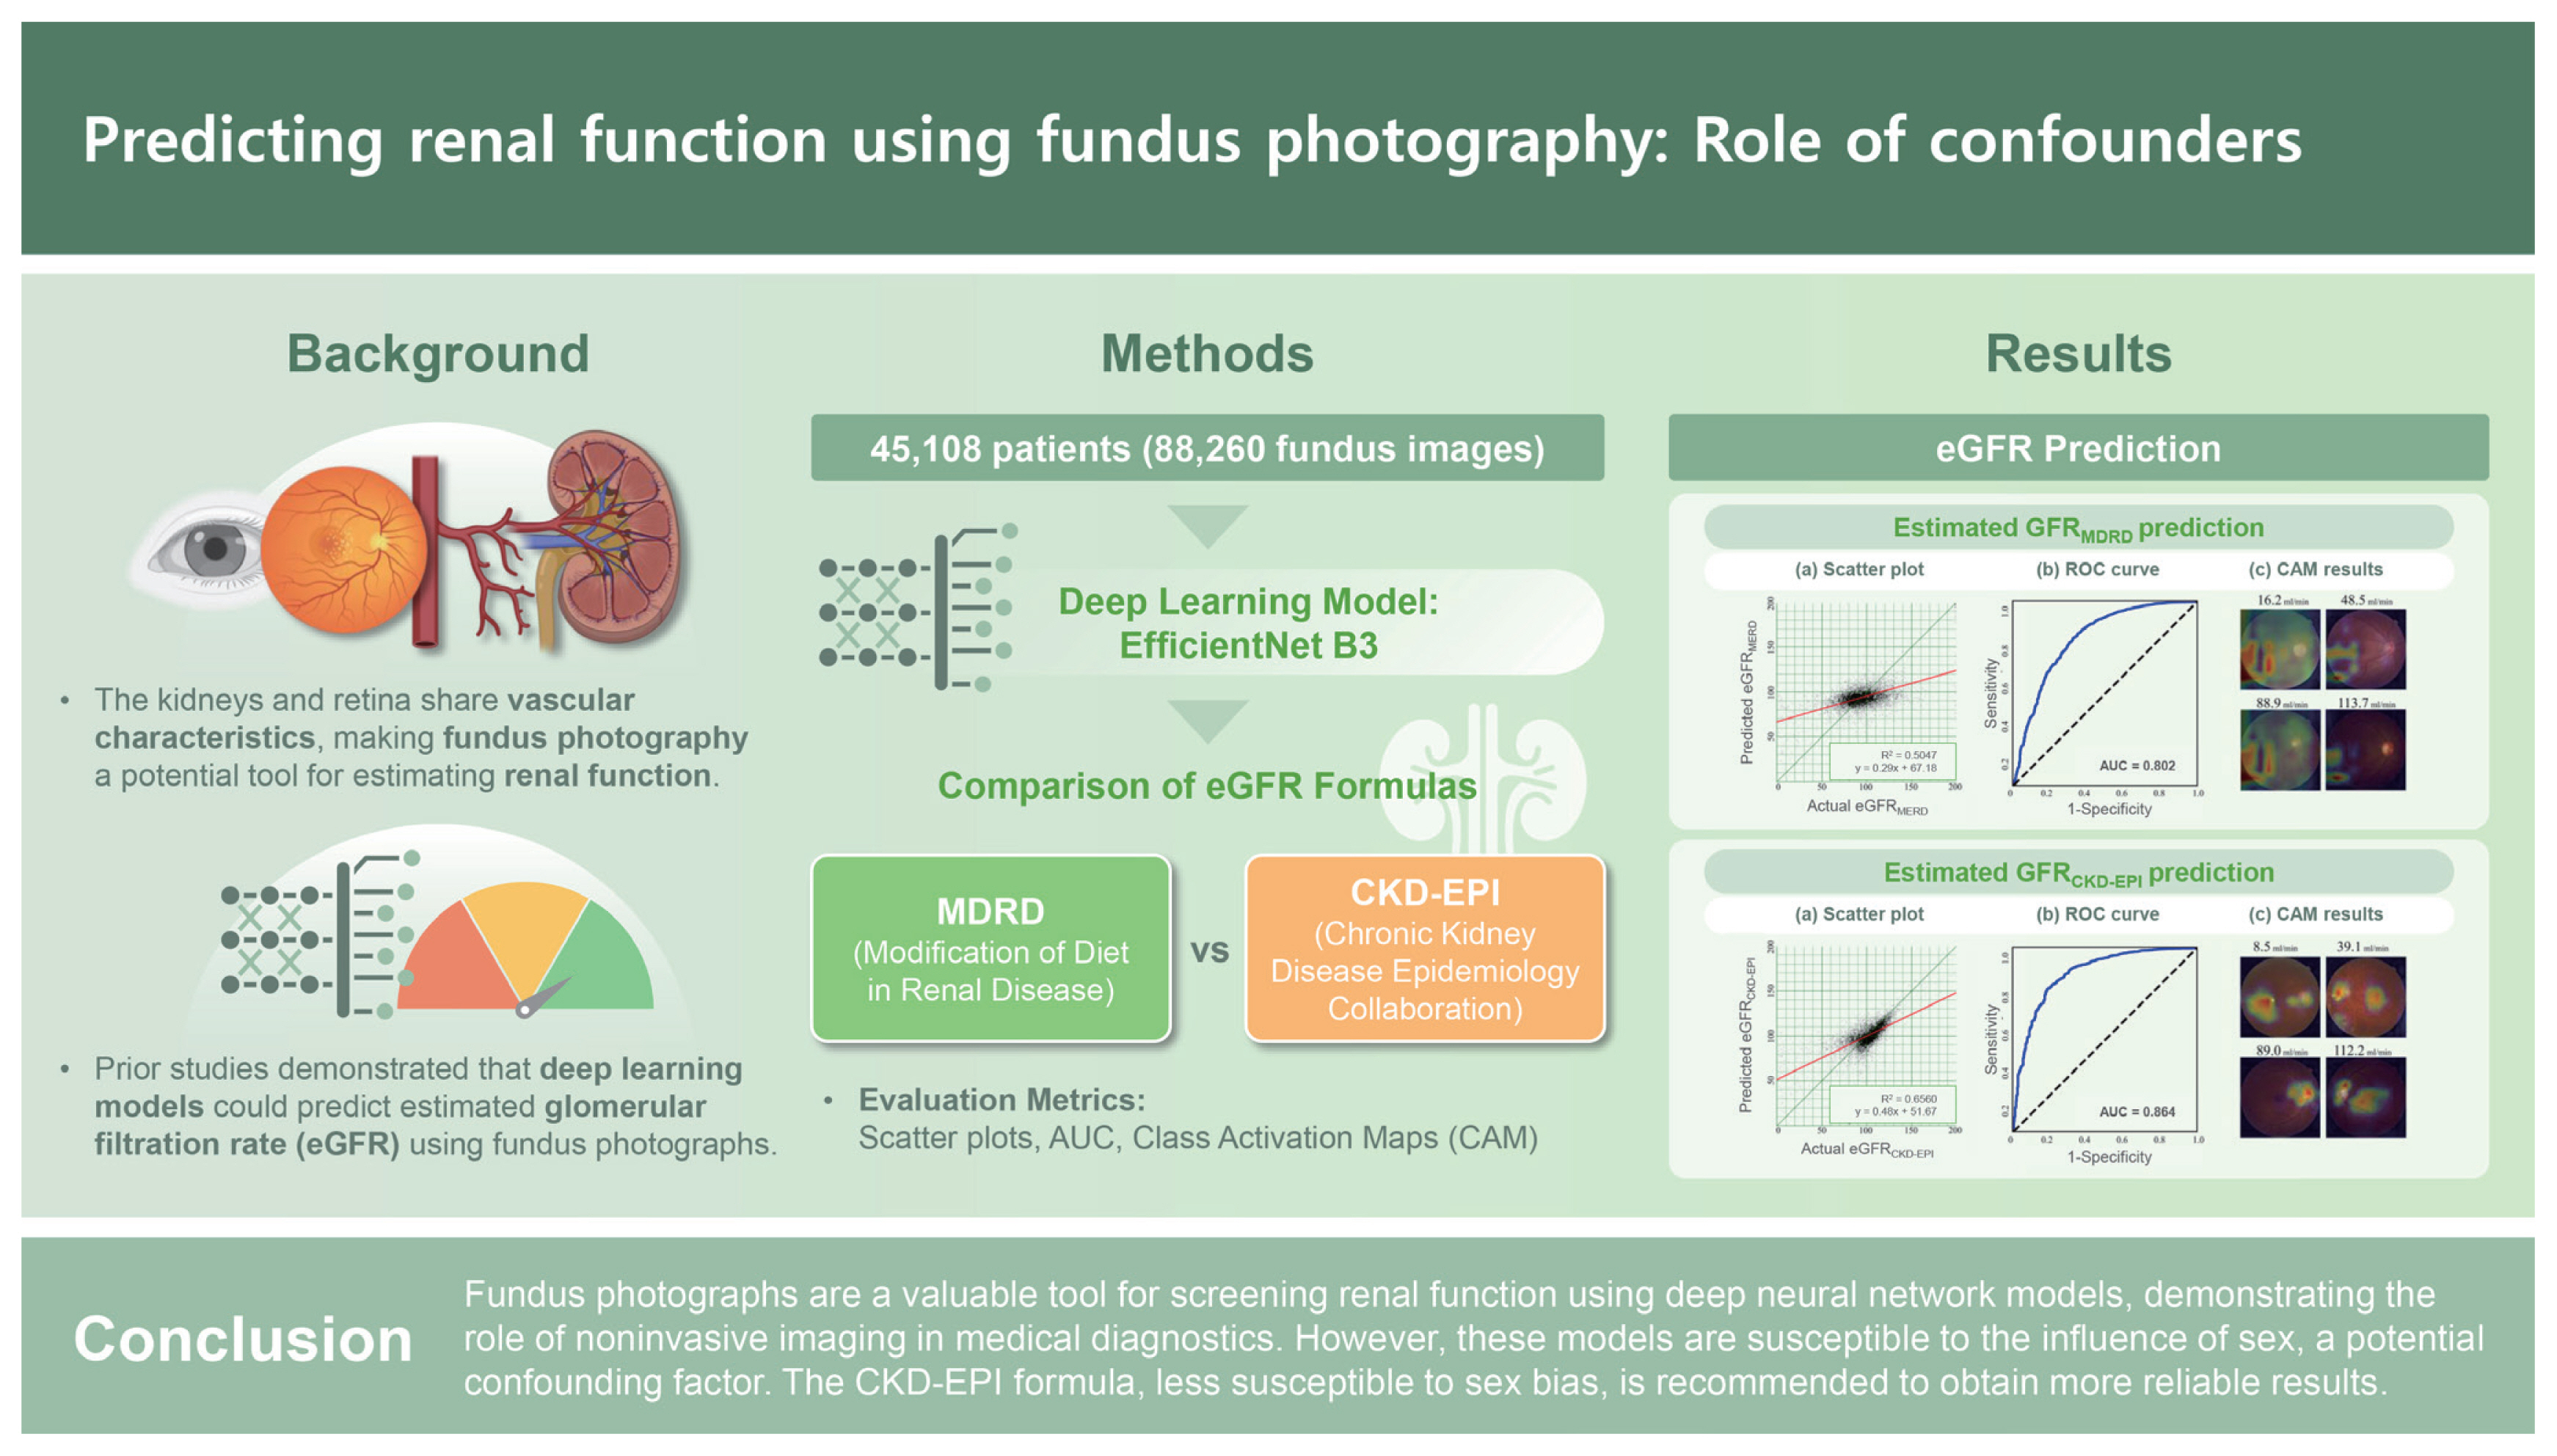
The kidneys and retina are highly vascularized organs that frequently exhibit shared pathologies, with nephropathy often associated with retinopathy. Previous studies have successfully predicted estimated glomerular filtration rates (eGFRs) using fundus photographs. We evaluated the performance of the Modification of Diet in Renal Disease (MDRD) and Chronic Kidney Disease Epidemiology Collaboration (CKD-EPI) formulas in eGFR prediction.
Methods
We enrolled patients with fundus photographs and corresponding creatinine measurements taken on the same date. One photograph per eye was randomly selected, resulting in a final dataset of 45,108 patients (88,260 photographs). Data including sex, age, and blood creatinine levels were collected for eGFR calculation using the MDRD and CKD-EPI formulas. EfficientNet B3 models were used to predict each parameter.
Results
Deep neural network models accurately predicted age and sex using fundus photographs. Sex was identified as a confounding variable in creatinine prediction. The MDRD formula was more susceptible to this confounding effect than the CKD-EPI formula. Notably, the CKD-EPI formula demonstrated superior performance compared to the MDRD formula (area under the curve 0.864 vs. 0.802).
Conclusions
Fundus photographs are a valuable tool for screening renal function using deep neural network models, demonstrating the role of noninvasive imaging in medical diagnostics. However, these models are susceptible to the influence of sex, a potential confounding factor. The CKD-EPI formula, less susceptible to sex bias, is recommended to obtain more reliable results.
INTRODUCTION
Chronic kidney disease (CKD) represents a significant global health challenge [1]. The 2016 United States Renal Data System annual report underscores the rising incidence of treated end-stage renal disease, with an annual increase of 2–4% in nearly one-third of countries between 2003 and 2016 [2]. Similarly, South Korea experienced a 2.7-fold increase in CKD patients between 2006 and 2015 [3]. Considering the pivotal role of kidneys in waste filtration, fluid and electrolyte balance, and blood pressure regulation, regular screening of renal function is essential, particularly in the general population and high-risk groups including those with diabetes mellitus and hypertension [4,5].
Glomerular filtration rate (GFR), a key indicator of renal function, measures the ability of the kidneys to filter waste products from the blood. It is an essential measure for assessing kidney health, staging CKD, predicting patient outcomes, and guiding medication dosages in acute or chronic renal failure [6]. As direct GFR measurement is challenging, estimated GFR (eGFR) offers a practical alternative, evaluating the efficiency of kidney filtration using endogenous (originating within the body) or exogenous (introduced externally) markers. The most common clinical formulas for calculating eGFR are the Modification of Diet in Renal Disease (MDRD) and Chronic Kidney Disease Epidemiology Collaboration (CKD-EPI) formulas [6], which incorporate factors such as serum levels of creatinine, age, sex, and race.
The dense vascular network in kidneys is essential for filtration within the glomeruli. Notably, the kidneys and eyes share structural, developmental, and functional parallels, including their role in the renin-angiotensin-aldosterone system. Moreover, both organs are vulnerable to inflammation, oxidative stress, endothelial dysfunction, and microangiopathy [7]. Renal microvascular pathology significantly contributes to the development of renal insufficiency. The unique accessibility of the retina for direct, noninvasive visualization of its microvasculature makes the use of fundus photographs a promising approach for screening kidney diseases [8,9].
Deep neural networks (DNNs) applied to imaging data have demonstrated superior diagnostic performance, surpassing traditional image interpretation under various conditions. Previous studies have demonstrated the ability of DNNs to predict systemic conditions including age [10–13] and hemoglobin levels, and ocular conditions such as visual acuity [14] and intraocular pressure [15] using fundus photographs. Notably, DNNs have successfully identified diseases such as CKD, including details such as blood levels of creatinine and CKD classification, through retinal images [16–19].
Considering the lack of research directly comparing the MDRD and CKD-EPI formulas, we conducted a detailed comparison to assess their influence on DNN performance. This approach establishes the potential of fundus photographs as an effective screening tool for CKD.
METHODS
Study design
This retrospective study was approved by the Institutional Review Board of Chungnam National University Sejong Hospital (approval no. CNUSH 2023-07-017) and followed all relevant principles of the Declaration of Helsinki. The need for informed consent was waived by the Board given the retrospective nature of the work.
Fundus photography
Fundus photographs obtained at Chungnam National University Hospital and Chungnam National University Sejong Hospital were analyzed. Multiple examiners captured fundus photographs in outpatient clinics and health care centers using various fundus camera models. These photographs were retrieved from the PACS system. Patients with fundus photographs taken on the same date as corresponding creatinine measurements were included. Patients were excluded if creatinine, age, or sex data were unavailable or if photographs lacked simultaneous visibility of both the optic disc and macula due to media opacity or misalignment. For eyes with multiple photographs, only the most recent image was used. Photographs were trimmed for peripheral data removal, resized to 300 × 300 pixels, and normalized by dividing by 255.0 to ensure that values ranged between 0 and 1.
eGFR
The MDRD formula includes serum concentrations of creatinine, age, and sex. Although it is influenced by race (specifically African American), our study population consisted solely of the Asian population. Therefore, we did not apply the race coefficient in our calculations. Similarly, the CKD-EPI formula includes four variables, including serum concentrations of creatinine, age, sex, and race [20]. We defined CKD as an eGFR < 60 mL/min/1.73 m2 in accordance with the KDIGO CKD guidelines [21].
Reconstruction methods: Expectations
We used expectation methods to reconstruct the original numeric variable from the output of a DNN. The probabilities (probabilityi) of each class were multiplied by their corresponding expected values. Then these products were summed to calculate the final reconstructed value [11]:
The expectation method enables the generation of continuous reconstructed values, thereby enhancing the quality of scatter plots and correlation coefficients.
DNN algorithm development: EfficientNet B3
We used the EfficientNet B3 DNN model [22]. Trainable model variables were initialized using a Gaussian distribution. Key hyperparameters included a batch size of 100, 100 epochs, and a learning rate of 0.002. The model was optimized using the Adam optimizer; BCEWithLogitsLoss was used as the loss function. Prior to reconstruction, model outputs were processed using the Softmax function. Performance on the test dataset was evaluated at the conclusion of each epoch. Random rotation was used for data augmentation.
Statistical analysis
Our analysis included key parameters necessary for calculating eGFR, such as creatinine levels, age, and sex. We assessed the statistical significance of the categorical variable (sex) in the test set using a confusion matrix and the area under the curve (AUC). For the numerical variables, such as creatinine levels, age, and eGFR, we generated scatter plots, calculated correlation coefficients (R2), and conducted linear regression analysis.
We performed qualitative variable evaluations using the class activation map (CAM) method [23]. CAM visualized the decision-making processes, with heatmaps emphasizing regions critical to convolutional neural network (CNN) classification; redder hues indicated higher importance, playing a pivotal role in the CNN class discrimination process. We used CAM to identify areas of significance in the final convolutional and classification layers of the network, validating model appropriateness and determining key regions of the fundus photograph for output generation.
Statistical analyses were performed using Python software version 3.10.9, PyTorch 2.0.0, NumPy 1.23.5, and OpenCV-Python 4.7.0.72. The performance of the CNN model was evaluated using the accuracy of the test set. The Intel® Core™ i9-10980XE CPU and an NVIDIA® GeForce RTX 6000 Ada graphics card were used to train the CNN model.
RESULTS
Baseline characteristics
Fundus photographs were obtained from Chungnam National University Hospital and Chungnam National University Sejong Hospital between October 2011 and October 2023. In total, 124,657 patients were examined, yielding 2,549,874 fundus photographs. Photographs with unidentifiable macular and optic discs were excluded, leaving data from 116,854 patients (963,417 photographs) for the final analysis (Fig. 1). Of these, 45,108 patients (152,847 photographs) had corresponding same-day creatinine test results. We randomly selected 1 photograph per eye, resulting in a final dataset of 45,108 patients (88,260 photographs). Of these photographs, 80,228 (90.9%) were used as the training set and 8,032 (9.1%) were used as the test set.
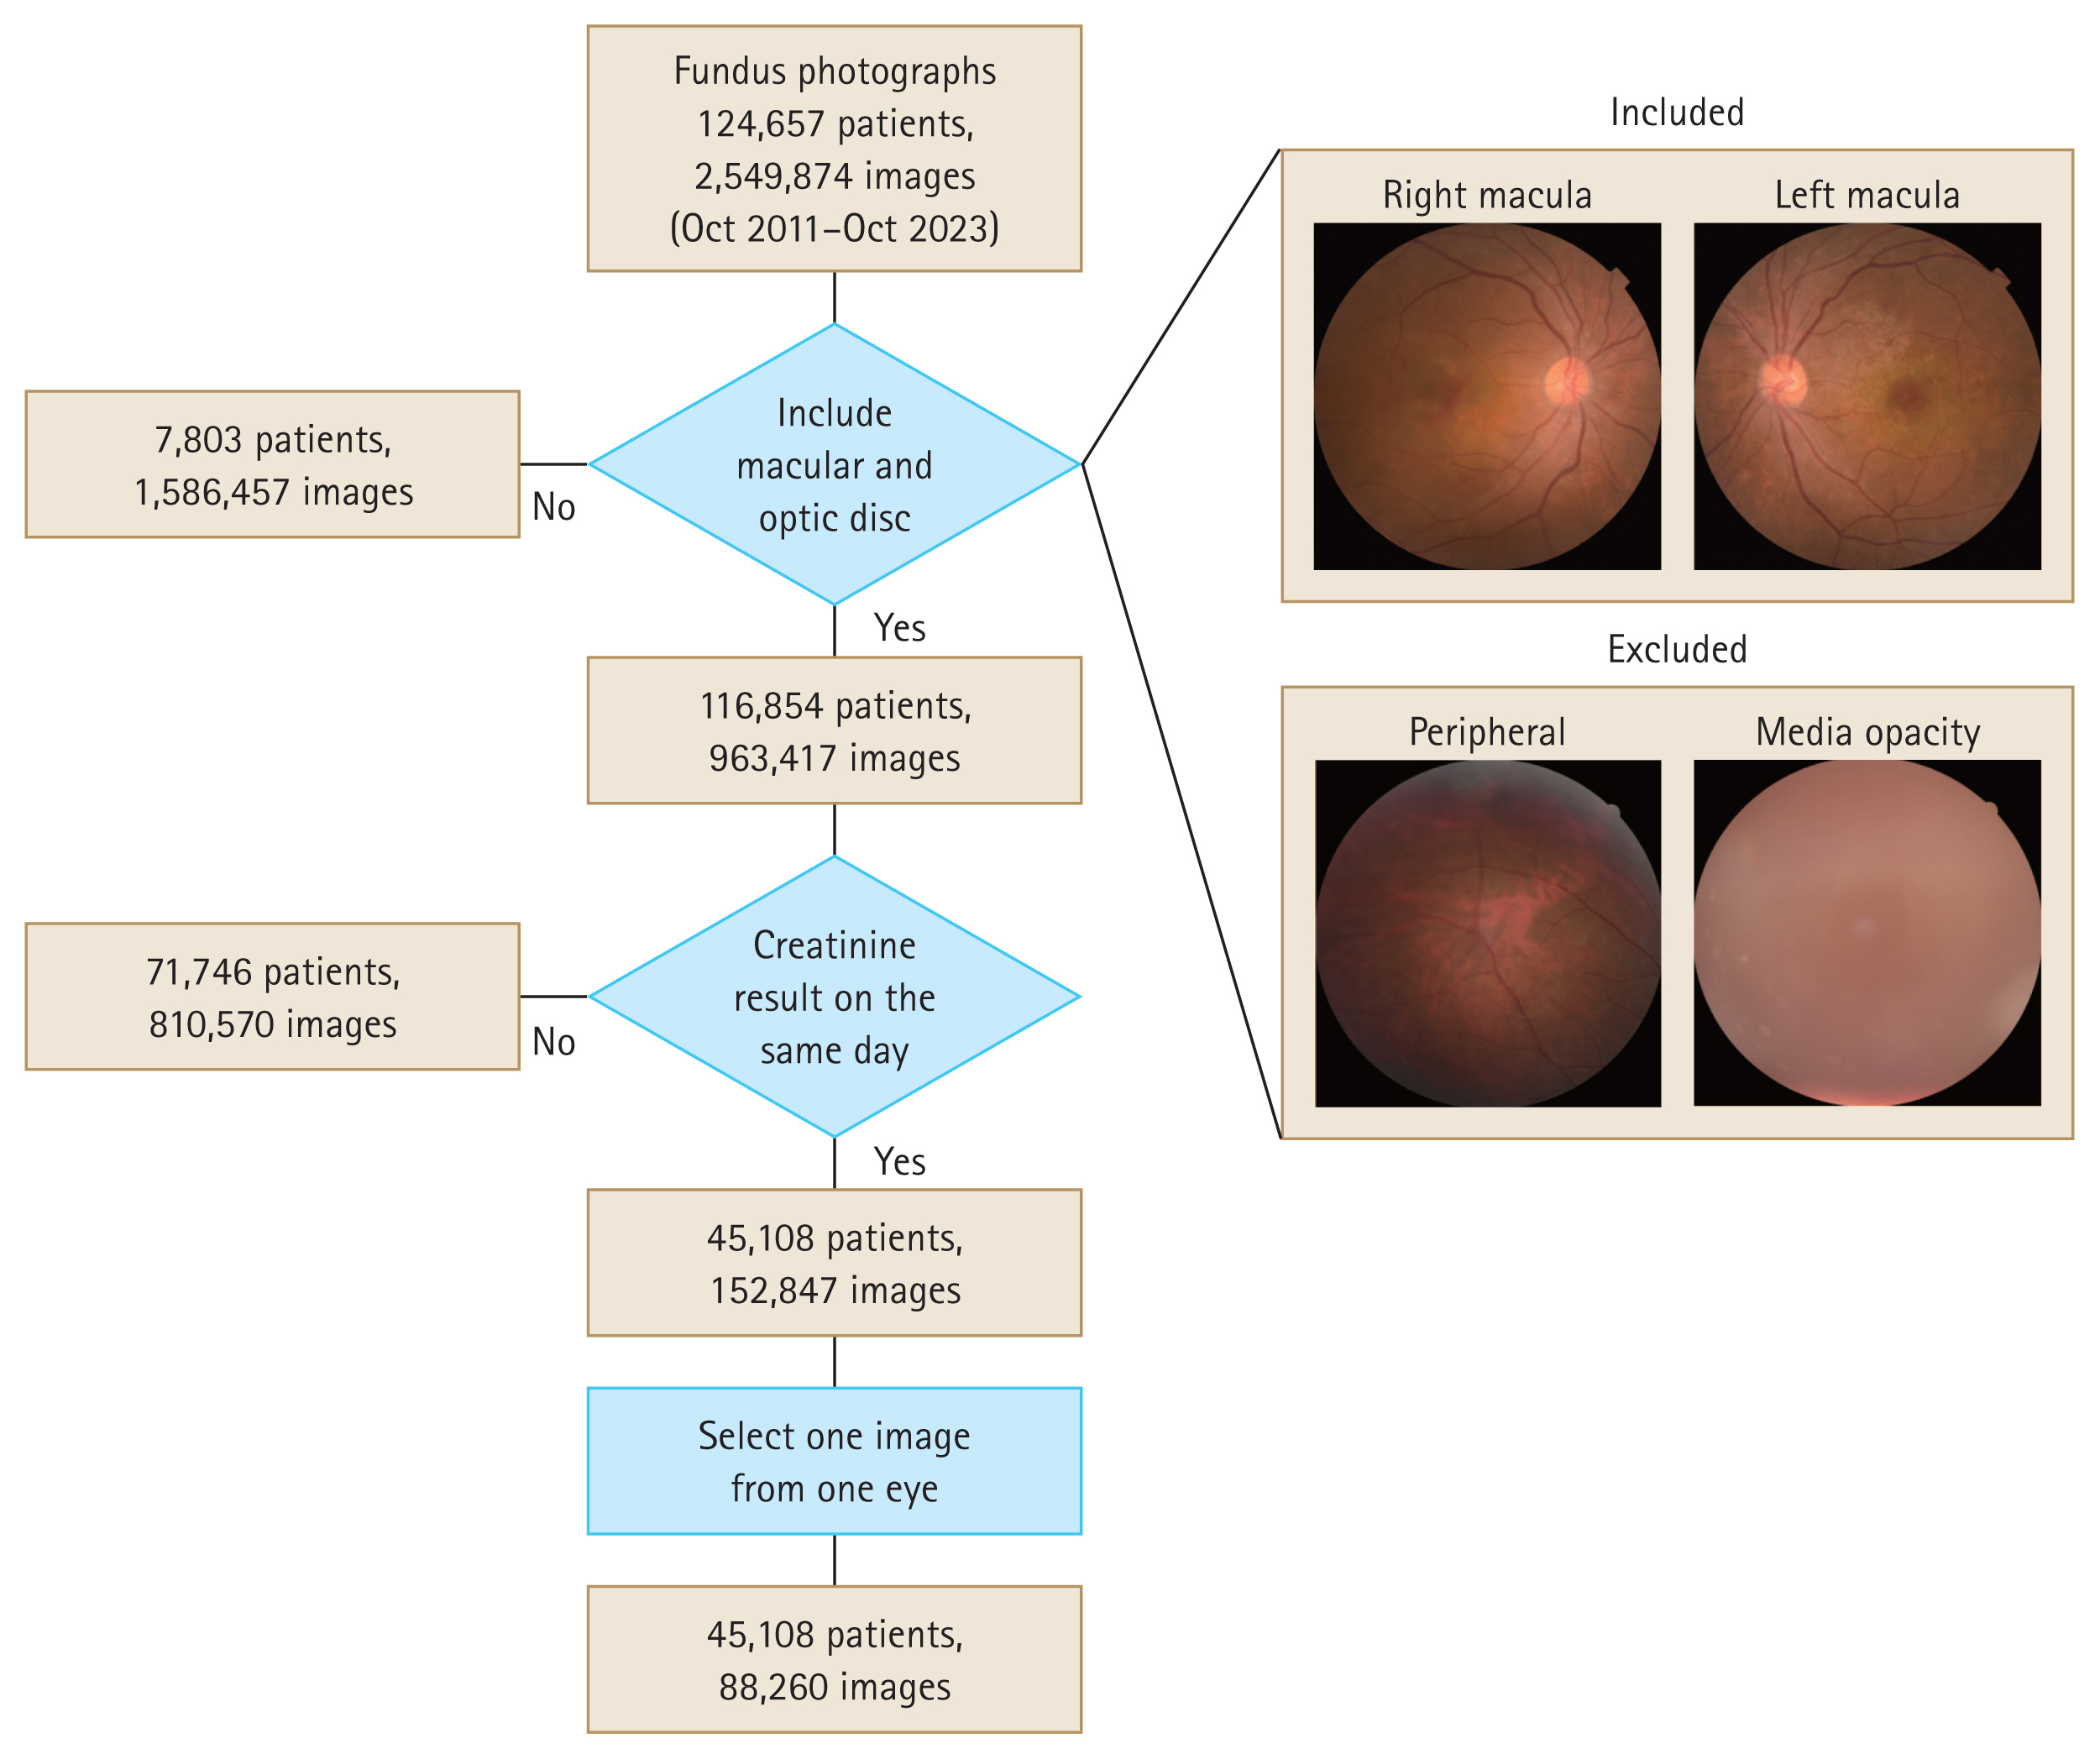
Study dataset selection flowchart. Fundus photographs with corresponding same-day creatinine tests are included, whereas those with obscured macula or optic disc are excluded. One photograph per eye is selected, yielding a final dataset of 45,108 patients (88,260 photographs).
The dataset included 88,260 photographs. The mean age of the patients was 52.1 years, with 46,559 and 41,701 from male and female patients, respectively. The mean creatinine level was 0.868 ± 0.783 mg/dL. The eGFR calculated using the MDRD (eGFRMDRD) was 96.4 ± 35.5 mL/min/ 1.73 m2, with 5,036 photographs (5.71%) classified as CKD. The eGFR calculated using the CKD-EPI (eGFRCKD-EPI) was 99.8 ± 20.7 mL/min/1.73 m2, with 3,946 photographs (4.47%) classified as CKD. No statistically significant differences were observed between the training and test sets (Table 1).
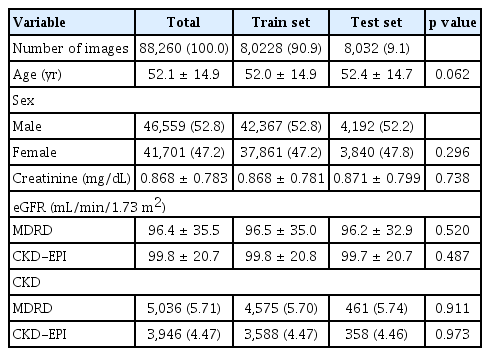
Baseline characteristics of the study participants
The differences between eGFRMDRD and eGFRCKD-EPI were analyzed using histograms and scatter plots (Fig. 2). eGFRM-DRD exhibited a lower kurtosis and a more dispersed distribution compared to eGFRCKD-EPI. The proportion of CKD cases was higher in the eGFRMDRD group than in the eGFRCKD-EPI group (5.71% vs. 4.47%). Furthermore, eGFRMDRD exhibited a more pronounced distribution difference based on sex. Conversely, the distribution patterns between males and females were nearly identical in the eGFRCKD-EPI group. In the scatter plot, the two methods were well-aligned for eGFR < 60 mL/min/1.73 m2; however, for the eGFR > 60 mL/min/ 1.73 m2, eGFRMDRD tended to overestimate compared to eGFRCKD-EPI.
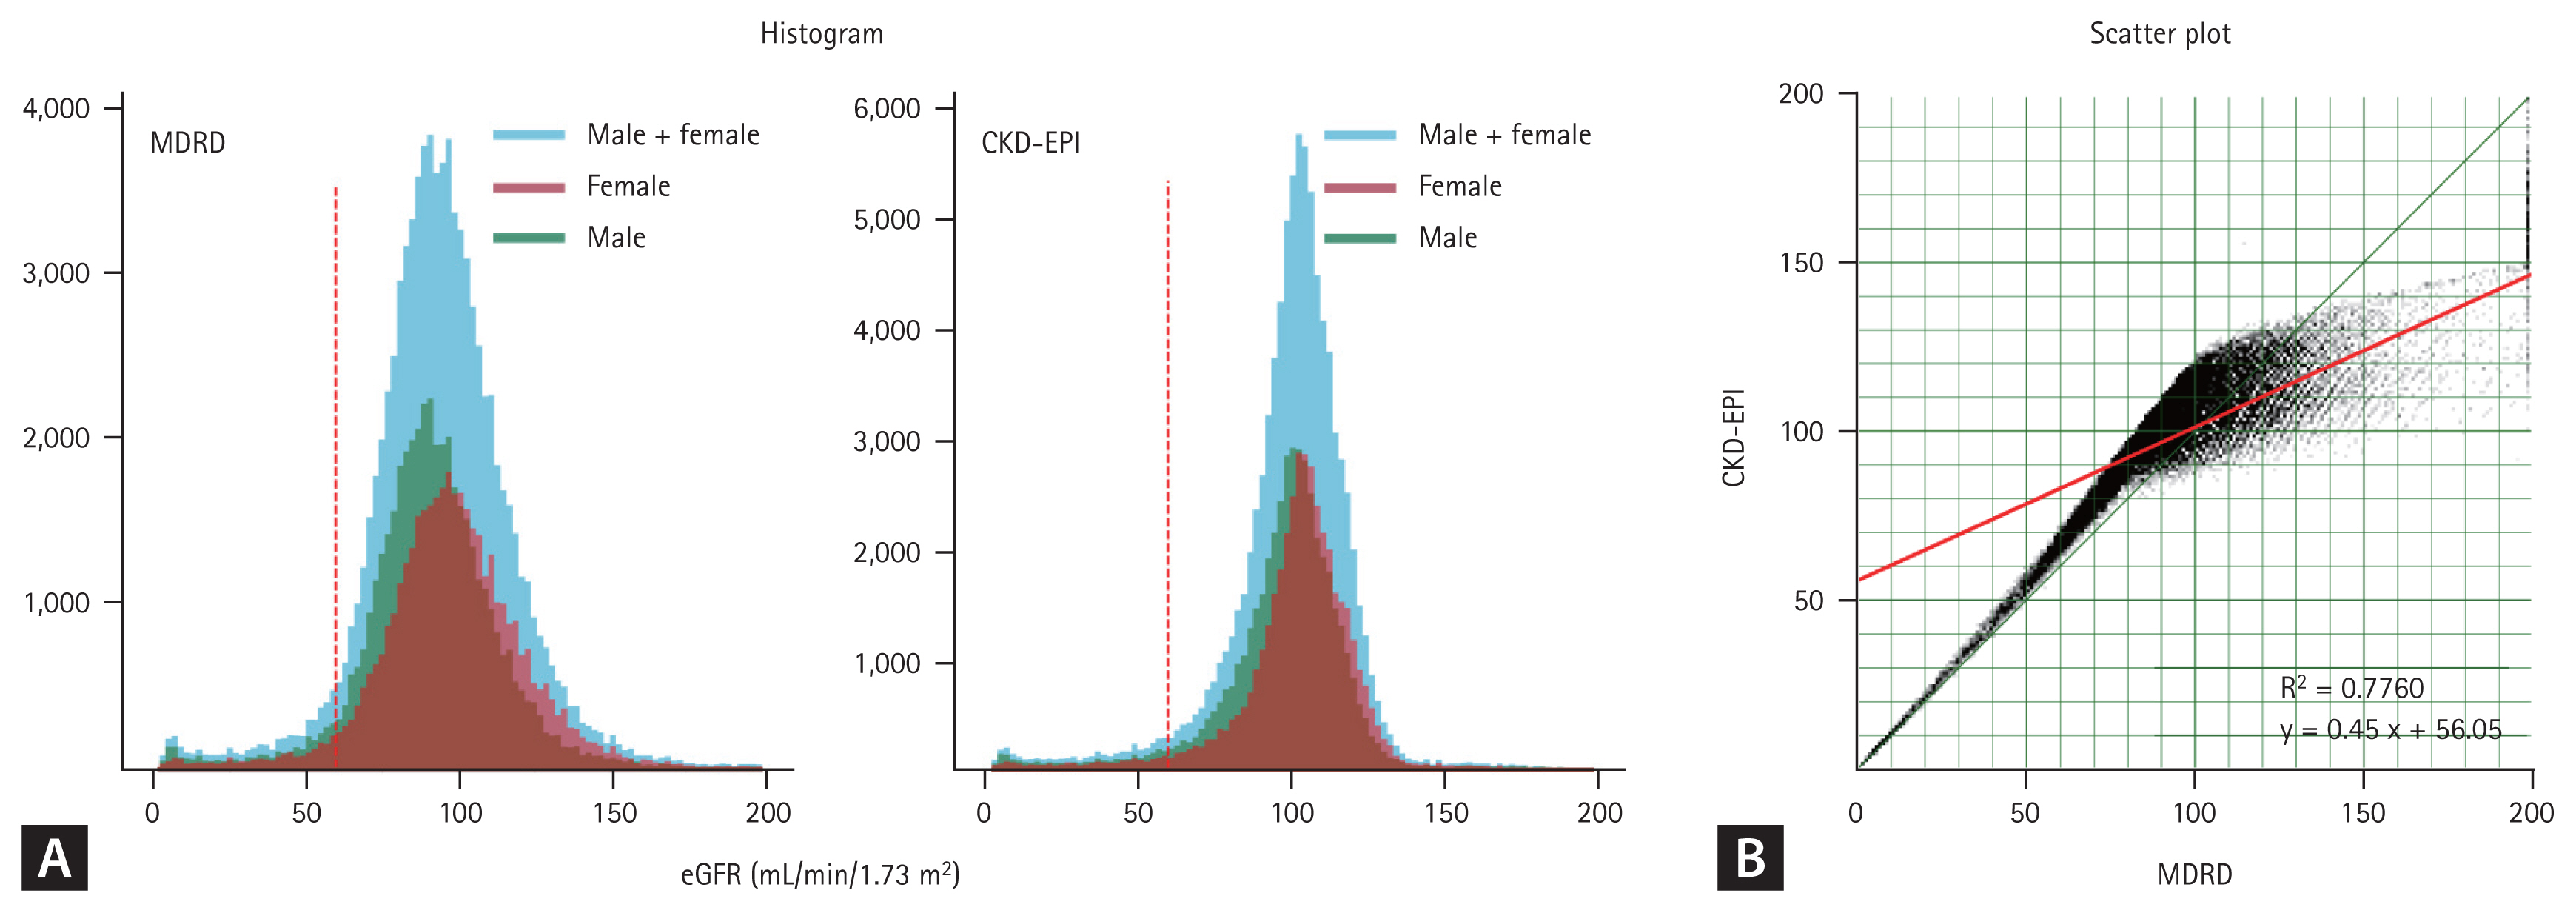
Comparison of the Modification of Diet in Renal Disease (MDRD) and the Chronic Kidney Disease Epidemiology Collaboration (CKD-EPI) formulas in estimated glomerular filtration rate (eGFR) prediction. (A) The eGFR calculated using the MDRD formula (eGFRMDRD) exhibits a lower kurtosis and a more dispersed distribution compared to the eGFR calculated using the MDRD formula (eGFRCKD-EPI). Although eGFRCKD-EPI exhibits nearly identical distributions for both sexes, the eGFRMDRD reveals a discriminatory distribution based on sex. (B) In the scatter plot, the two methods are well-aligned for eGFR < 60 mL/min/1.73 m2; however, for the eGFR > 60 mL/min/1.73 m2, eGFRMDRD tends to overestimate compared to eGFRCKD-EPI.
Age and sex prediction models based on fundus photographs
The age and sex prediction models using fundus photographs demonstrated high accuracy (Fig. 3). For age prediction, the scatter plot revealed a strong linear distribution with the regression line slope closely approaching 1, indicating a near-perfect correlation (R2 = 0.9242, Fig. 3B). Correlation analysis and linear regression for age prediction yielded statistically significant results (p < 0.001). The CAM emphasized the optic disc as the most important feature for age prediction. The model for sex prediction model exhibited excellent performance with an 85.8% prediction accuracy in the test set (Fig. 3D). The AUC of 0.938 demonstrates statistical significance. CAM analysis revealed that the optic disc and macular regions were crucial in predicting sex.
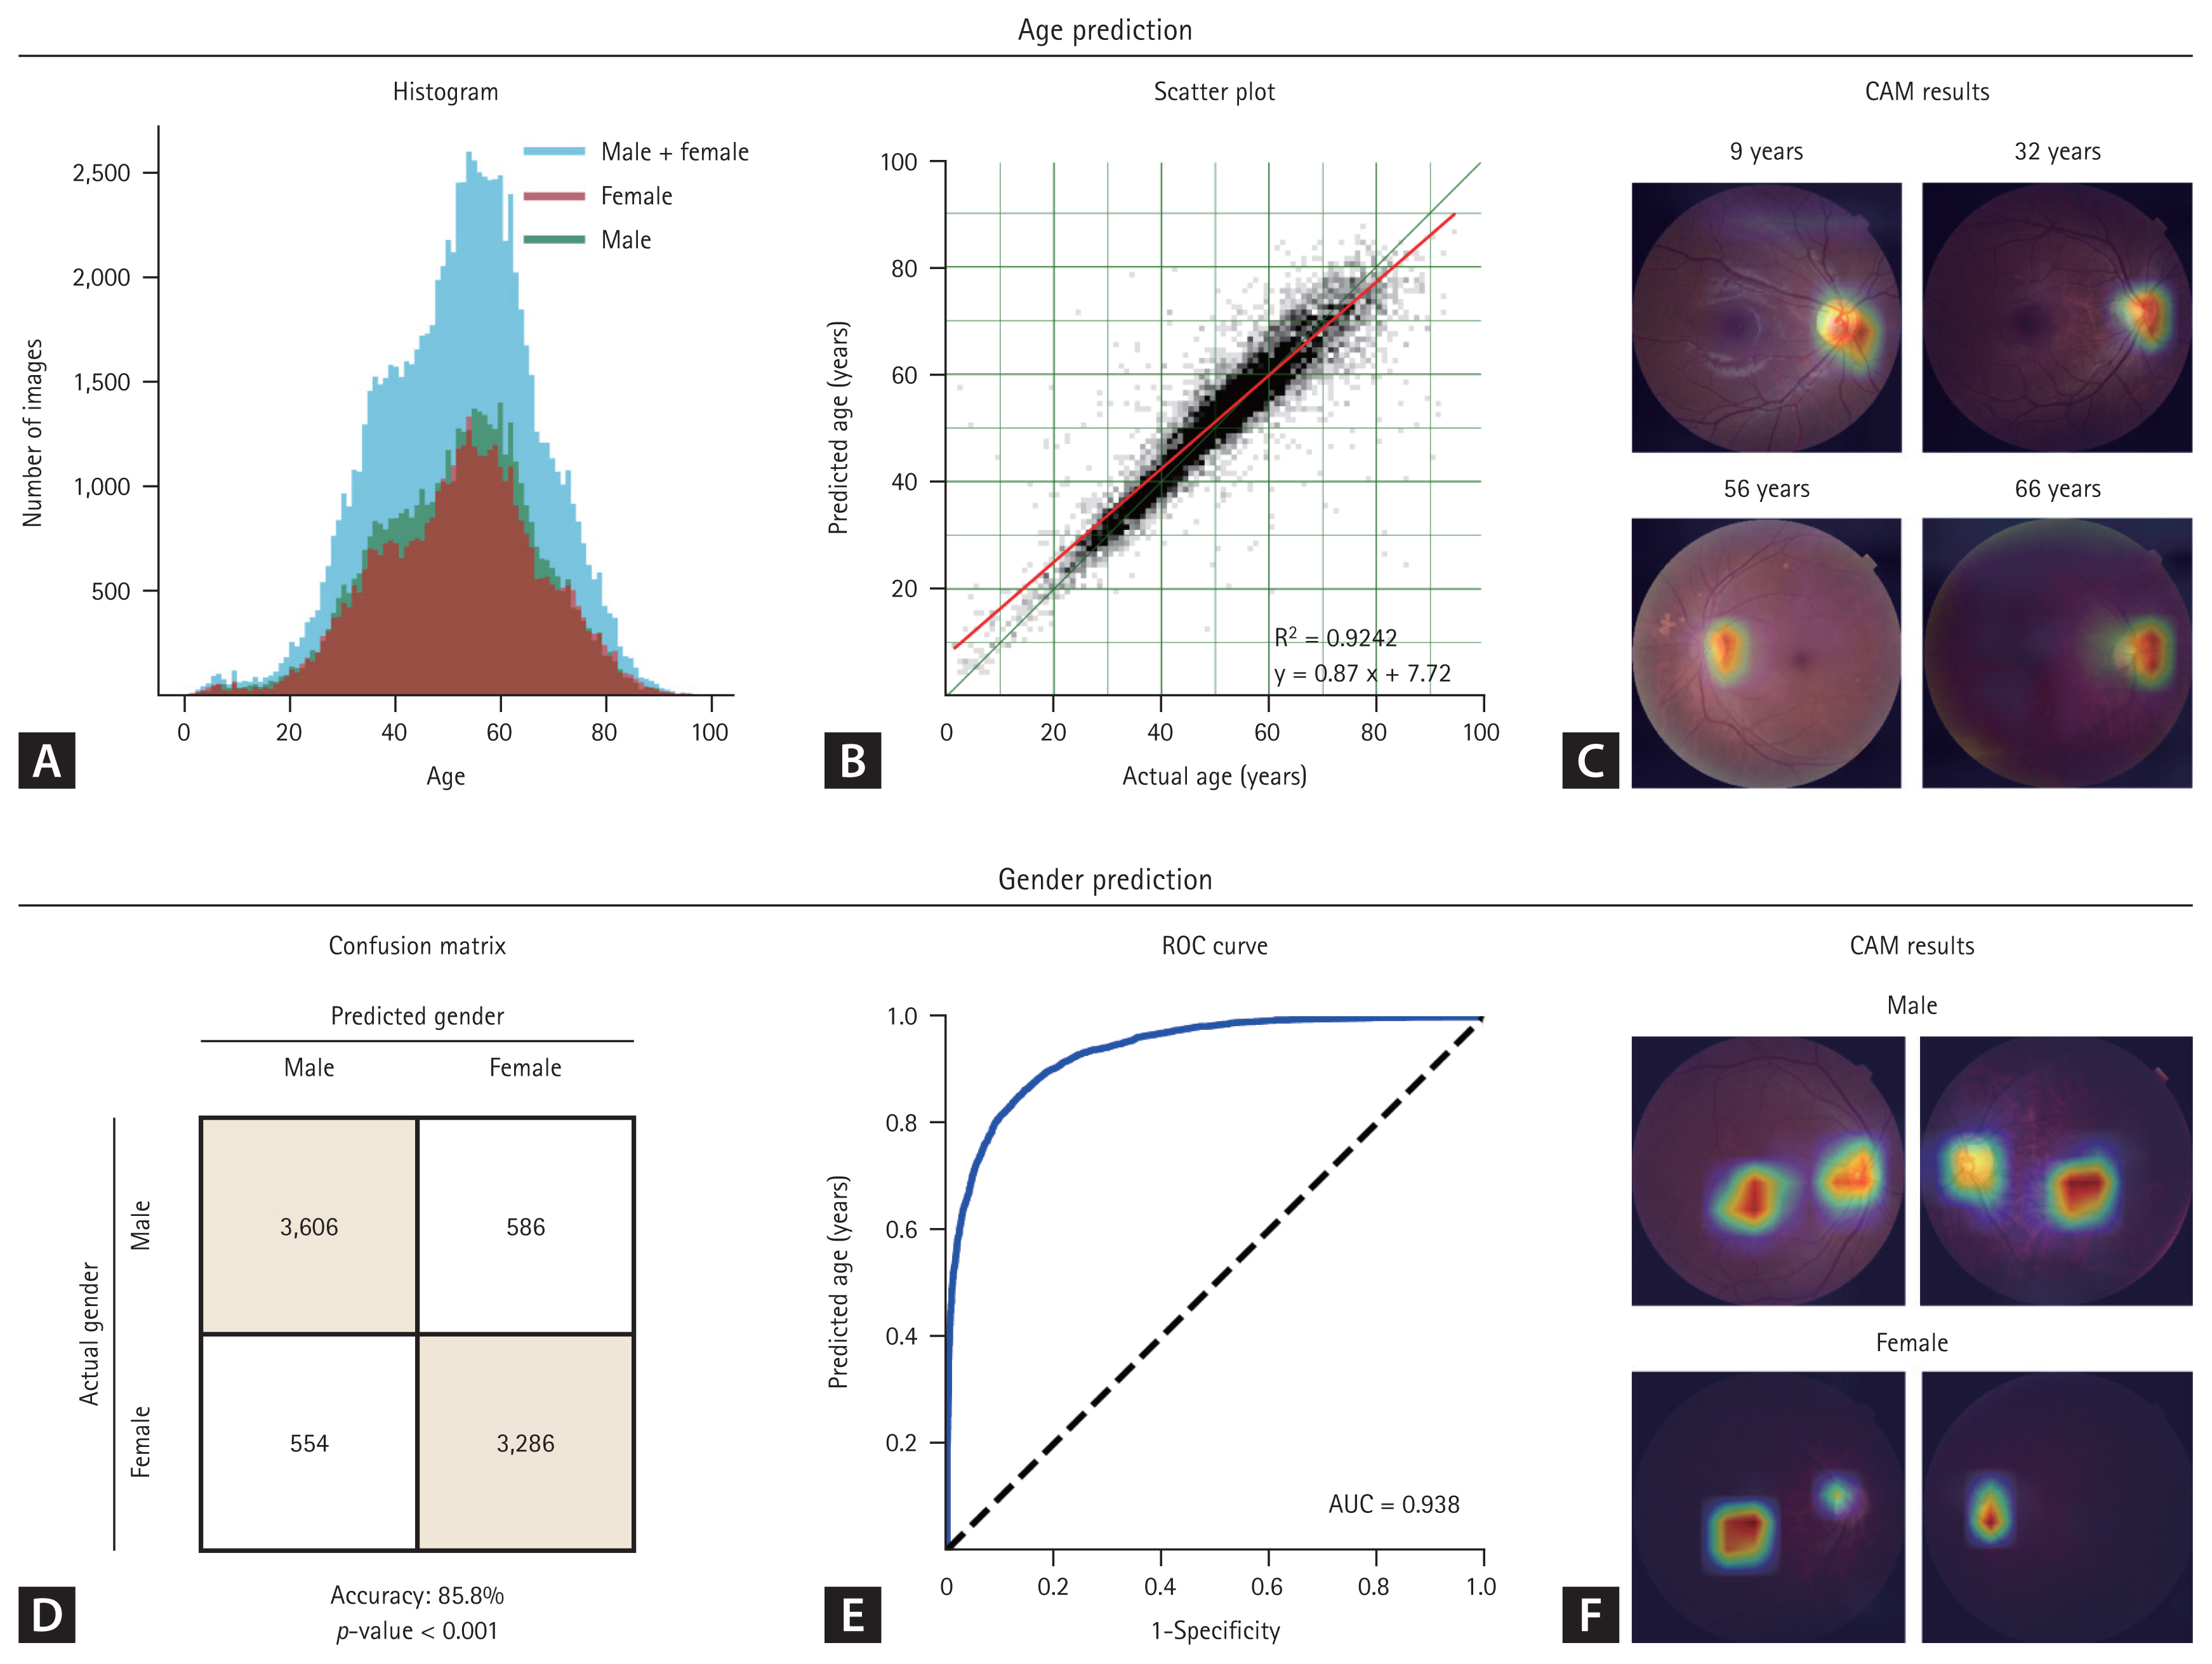
Age and sex prediction results. (A) Uniform age distribution between males and females. (B) Near-perfect age prediction correlation. (C) Class activation map (CAM) emphasizes the optic disc as the primary feature for age prediction. (D) High sex prediction accuracy (85.8%). (E) High area under the curve (AUC) for sex prediction (0.938). (F) Identification of optic disc and macula as important regions for sex prediction. ROC, receiver operating characteristic.
Creatinine prediction models based on fundus photographs
The prediction of creatinine levels using fundus photographs demonstrated lower accuracy compared to age and gender prediction models. The scatter plot revealed a distinct bifurcation, with males in the upper right and females in the lower left quadrants (Fig. 4). This pattern, along with a sex-based inconsistency in the creatinine distribution histogram, indicates that the model emphasizes sex differences over accurate creatinine level prediction. Furthermore, the CAM emphasized this limitation, revealing a large, information-lacking area in the bottom left, indicating the inability of the model to differentiate creatinine levels.
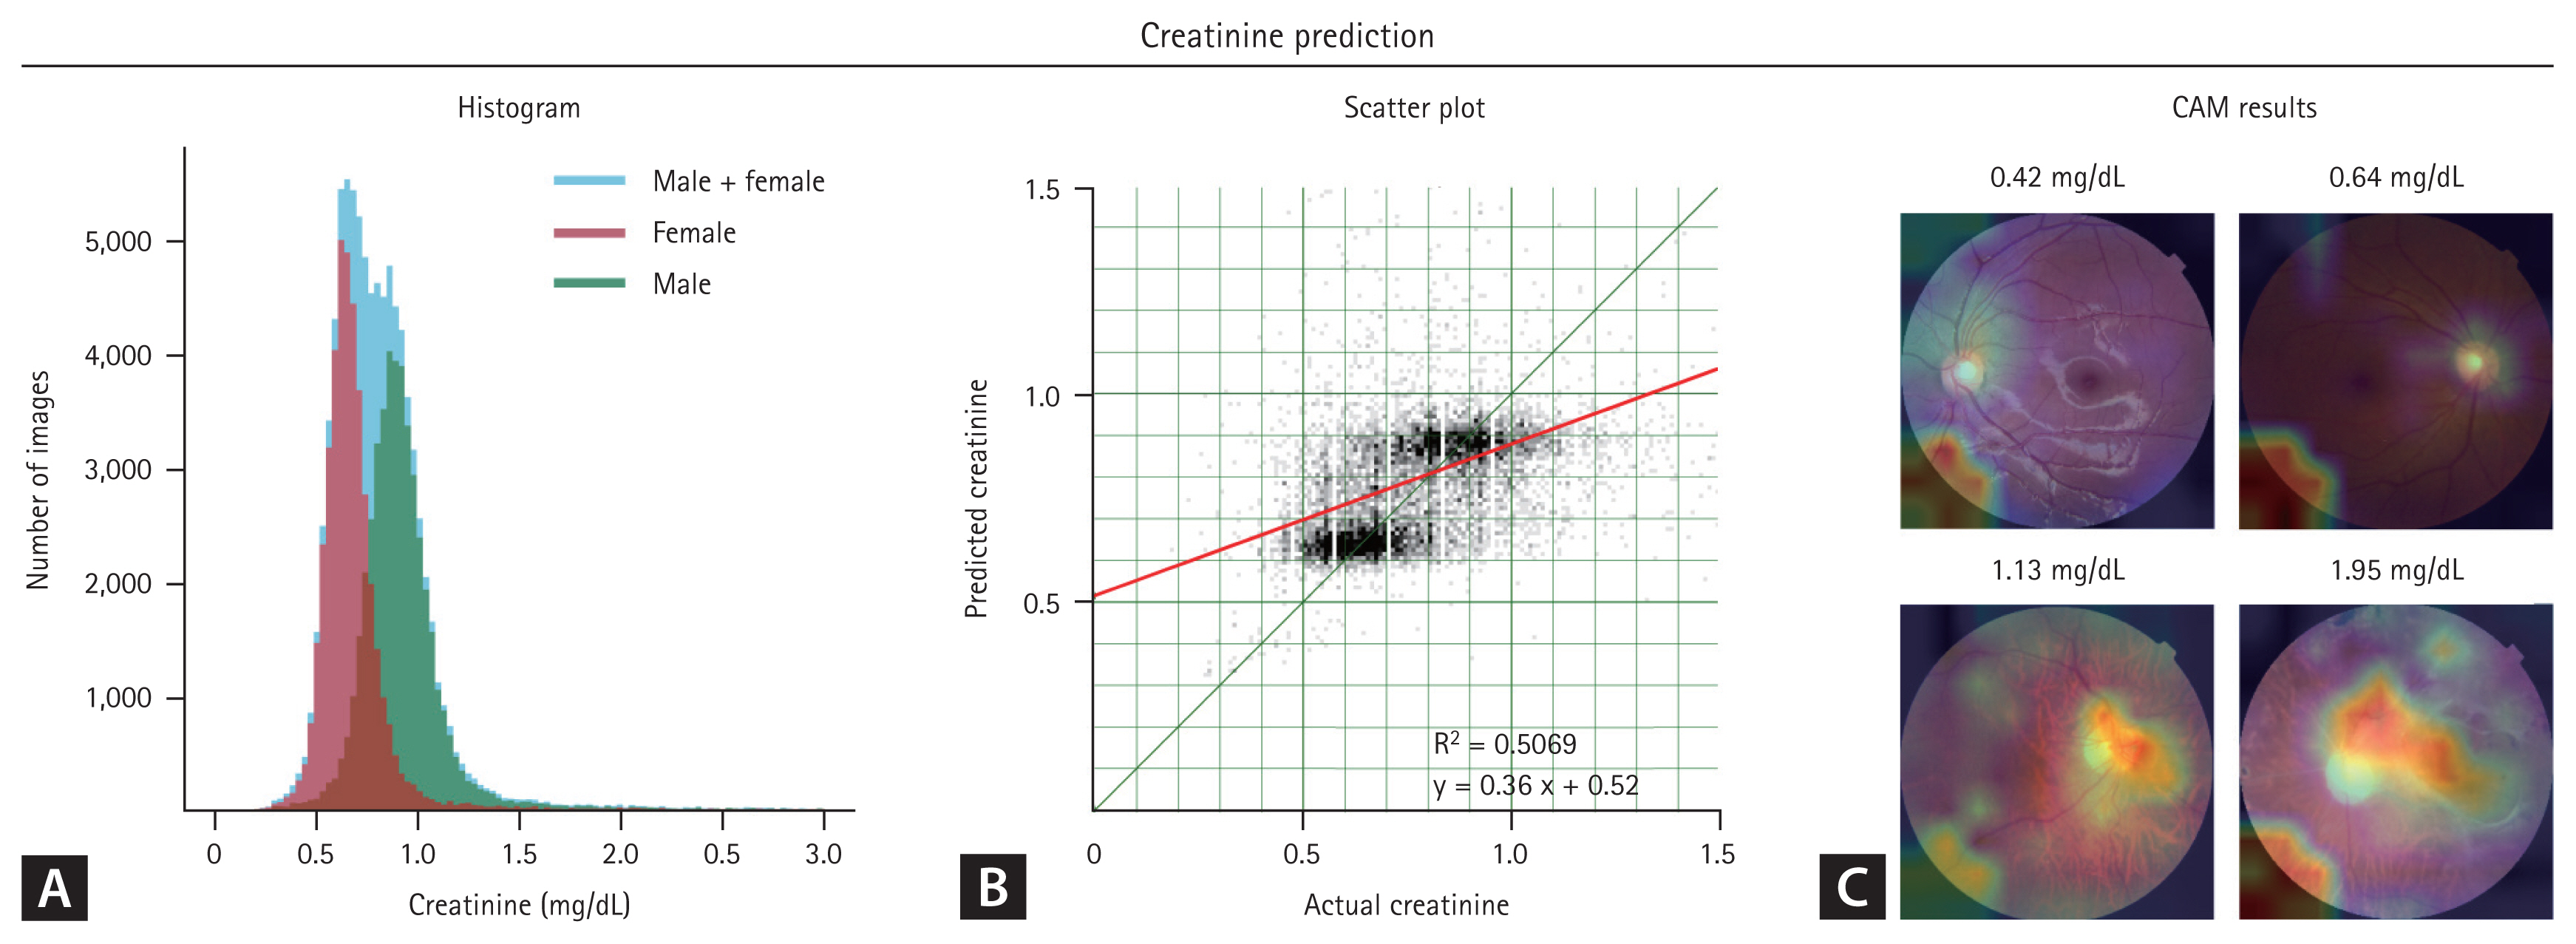
Serum creatinine prediction using fundus photographs. (A) Serum creatinine levels differ by sex (higher in males). (B) Sex-biased distribution in the scatterplot. (C) The class activation map (CAM) highlights uninformative regions.
eGFR prediction models based on fundus photographs
eGFR predictions using the MDRD and CKD-EPI formulas demonstrated statistically significant correlations (Fig. 5; p < 0.001). Scatterplots exhibited well-clustered linear regression lines, with the CKD-EPI formula exhibiting a higher coefficient compared to the MDRD formula (0.48 vs. 0.29). Moreover, the CKD-EPI formula achieved a superior AUC of 0.864 for CKD prediction, compared to 0.802 for the MDRD formula. CAM analysis revealed that the CKD-EPI formula effectively used features, such as the optic disc and macula, for eGFR prediction. Conversely, the MDRD formula consistently focused on an irrelevant pattern in the left lower area.
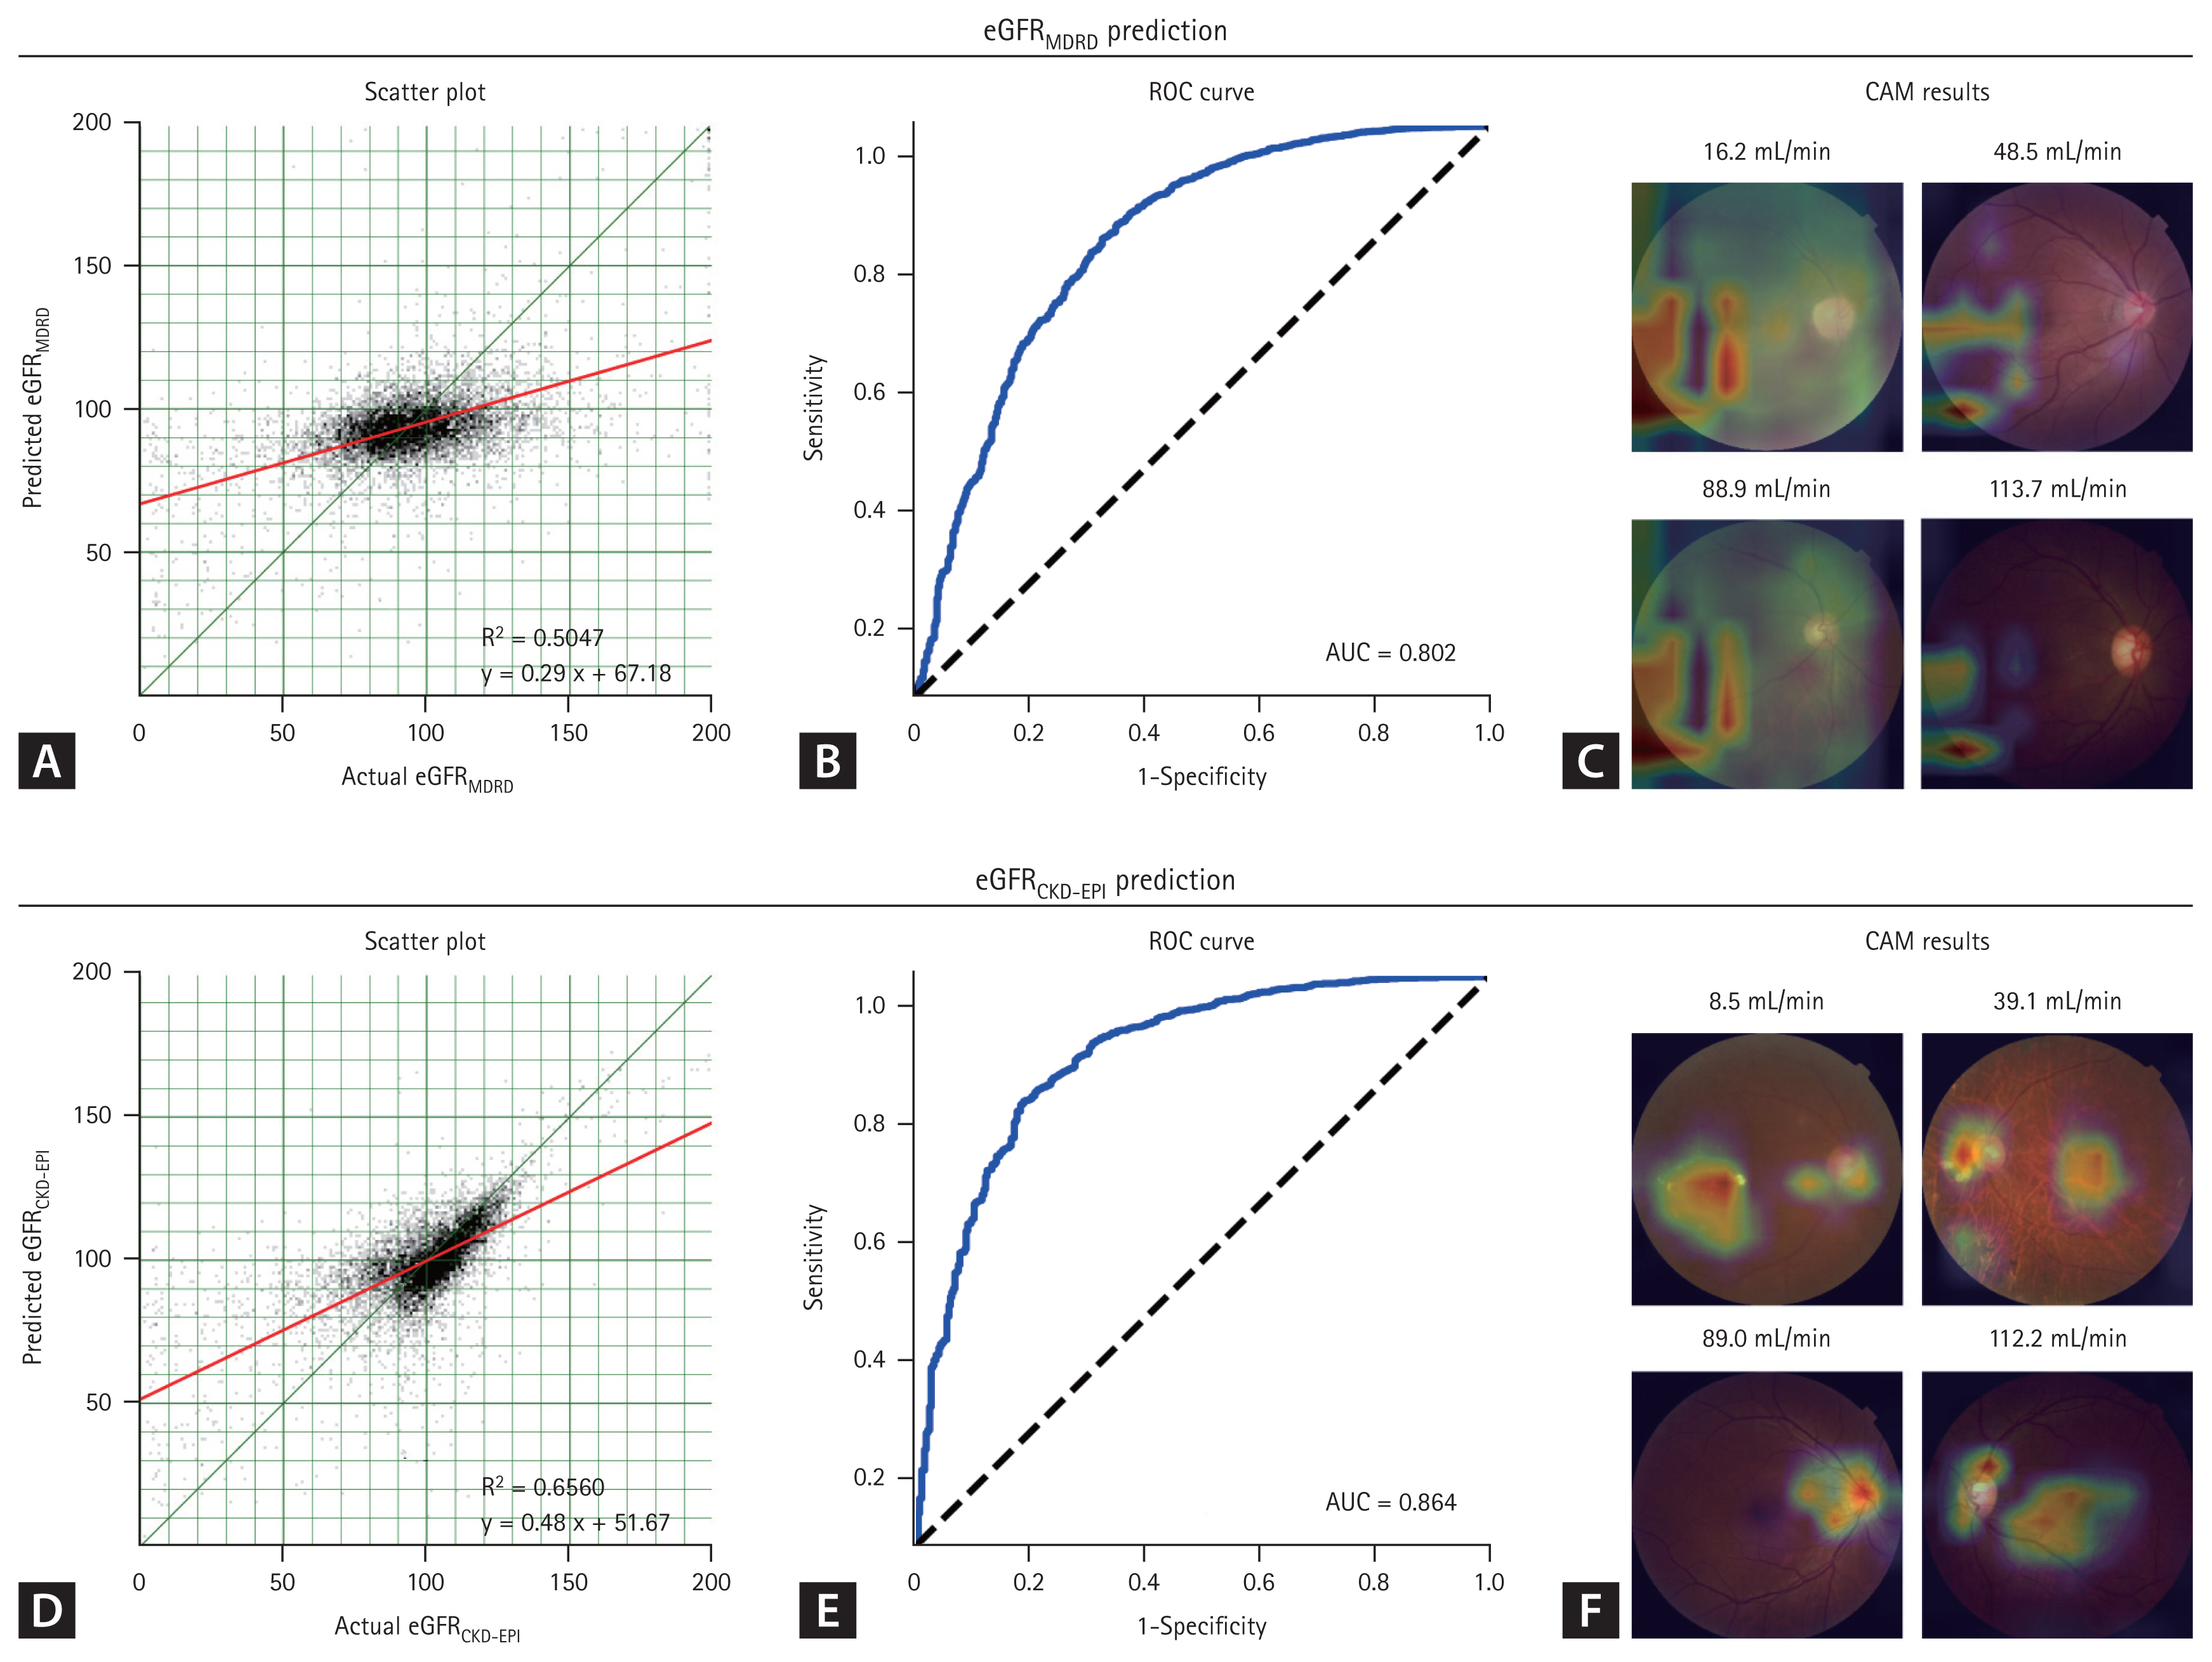
Estimated glomerular filtration rate (eGFR) prediction using fundus photographs. (A) The scatter plot from the Modification of Diet in Renal Disease (MDRD) formula scatterplot exhibits a weak correlation (slope of 0.29), with a near-horizontal distribution pattern. (B) The MDRD formula yields an area under the curve (AUC) of 0.802. (C) The MDRD formula emphasizes an uninformative lower-left region, indicating a potential bias. (D) The Chronic Kidney Disease Epidemiology Collaboration (CKD-EPI) formula scatterplot demonstrates a significant correlation (slope of 0.48), aligning closely with the central line. (E) The CKD-EPI formula yields a higher AUC of 0.864. (F) The CKD-EPI formula used features, such as the optic disc and macula, for eGFR prediction. ROC, receiver operating characteristic.
DISCUSSION
Our study demonstrated the ability of fundus photographs to predict eGFR. Furthermore, our results emphasize the superior performance of the CKD-EPI formula over the MDRD formula. This performance difference may be attributed to sex-related information acting as a confounding factor in the analysis of fundus photographs.
Previous studies have demonstrated a significant association between nephropathy and retinopathy. This correlation is attributed to the shared dense capillary network in the retina and kidneys. Pathological conditions affecting these capillaries could damage both organs. This association is observed in systemic conditions, such as diabetes mellitus and hypertension, and in patients without systemic diseases [24]. For instance, 45% of CKD patients exhibit retinal abnormalities detectable by ophthalmologists [24]. These abnormalities include vascular pathologies, such as diabetic retinopathy and hypertensive retinopathy, and other conditions, such as glaucoma and macular degeneration [24,25]. Notably, the risk of retinopathy increases 3-fold at eGFR < 30 mL/min/1.73 m2 [24].
DNNs excel at recognizing complex patterns, potentially uncovering information in fundus photographs previously undetectable to humans. Consequently, multiple studies have used DNNs and fundus photographs to predict renal function. These studies have demonstrated a remarkable ability to predict CKD, with receiver operating characteristic scores ranging from 0.81 to 0.93 [16,19,26]. Furthermore, accuracy improves when incorporating systemic diseases such as diabetes and hypertension [16,17,19,26]. Several studies have indicated the potential to predict serum levels of creatinine using fundus photographs [17,18]. Therefore, we designed this study to predict renal function accurately using such photographs.
In clinical settings, the eGFR is calculated using the CKD-EPI and MDRD formulas. Although both formulas consider creatinine levels, age, and sex, they differ in their coefficients [6]. Studies that have used DNNs and fundus photographs for eGFR prediction have used the MDRD or CKD-EPI formula ([16,19]. We calculated eGFR using both CKD-EPI and MDRD formulas to evaluate the variation in their influence on the learning and prediction capabilities of DNNs.
This study showed superior performance of the CKD-EPI formula compared to the MDRD formula. The DNN, trained using the eGFRCKD-EPI formula, exhibited a higher AUC in the CAM. Furthermore, scatter plots revealed a coefficient closer to 1, indicating a well-clustered distribution around the central line. Conversely, the DNN trained using the eGFRM-DRD formula demonstrated lower accuracy and uninterpretable CAM emphasis patterns, indicating inadequate model training. Our findings are consistent with previous studies that have predicted CKD using the MDRD formula with an AUC of 0.81 [26], while those that have used the CKD-EPI formula have reported a higher AUC ranging from 0.85 to 0.93 [16,19].
The MDRD and CKD-EPI formulas use creatinine levels, age, and sex to calculate eGFR. As we used identical fundus photographs, hyperparameters, and model structures, the input data for each model was ultimately the same. However, the differentially distributed results from the two models may be attributed to the complex interactions between the inputs.
We considered sex a confounding variable due to the discriminatory histograms exhibited by the MDRD and CKD-EPI formulas (Fig. 2A). Although eGFRCKD-EPI exhibited nearly identical distributions for both sexes, the eGFRMDRD exhibited a discriminatory distribution based on sex. This indicates an interaction between sex and the eGFRMDRD. Females exhibited a lower kurtosis and higher mean eGFRMDRD, inducing covariance.
Fundus photographs include age and sex information (Fig. 3). Previous studies have demonstrated high accuracy in predicting age and sex from such photographs [10–13]. Consequently, age and sex could act as confounding factors when predicting target variables. This effect was particularly evident in our creatinine level prediction model, where the levels significantly differed by sex (Fig. 5A). As the DNN could easily distinguish sex using fundus photographs, it may have prioritized sex identification over-interpreting subtle features related to creatinine levels, leading to a reduction in loss. This resulted in scatter plots of creatinine levels segregated by sex and suboptimal CAM results.
Furthermore, the prediction of renal function using fundus photographs presents a high degree of complexity. Consider the simpler example of predicting hemoglobin levels using fundus photographs. As with renal function, hemoglobin levels are influenced by age and sex. However, hemoglobin prediction using fundus photographs is highly accurate [27–29]; this is because hemoglobin in capillaries can be directly observed in fundus photographs, requiring minimal inference.
By contrast, predicting renal function involves multiple inferential stages. Notably, vascular pathologies can simultaneously affect the kidneys and retina; therefore, the prediction of renal function involves identifying these pathologies using fundus photographs and subsequently inferring renal function. As each stage introduces potential confounders, accuracy decreases with the increasing complexity of the reasoning process.
Our study demonstrated the superior accuracy of the CKD-EPI formula in eGFR predictions compared to the MDRD formula, particularly in diverse populations, including kidney transplant recipients and those with an eGFR > 60 mL/ min/1.73 m2 [6,30–33]. Furthermore, the CKD-EPI formula is a better predictor of mortality and end-stage renal failure risk than the MDRD formula [34].
This study had several limitations, including its single-center design and focus on an East Asian population. However, our findings align with those from multi-ethnic studies, indicating a limited impact of ethnicity. Fundus photographs, rich in vascular and neural structures, reflect systemic health, rendering them potential biomarkers. Our study emphasizes the importance of considering confounders in similar studies. In elderly populations or those with low muscle mass, serum levels of creatinine may underestimate renal function, overestimating eGFR and reducing predictive model accuracy.
The results of this study are consistent with those of previous CNN-based research [16,19,26]. We tested several models in addition to EfficientNet but obtained largely consistent results. It appears that CNNs may have limitations in predicting kidney function from fundus photographs. Recently, the superior performance of attention mechanisms used in large language models has received significant interest, and their application in image analysis is increasing. We plan to conduct further research using these new mechanisms alongside CNNs.
Fundus photography has the potential to be used as a biomarker in medical evaluations, assessing vascular and neural functions. It is fast and noninvasive, causing minimal discomfort to patients while allowing direct visualization of blood vessels and nerves. As more clinical data accumulate and automated interpretation methods become more widespread, the barriers to using fundus photography for screening are expected to decrease, making it increasingly accessible for many physicians.
In conclusion, we developed DNN models to predict renal function using fundus photographs; however, these models are susceptible to the influence of sex, a potential confounding factor. Therefore, the CKD-EPI formula, less susceptible to sex bias compared to the MDRD formula, is recommended to obtain more reliable results. Furthermore, careful consideration of such confounders is essential in future DNN studies using fundus photographs. This emphasizes the need for further studies to enhance the accuracy of artificial intelligence technologies in the prompt diagnosis and management of kidney diseases, thereby optimizing patient outcomes.
KEY MESSAGE
1. Fundus photographs can be used to predict eGFR. The CKD-EPI formula, less susceptible to sex bias, is more accurate in eGFR prediction compared to the MDRD formula. Sex can be a confounder in DNN models using fundus photographs.
Notes
CRedit authorship contributions
Hyun-Woong Park: conceptualization, methodology, resources, investigation, data curation, formal analysis, validation, software, writing - original draft, writing - review & editing, supervision, funding acquisition; Hae Ri Kim: writing - review & editing, visualization, supervision; Ki Yup Nam: writing - review & editing, visualization, supervision; Bum Jun Kim: writing - review & editing, visualization, supervision; Taeseen Kang: conceptualization, methodology, resources, investigation, data curation, formal analysis, validation, software, writing - original draft, writing - review & editing, visualization, supervision, project administration, funding acquisition
Conflicts of interest
The authors disclose no conflicts.
Funding
This work was supported by Chungnam National University Sejong Hospital Research Fund, 2023.
Data availability statement
The datasets generated and analyzed during the current study are not publicly available because that would exceed the scope of the IRB approval. However, these datasets can be made available from the corresponding author upon reasonable request.