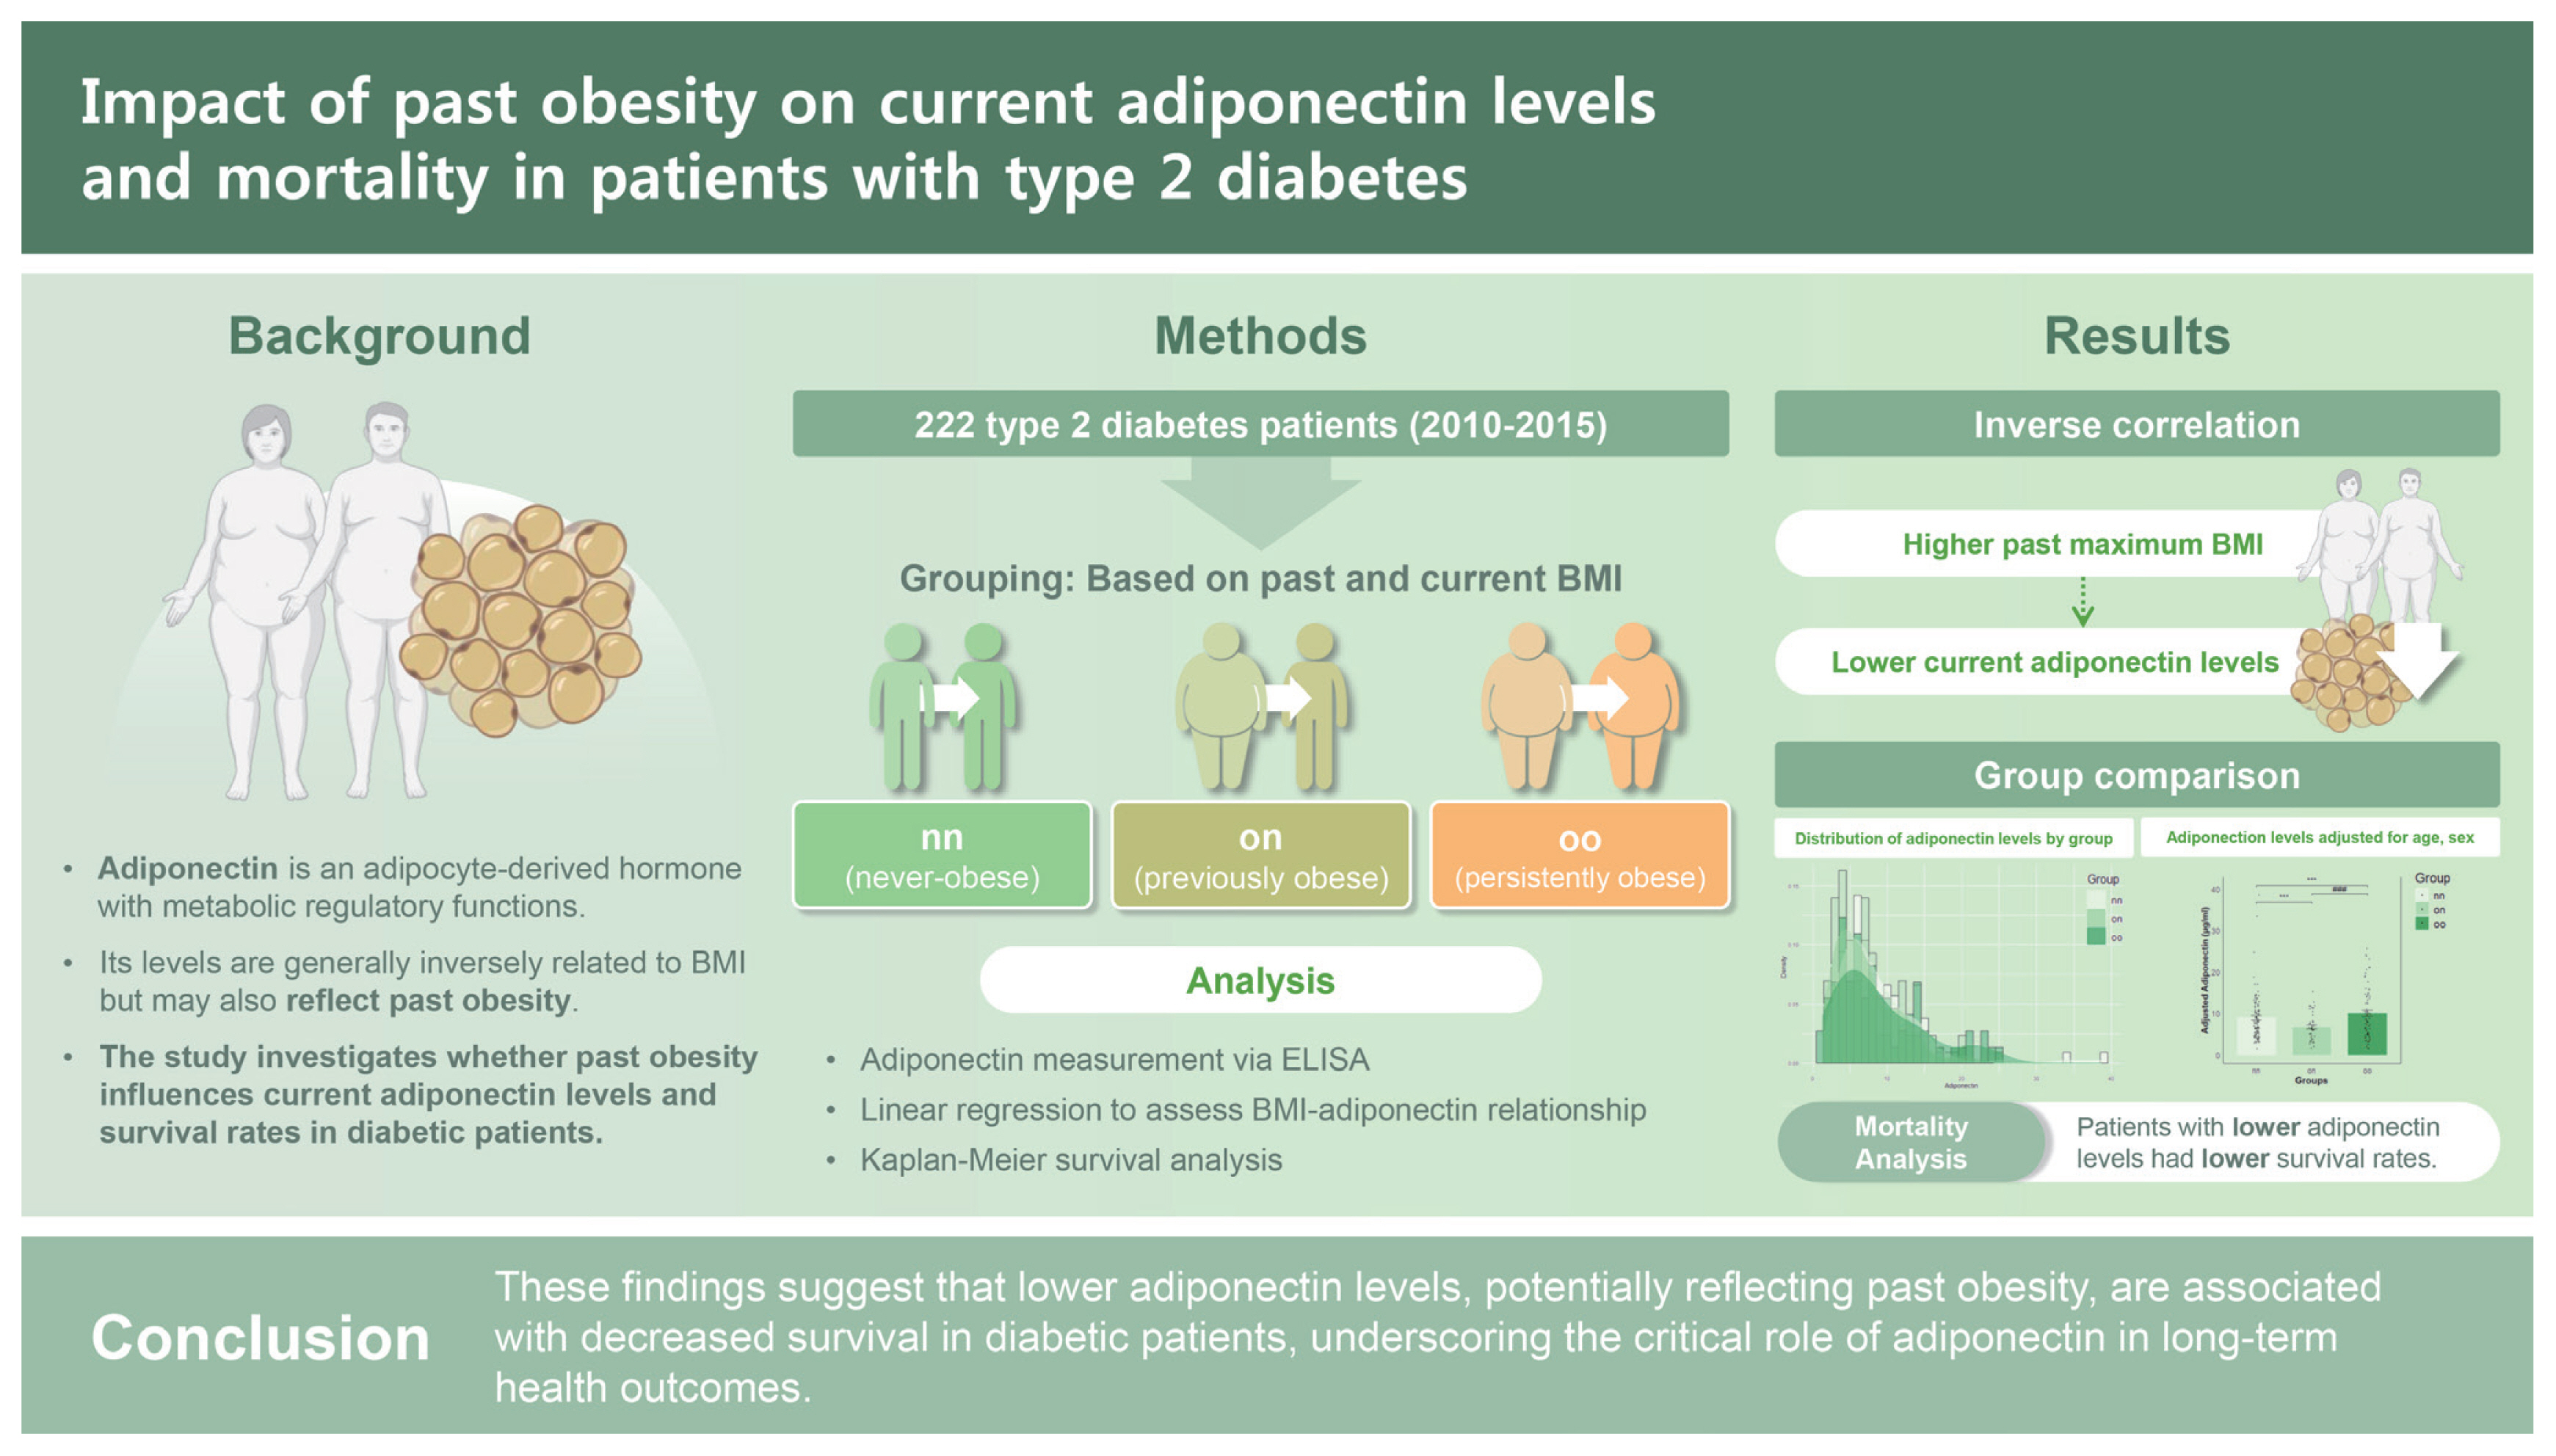
Persistent influence of past obesity on current adiponectin levels and mortality in patients with type 2 diabetes
Article information

Abstract
Background/Aims
Adiponectin, a hormone primarily produced by adipocytes, typically shows an inverse relationship with body mass index (BMI). However, some studies have reported a positive correlation between the two. Thus, this study aimed to examine the relationship between adiponectin level and BMI in diabetic patients, focusing on the impact of past obesity on current adiponectin levels.
Methods
We conducted an observational study analyzing data from 323 diabetic patients at Kyungpook National University Hospital. Based on past and current BMIs, participants were categorized into never-obese (nn, n = 106), previously obese (on, n = 43), and persistently obese (oo, n = 73) groups based on a BMI threshold of 25 kg/m2. Adiponectin level and BMI were key variables. Kaplan–Meier analysis assessed their impact on all-cause mortality up to August 2023, with survival differences based on adiponectin quartiles and follow-up starting from patient enrollment (2010–2015).
Results
The analysis revealed a significant inverse correlation between adiponectin level and past maximum BMI. The on group exhibited approximately 10% lower adiponectin levels compared to the nn group. This association remained significant after adjusting for current BMI, age, and sex, highlighting the lasting influence of previous obesity on adiponectin levels. Furthermore, survival analysis indicated that patients in the lowest adiponectin quartile had reduced survival, with a statistically significant trend (p = 0.062).
Conclusions
Findings of this study suggest that lower adiponectin levels, potentially reflecting past obesity, are associated with decreased survival in diabetic patients, underscoring a critical role of adiponectin in long-term health outcomes.
INTRODUCTION
Excessive fat accumulation is linked to adipose inflammation and systemic metabolic imbalances, contributing to various diseases such as cancer, type 2 diabetes, fatty liver, and cardiovascular disease [1–3]. Adipose tissue functions as an endocrine organ, releasing adipokines, notably adiponectin essential for energy homeostasis [4,5]. Produced by adipocytes, adiponectin can enhance fatty acid oxidation and inhibit fat formation [6,7]. Relationships between adiponectin level and body mass index (BMI) are inconsistent. Although an inverse correlation between the two is commonly reported [8,9], a positive correlation between the two has been observed in conditions such as liver cirrhosis [10] and obesity [11]. Thus, their relationship remains elusive [12].
In adiponectin knockout mice, an increase in insulin resistance has been observed [13]. Intravenous administration of adiponectin can inhibit enzymes related to gluconeogenesis in the liver, thereby suppressing a rise in blood glucose level [14]. Low adiponectin level can predict metabolic syndrome [15] and diabetes risk [16], with low levels often preceding diabetes [17]. Effect of weight loss on adiponectin remains unclear, with some studies noting that weight loss can decrease adiponectin level [18] while others showing no significant relationship between the two [19].
Obesity and related health issues are increasing globally [20]. Weight loss is known to be effective in reducing metabolic risks [21]. However, many people regain weight after weight loss, suggesting a ‘metabolic memory’ [22–24]. Although it is known that patients with diabetes often exhibit insulin resistance, little is known about effects of weight change and obesity on adiponectin levels in this population. Thus, this research aimed to investigate whether past body weight could influence current adiponectin levels in diabetic patients.
METHODS
Participants and study design
This was a retrospective cohort study involving diabetic patients admitted to the Department of Endocrinology at Kyungpook National University Hospital who agreed to participate in this research. Between 2010 and 2015, 323 diabetic patients were recruited, including 155 males and 168 females. We obtained each participant’s medical history, including information on underlying diseases and medications, duration of diabetic mellitus status, and past maximum weight, using a standardized questionnaire. All baseline assessments were conducted at Kyungpook National University Hospital from January 2010 to November 2015. The research design and protocol were reviewed and approved by the Institutional Review Board (IRB) of Kyungpook National University Hospital (IRB No: KNUH 2012-07-036-001). All study subjects provided written informed consent. Basic characteristics of patients included in the study are summarized in Table 1.

Baseline clinical characteristics of patients in different groups
Clinical measurement
Current weight, height, waist circumference, hip circumference, and blood pressure were measured. A survey was conducted to determine past maximum weight, the type of oral hypoglycemic agents currently being taken, insulin administration status, and history of diabetes.
Laboratory measurements
Among diabetic patients admitted to the Department of Endocrinology, blood samples were collected from participants who consented to this study specifically for measuring adiponectin. Serum samples were immediately frozen and stored at −70°C. Serum adiponectin concentrations were measured using a commercially available enzyme-linked immunosorbent assay (ELISA) kit (Human Adiponectin ELISA; BioVendor, Brno, Czech). All samples were measured in one run to minimize variability. In addition, we investigated various parameters routinely assessed during hospital admission tests, including low-density lipoprotein (LDL) cholesterol, high-density lipoprotein (HDL) cholesterol, triglycerides (TG), fasting blood sugar (FBS), glycated hemoglobin (HbA1c), C-reactive protein (CRP), creatinine (Cr), sodium (Na), potassium (K), aspartate aminotransferase (AST), and alanine aminotransferase (ALT). Data for these parameters were obtained from standard laboratory tests conducted at the time of patient admission.
Calculation of BMI and definition of obesity
Obesity was defined in accordance with the 2022 Update of the Clinical Practice Guidelines for Obesity by the Korean Society for the Study of Obesity [25]. In adults, this definition was operationalized when BMI–calculated as weight in kilograms divided by the square of height in meters–equaled or exceeded 25.0 kg/m2.
Kaplan–Meier analysis
Kaplan–Meier survival analysis was conducted to evaluate the association between adiponectin level and all-cause mortality. Participants were divided into quartiles based on their adiponectin levels. Survival differences were assessed using the log-rank test. Mortality data were obtained from hospital records, national death registries, and family reports and further confirmed via the Clinical Data Warehouse (CDW). All-cause mortality follow-up continued until August 2023, with statistical significance set at p < 0.05.
Statistical analysis
Cox proportional hazards regression was applied to evaluate the relationship between adiponectin level and mortality after adjusting for confounders such as age, sex, and current BMI. All statistical analyses were performed using R software (version 4.2.0), with hazard ratios reported alongside 95% confidence intervals. Comparisons between measurements were conducted using Student’s t-test. Correlations between adiponectin and other variables were assessed using Spearman’s rank and Pearson’s correlation coefficients. Kaplan–Meier curves were generated using the ‘survival’ package in R. Statistical significance was determined at a threshold of p < 0.05. Additional R packages, including ‘survey’, ‘corrplot’, ‘moonBook’, ‘dplyr’, ‘ggplot2’, and ‘matchit’, were also utilized for various analyses.
RESULTS
Grouping based on the presence of obesity in patients, both current and historical
In a study conducted at the Department of Endocrinology and Metabolism of Kyungpook National University Hospital between 2010 and 2015, 323 diabetic patients consented to participate. They underwent blood sampling and a survey. In the cohort, males accounted for 48%. Of the study cohort, the average age was 59.9 ± 13.9 years and the average diabetes duration was 12.8 ± 9.9 years. Their current average body weight was 61.0 ± 12.1 kg. After excluding 101 patients due to type 1 diabetes, missing data, age below 20, BMI below 18.5 kg/m2, or use of thiazolidinediones [26] which could affect adiponectin levels, 222 patients were analyzed (Supplementary Table 1).
To determine the impact of past body weight on currently non-obese patients, groups were categorized based on a BMI threshold of 25 kg/m2. Those with 18.5 kg/m2 ≤ BMI < 25 kg/m2 were classified as non-obese (n). Those with BMI ≥ 25 kg/m2 were classified as obese (o). Grouping was done based on past maximum weight and current weight into past non-obese/current non-obese (nn, n = 106), past obese/current non-obese (on, n = 43), past obese/current obese (oo, n = 73), and past non-obese/current obese (no, n = 0) (Fig. 1).
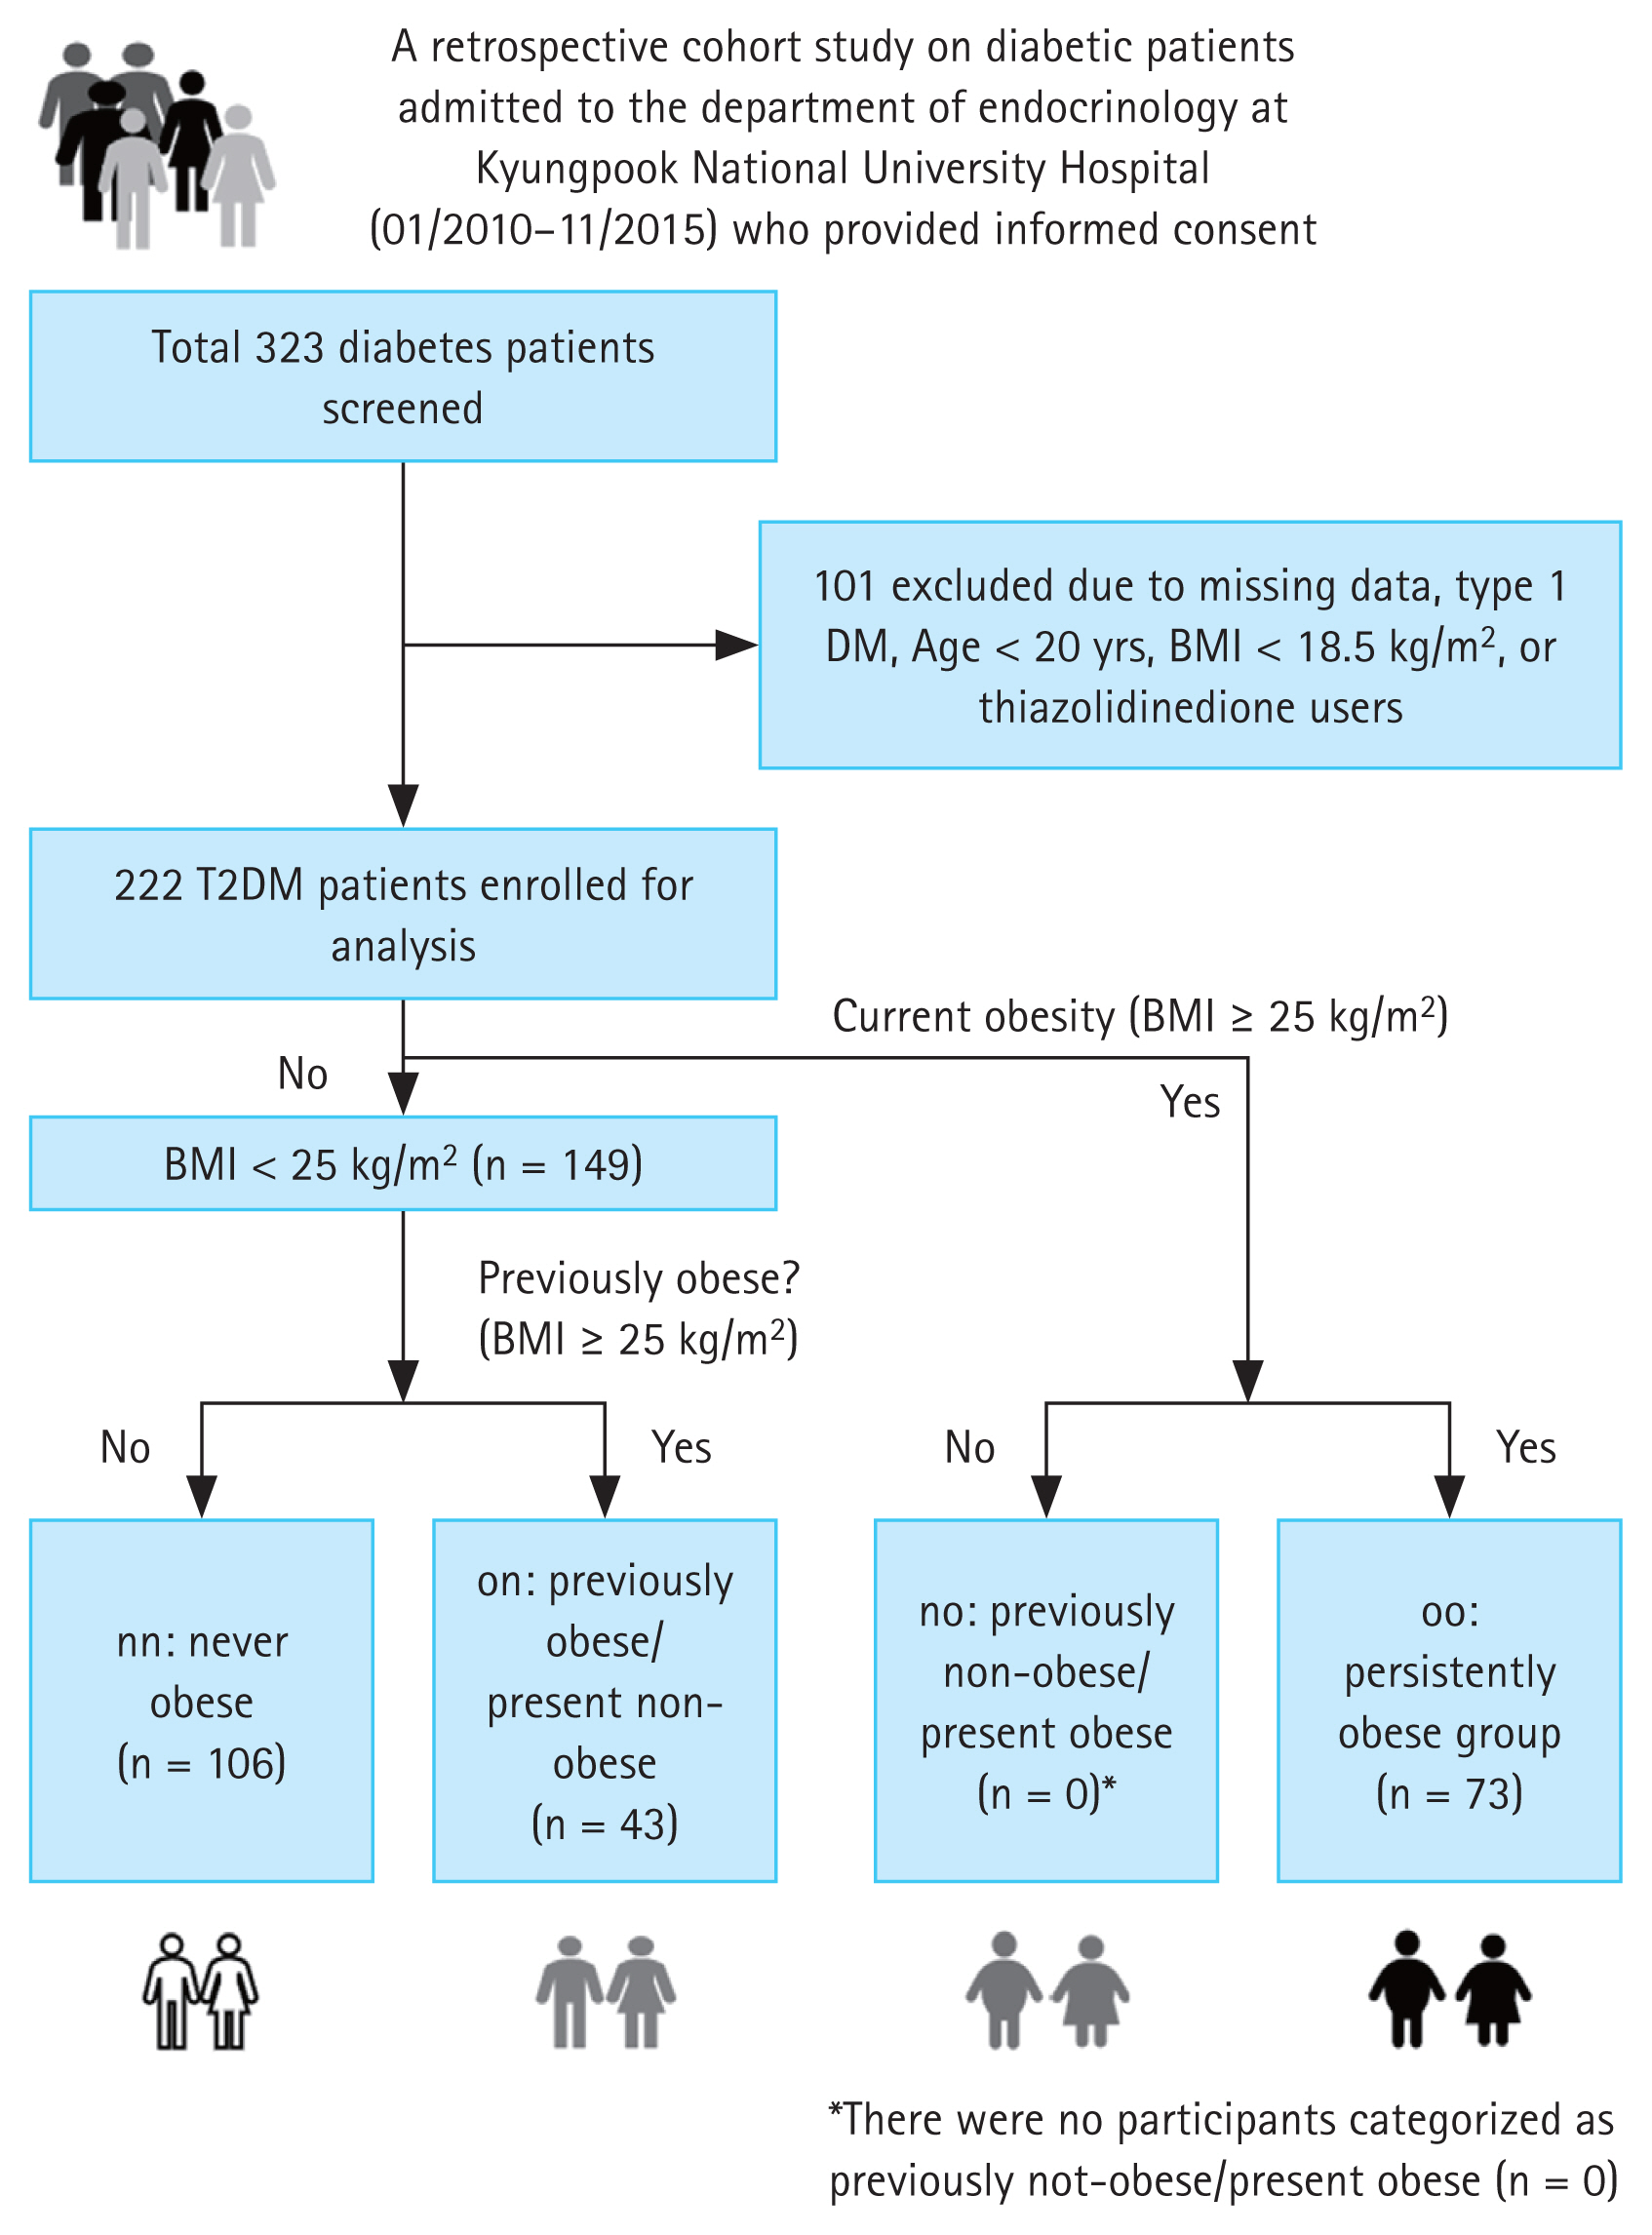
Study design for participant selection. A total of 323 diabetes patients were initially screened. Among these, 101 patients were excluded due to missing data, type 1 DM, age under 20, or use of thiazolidinedione medication. The remaining 222 T2DM patients were enrolled for analysis. Of these, 149 patients were identified as being non-obese. The non-obese group was further divided into three subgroups: nn (never obese, n = 106), on (formerly obese/present non-obese, n = 43), and oo (persistently obese, n = 73). DM, diabetes mellitus; T2DM, type 2 diabetes mellitus; BMI, body mass index.
Correlation between adiponectin and maximum BMI
Linear regression analysis indicated a negative correlation between prior maximal BMI and adiponectin level (R2 = 0.03, p = 0.01) (Fig. 2A). However, adiponectin level showed weaker correlations with current BMI (R2 = 0.012, p = 0.01; Fig. 2B), past maximum weight (R2 = 0.016, p = 0.061; Fig. 2C), and current weight (R2 = 0.004, p = 0.33; Fig. 2D). This pattern suggests that effects of previous obesity on adiponectin levels persist over time. The association between adiponectin and current BMI or weight was less pronounced, pointing to a more substantial long-term metabolic influence of historical obesity on adiponectin regulation.
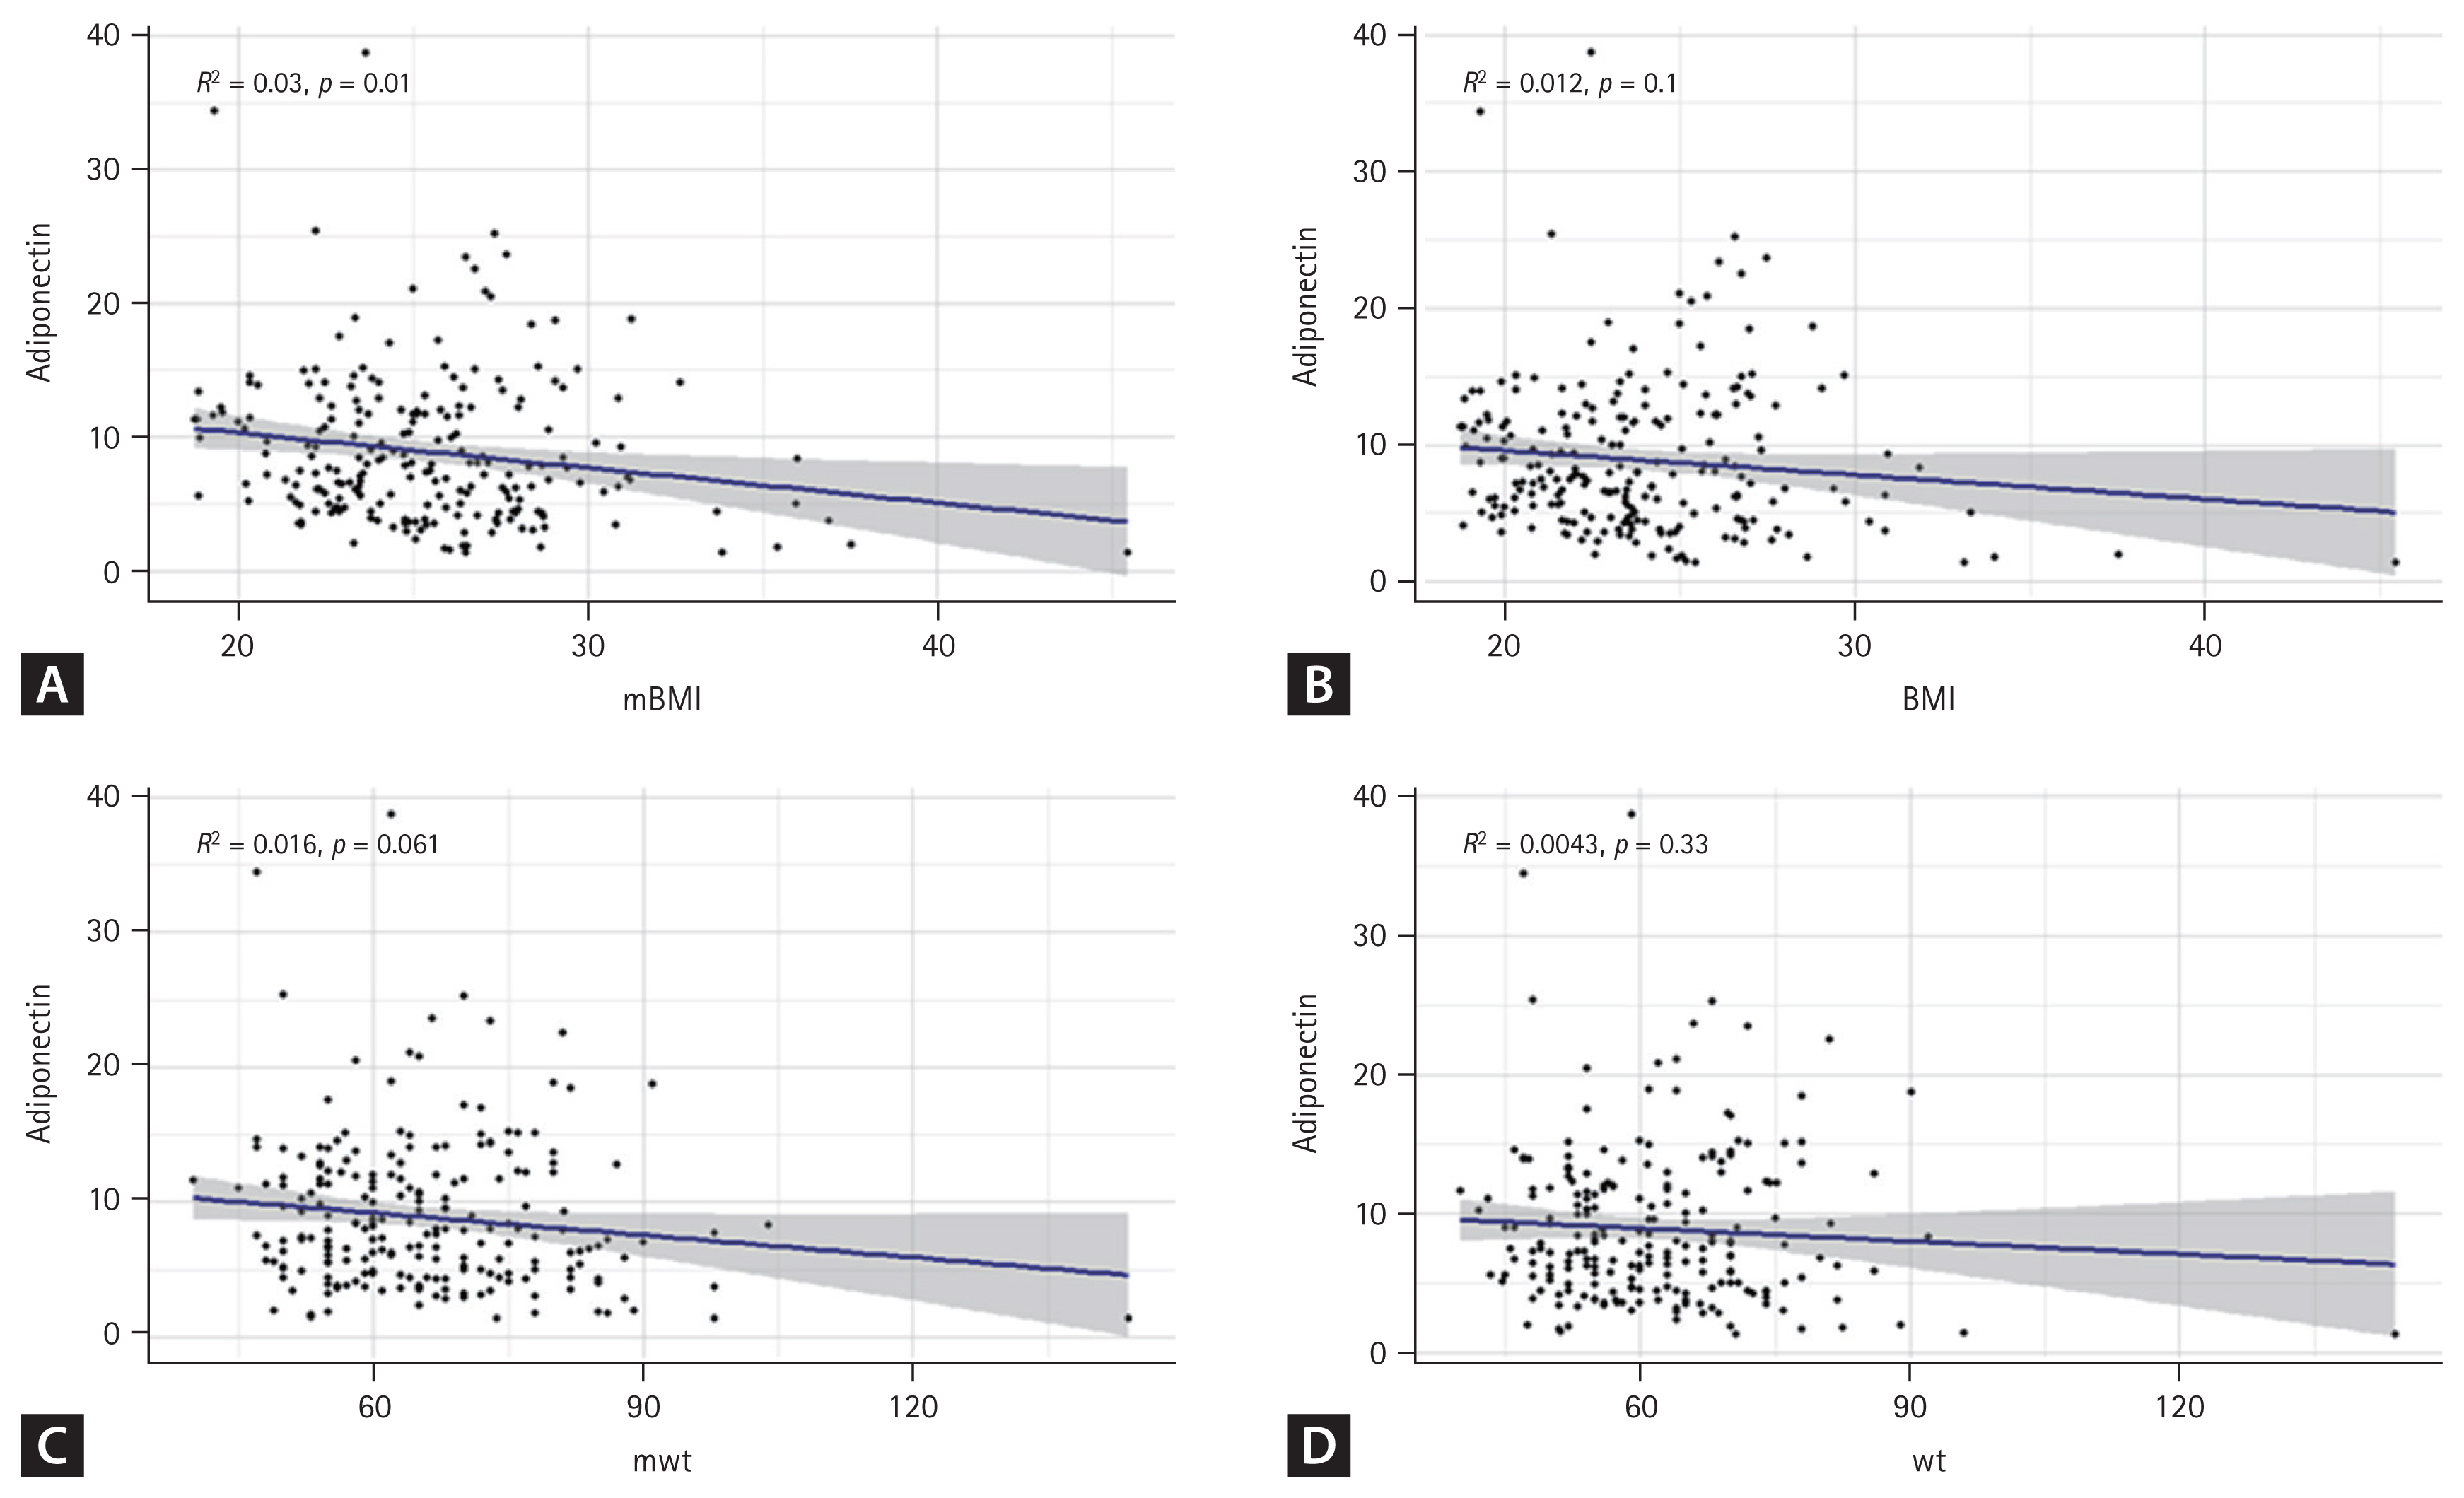
Linear regression curve showing correlation between adiponectin and mBMI. Relationships between adiponectin level and different measures of wt and BMI in patients were determined. Each dot represents an individual participant, with the blue line indicating linear regression fit and the shaded area representing 95% confidence interval. Correlation coefficient (R) and p value are shown on the plot. (A) Correlation between adiponectin level and past mBMI. (B) Correlation between adiponectin level and current BMI. (C) Correlation between adiponectin level and past mwt. (D) Correlation between adiponectin level and current wt. The blue line indicates the linear regression fit and the shaded area represents the 95% confidence interval. mBMI, maximum body mass index; BMI, body mas index; mwt, maximum body weight; wt, body weight.
Adiponectin serves as a unique metabolic marker indicating past obesity
Adiponectin levels showed statistically significant differences among the three groups, with the lowest levels observed in patients who were obese in the past but currently of normal weight. However, adiponectin level showed no correlation with sex, age, waist circumference, HbA1c, or LDL cholesterol, although it was traditionally associated with them (Table 1, 2). Adiponectin levels were found to be significantly different among groups (average level: 8.72 ± 5.73 μg/mL in the nn group, 6.63 ± 3.42 μg/mL in the on group, and 9.52 ± 6.23 μg/mL in the oo group, p = 0.025). This suggests that adiponectin levels are influenced by obesity status history, with the previously obese group showing lower levels even after returning to a non-obese state. Other measured parameters, including CRP, HbA1c, FBS, lipid profile (LDL, HDL, TG), liver enzymes (AST, ALT), urine ACR, and Cr, did not show significant differences across groups (p > 0.05 for all). These findings highlight the unique relationship between historical obesity and current adiponectin level, independent of other common metabolic markers.
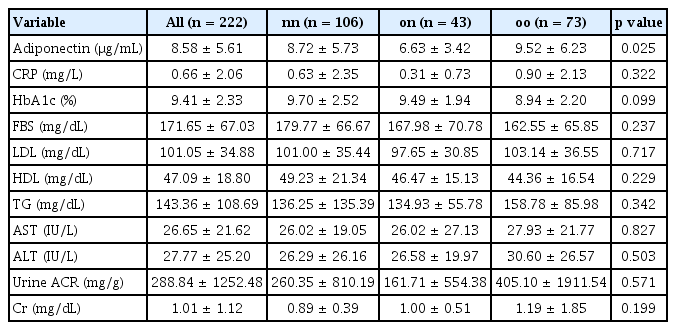
Baseline laboratory characteristics of patients in three groups
Past obesity continues to influence current adiponectin levels after adjusting for age, sex, and current BMI
Adiponectin levels in adults are known to vary according to age, sex, and current BMI [27]. In our cohort, distribution of adiponectin levels differed significantly according to past obesity status. Specifically, individuals with a history of obesity (on group) exhibited a distribution that was left-skewed towards lower adiponectin levels compared to those who were never-obese (nn group) or ever-obese (oo group) (Fig. 3A).
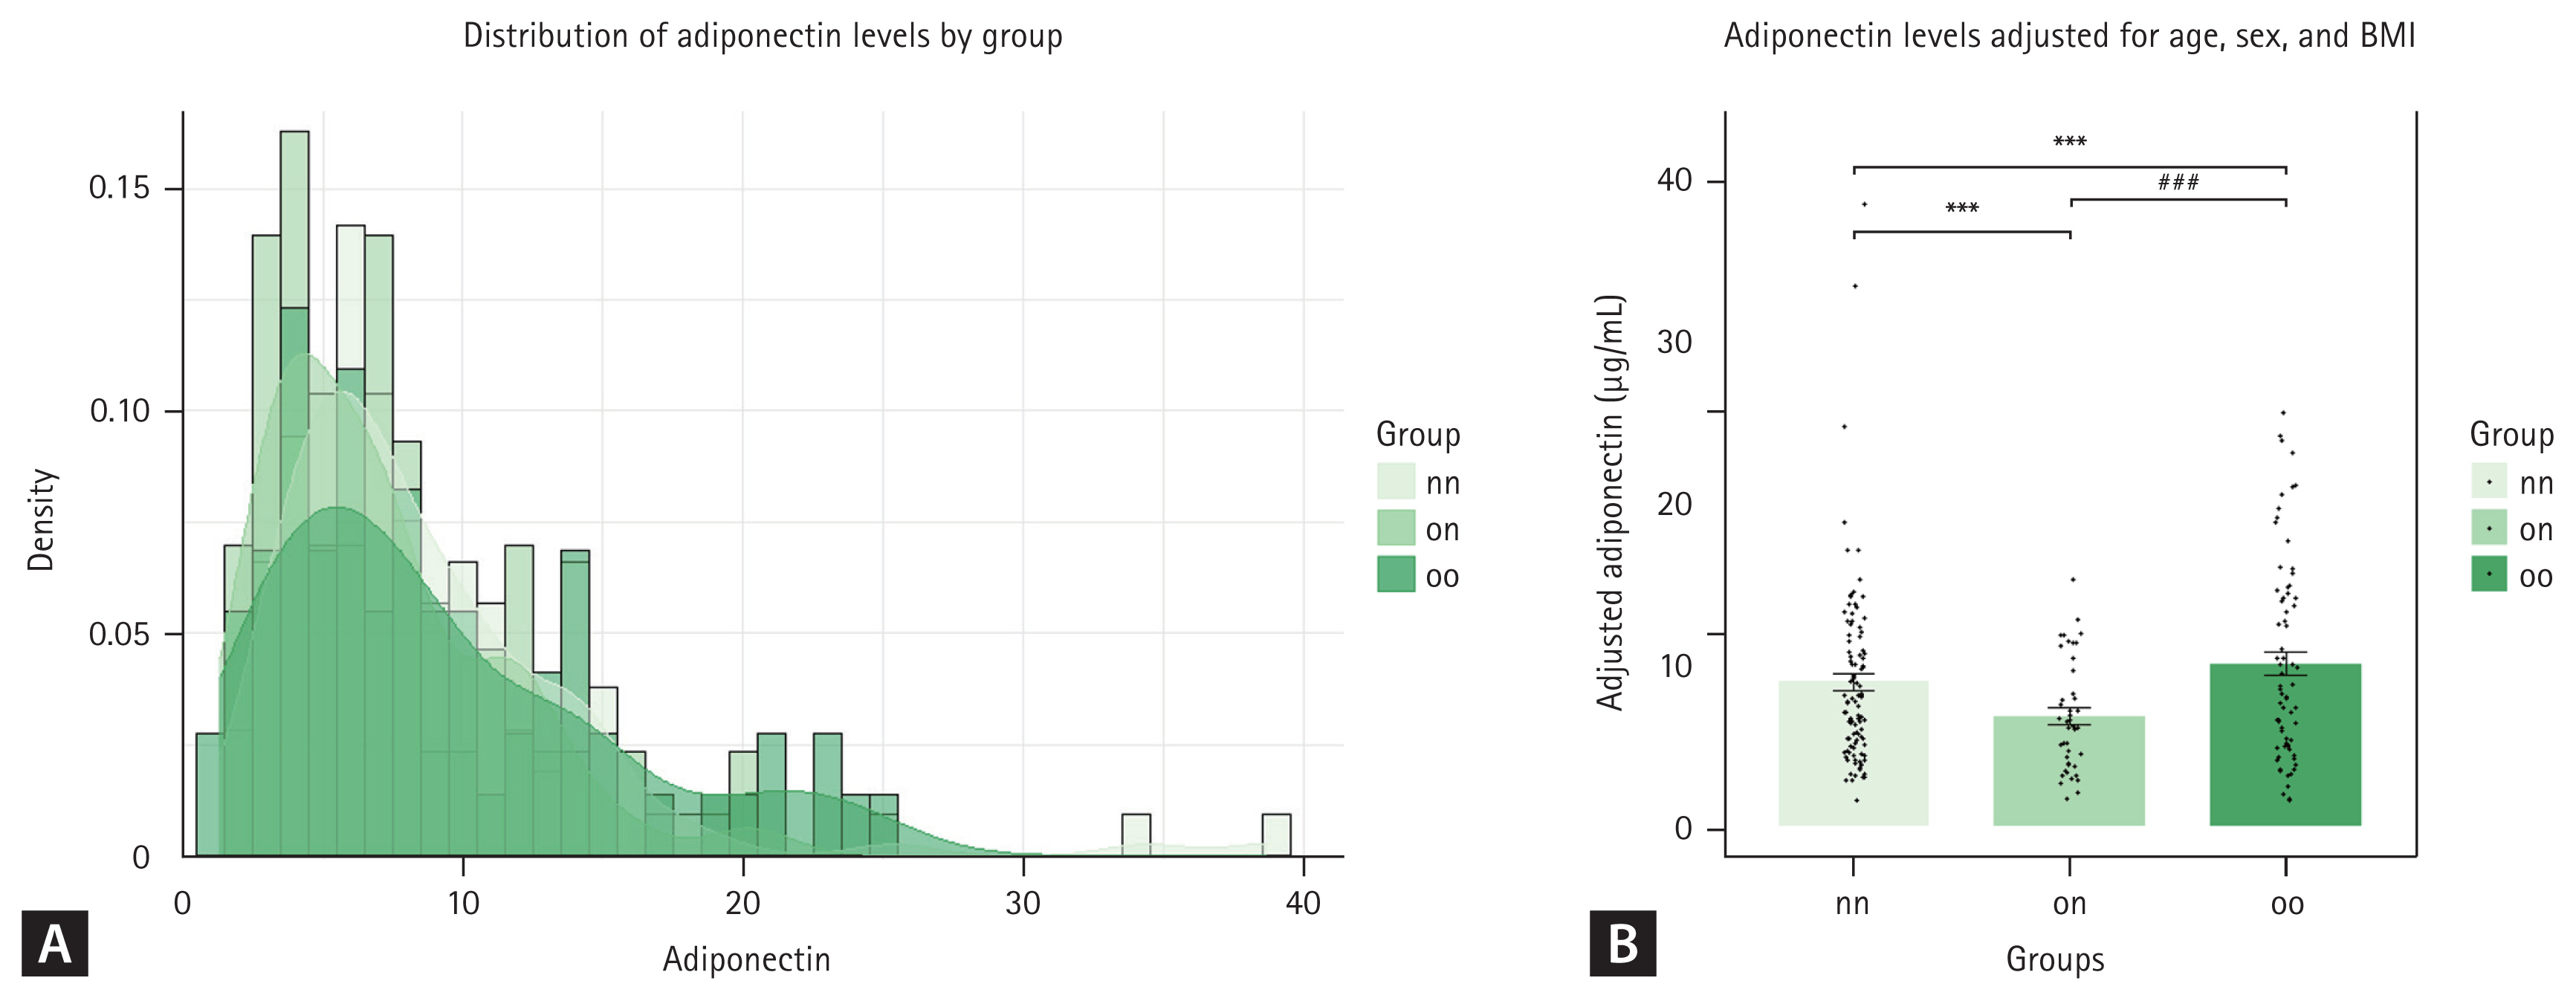
Estimated adiponectin levels remain significantly lower in the past obesity group after adjusting for age, sex, and body mass index (BMI). (A) Density distribution of adiponectin levels for three groups: nn (never obese, n = 106), on (formerly obese/present non-obese, n = 43), and oo (persistent obese, n = 73). (B) Mean adiponectin levels for each group after adjusting for age, sex, and BMI. Error bar represents the standard error of the mean. Significant differences between groups were determined with Tukey’s multiple comparisons test: ***p < 0.0001 vs. nn; ###p < 0.0001 vs. on.
After adjusting for age, sex, and current BMI, adiponectin levels were significantly different among groups. The estimated mean adiponectin level was 8.30 ± 0.66 μg/mL for the nn group, 6.86 ± 0.86 μg/mL for the on group on, and 9.50 ± 0.91 μg/mL for the oo group, as shown in Table 3. The 95% confidence intervals for these estimates were 6.99–9.60 μg/mL for the never-obese group, 5.17–8.55 μg/mL for the formerly obese/current non-obese group, and 7.71–11.29 μg/mL for the persistently obese group. These reductions were statistically significant. This indicates that past obesity has a lasting impact on adiponectin levels, independent of current body weight. The oo group had higher adjusted adiponectin levels than the nn and on groups, suggesting complex interactions between past/current obesity status and adiponectin regulation.
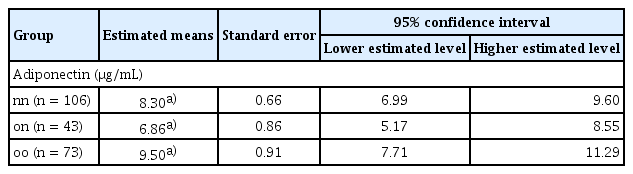
Estimated adiponectin levels after adjusting for age, sex, and BMI
Past obesity has a lasting impact on adiponectin levels and prognosis, even when current BMI is normalized
To determine whether adiponectin levels could influence actual survival rates of patients, we performed a survival analysis using Kaplan–Meier estimation. While there was no significant difference in overall survival rate among the entire cohort (data not shown), we hypothesized that patients with lower adiponectin levels could have a harsher prognosis and that more pronounced differences in survival could be observed in this group [28] (Supplementary Fig. 1). Therefore, we conducted Kaplan–Meier survival curve analysis for each group based on the bottom 25% of adiponectin levels (Fig. 4A). The nn group demonstrated a higher probability of remaining above the lower 25% threshold compared to on and oo groups. Survival probabilities for the nn group consistently remained higher over time, indicating better adiponectin level retention in this group. Summary statistics for the lower 25% adiponectin levels are provided in Fig. 4B and Table 4. These results indicate that individuals in the nn group maintain significantly higher adiponectin levels than those in on and oo groups. Statistical analysis highlighted significant differences in lower 25% adiponectin levels among groups. This suggests that past obesity has a lasting impact on adiponectin levels, even when current BMI is normalized. Consistently higher survival probabilities and mean adiponectin levels in the nn group underscore long-term benefits of never having been obese.
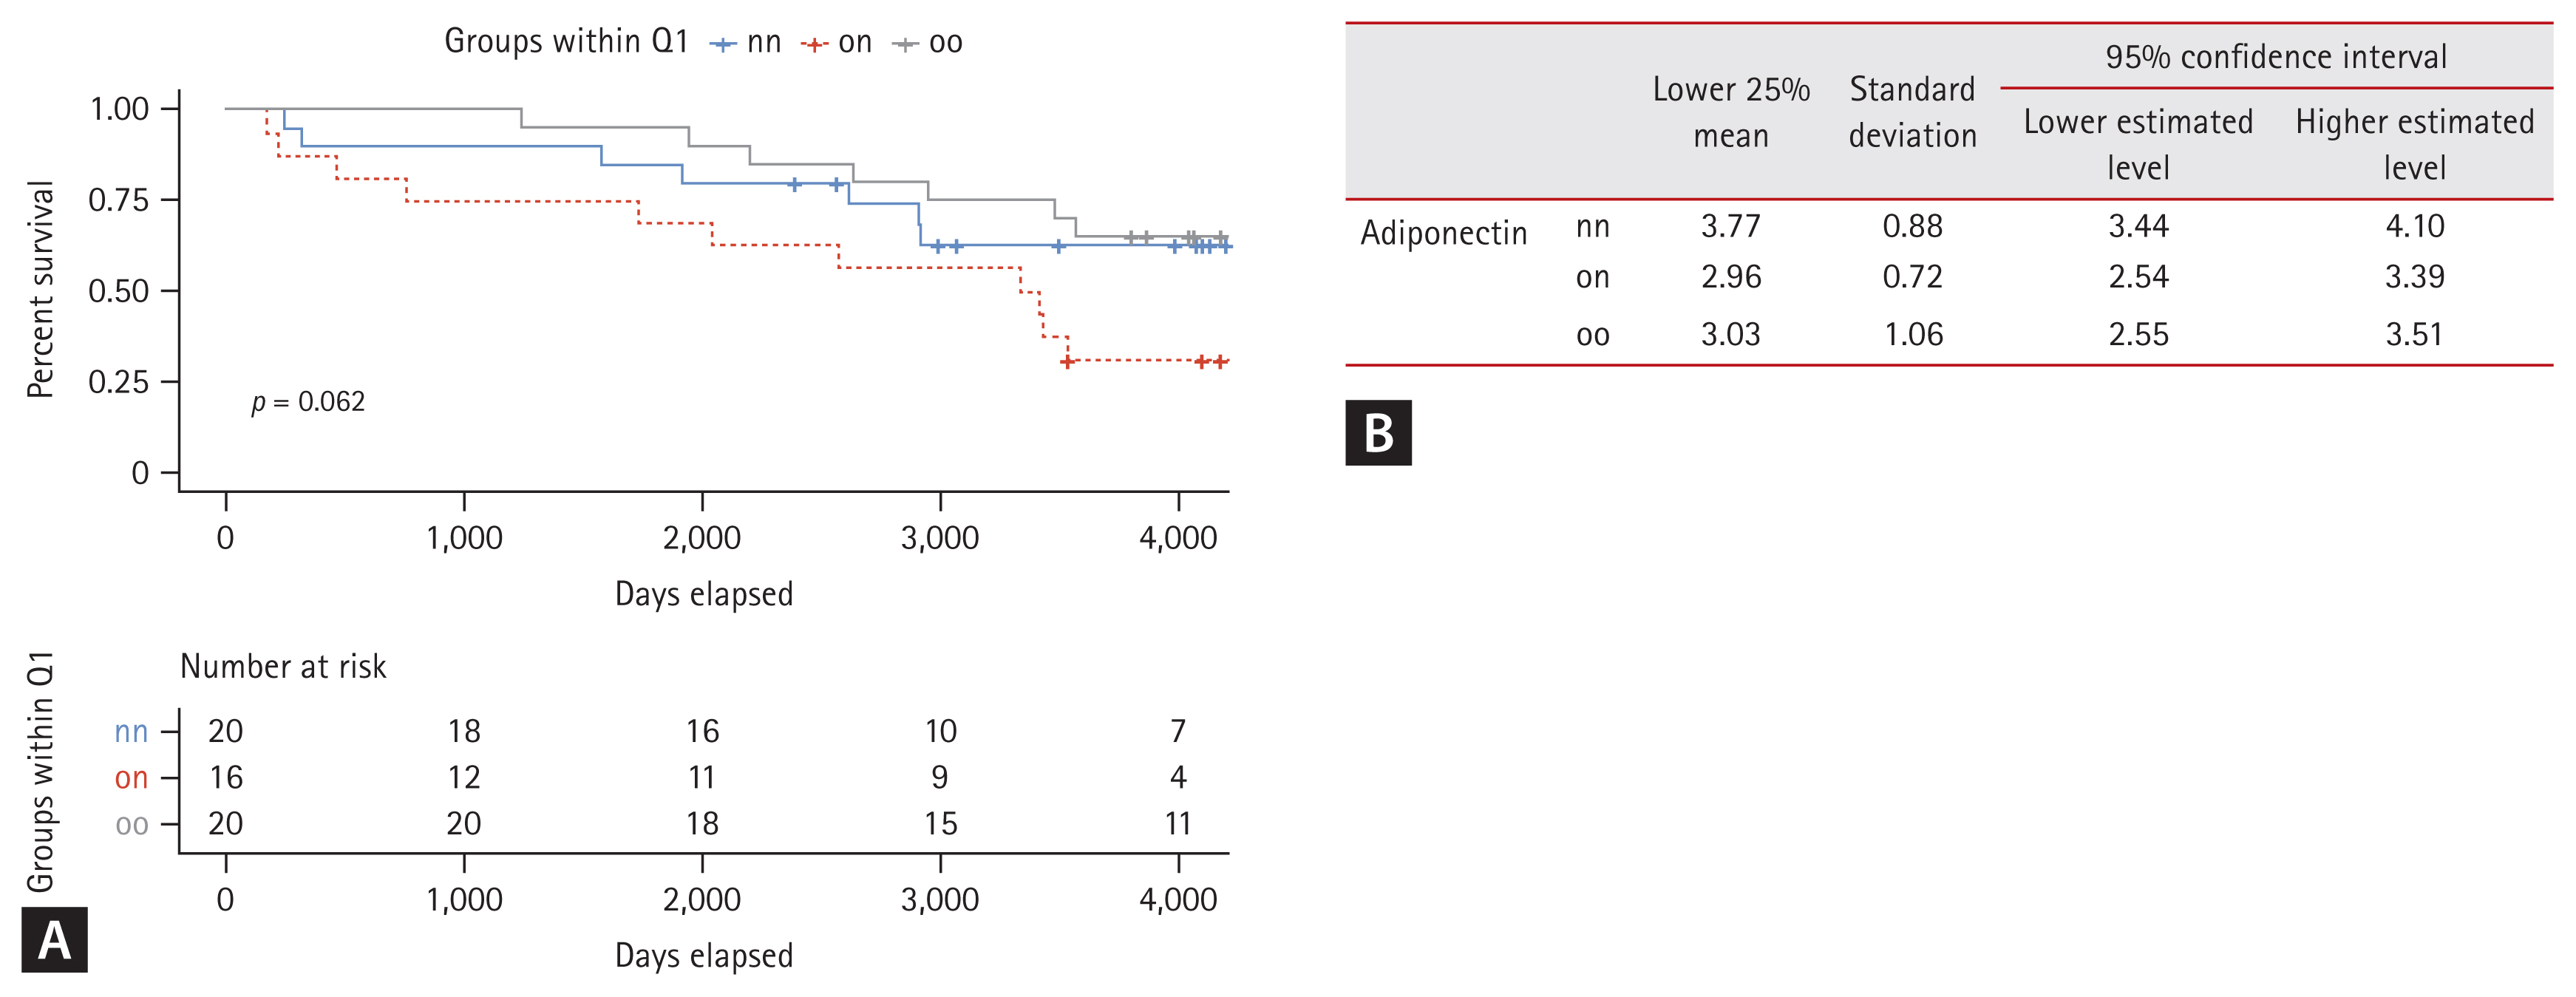
Survival analysis by Kaplan–Meier estimation curve of patients in the bottom 25% of adiponectin levels across groups. (A) Kaplan–Meier survival curves comparing the probability of remaining above the lower 25% threshold of adiponectin levels over time for three groups: nn (never obese), on (formerly obese/present non-obese), and oo (persistent obese). Curves illustrate the proportion of individuals in each group who maintained adiponectin levels above the lower 25% threshold. (B) Summary statistics table of the lower 25% adiponectin levels for each group. Comparative analysis table of the lowest 25% adiponectin levels across three groups: nn, on, and oo. It includes mean adiponectin levels, standard deviations, and 95% confidence intervals for each group, focusing on adiponectin concentrations in the lowest quartile.
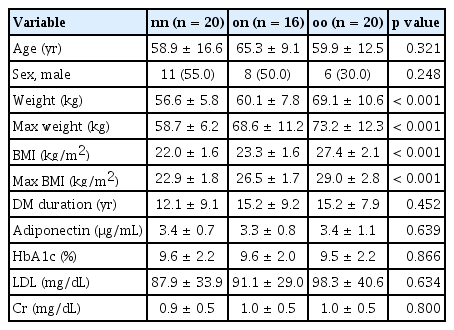
Clinical and laboratory characteristics of patients in low Q1 adiponectin groups
DISCUSSION
This is the first study to confirm metabolic memory of adiponectin in diabetic patients who have been previously obese but have since returned to a normal weight, showing that their adiponectin levels remain lower than patients who have maintained a normal weight. Adiponectin showed a clearer negative correlation with past maximum BMI than with current BMI. This association remained significant even after adjusting for age, sex, and current BMI.
Previous research using mouse models has indicated that weight loss in obese mice does not completely resolve the activation of adipose tissue macrophages, with persistent expression of inflammatory cytokines such as IL-6, IL-1β, and TNF-α in adipose tissues [29]. Adiponectin is known to have a strong negative correlation with visceral fat [30,31]. The expression of TNF-α, which inhibits the promoter of adiponectin, increases with accumulation of visceral fat [32]. Increases of visceral adipose tissue and cell size are associated with local and systemic inflammation and increased insulin resistance [33]. This suggests that inflammation in adipocytes activated by previous obesity cannot be fully reversed by weight loss. The effect of TNF-α, which inhibits adiponectin, may persist even if weight is regained, leading to sustained lower levels of adiponectin.
The relationship between adiponectin and weight has shown mixed results, with some studies indicating a negative correlation while others showing a positive correlation of adiponectin with current weight. In this study, even among patients who are currently of normal weight, those with a history of obesity have lower adiponectin levels. This suggests that metabolic memory of past weight status may contribute to discordance observed in previous studies regarding the relationship between obesity and adiponectin levels.
In addition, the higher-than-expected adiponectin levels observed in the oo group (Table 2) might be attributed to the complex regulatory mechanisms of adiponectin, which are influenced by factors beyond current BMI, such as fat distribution, inflammation, and metabolic adaptation. This phenomenon aligns with the concept of the ‘adiponectin paradox,’ where elevated adiponectin levels in some obese individuals may serve as a compensatory response to chronic metabolic stress [34]. Furthermore, in individuals with long-standing obesity, metabolic adaptation over time may result in adiponectin levels that do not strictly follow the expected inverse correlation with BMI. While the on group (individuals with a history of obesity but now at normal weight) exhibited lower adiponectin levels, possibly due to recent metabolic stress or effects of weight loss, those in the oo group might have reached a more stable metabolic state, leading to distinct patterns of adiponectin regulation. These findings suggest that adiponectin levels are influenced not only by current obesity status, but also by past obesity, metabolic memory, and the body’s adaptive mechanisms. Additionally, when analyzed separately by sex, the correlation between adiponectin levels and both past maximum BMI and body weight was very weak for both males and females, as indicated by the low R2 values and non-significant p values, suggesting no significant gender-specific relationship between past obesity measures and current adiponectin levels (Supplementary Fig. 2). This underscores the need for further research into the role of past obesity and metabolic memory in the regulation of adiponectin.
Patients with genetically low adiponectin levels have been shown to exhibit higher incidences of hypertension, dyslipidemia, and impaired glucose metabolism, including diabetes [35]. Studies on Pima Indians have demonstrated that individuals with lower adiponectin levels are more likely to develop diabetes than those with higher levels [36]. Additionally, in patients undergoing metabolic surgery, those with smaller increases in adiponectin post-surgery have lower remission rates of type 2 diabetes [37]. Clinically, adiponectin is known to have protective effects against major vascular complications such as cardiovascular disease in diabetic patients [38]. Baseline adiponectin levels are inversely correlated with incidence of cardiovascular and renal diseases in hypertensive patients [38]. Paradoxically, however, higher adiponectin levels have been associated with poor prognosis in heart failure patients [34]. While most studies have indicated that low adiponectin levels are associated with increased metabolic disorders and higher cardiovascular risk, there is still controversy. Mechanisms by which adiponectin influences these diseases are not fully understood yet. Current hypotheses suggest that adiponectin can bind to its receptors, activate the AMPK pathway, increase glucose utilization and fatty acid oxidation, ultimately enhancing insulin sensitivity [39–44].
Based on our findings, diabetic patients with a history of obesity have significantly lower adiponectin levels than those who have maintained normal weight, potentially increasing their risk of cardiovascular disease. Therefore, it is essential to implement more rigorous risk management and treatment strategies for patients with low adiponectin levels, even if they currently have a normal BMI. This study has limitations as a retrospective cohort study, such as not being able to determine the long-term impact of reduced adiponectin level on metabolic syndrome or diabetes complications between on and nn groups. Additionally, this study did not take into account cases of rapid weight loss due to conditions such as acute hyperglycemia. This might have influenced our results, particularly in cases where rapid weight loss negatively impacted prognosis. Because data on maximum weight were self-reported, we could not determine the exact timing of maximum weight or the duration of weight stability before study enrollment. This limitation made it difficult to assess whether weight changes occurred over a short or long period. As a result, potential confounding effects, such as short-term weight fluctuations or rapid weight loss due to diabetes, could not be fully addressed in this study. To address these limitations, future delicate longitudinal studies are necessary. Such studies should include more detailed assessments of the timing and duration of weight changes, allowing for a more precise analysis of how past obesity and rapid weight fluctuations impact current metabolic health and long-term outcomes. Furthermore, the reduced survival observed in the ‘on’ group could be partially explained by physiological impacts of rapid weight changes, which have been linked to adverse metabolic and cardiovascular outcomes. Addressing effects of rapid weight loss may provide additional insights into the mechanism(s) behind the poorer survival rate in this group.
KEY MESSAGE
1. This study shows that current adiponectin levels have an inverse relationship with past maximum BMI in type 2 diabetic patients.
2. Individuals with a history of obesity exhibit a legacy effect, with approximately 10% lower adiponectin levels compared to those who have never been obese, even after adjusting for current BMI, age, and sex.
3. Lower adiponectin levels, potentially influenced by past obesity, are associated with reduced survival rates in diabetic patients, as evidenced by Kaplan–Meier survival analysis over a span of 4,000 days.
Notes
Acknowledgments
We give special thanks to Hyuk Kyoon Park for his invaluable support with the survival analysis in this study.
CRedit authorship contributions
Min-Ji Kim: conceptualization, methodology, investigation, data curation, formal analysis, validation, writing - original draft, writing - review & editing, visualization; Sung-Woo Kim: conceptualization, methodology, investigation, data curation, formal analysis; Bitna Ha: resources; Hyang Sook Kim: resources; So-Hee Kwon: resources; Jonghwa Jin: resources; Yeon-Kyung Choi: resources; Keun-Gyu Park: resources; Jung Guk Kim: resources; In-Kyu Lee: resources, supervision; Jae-Han Jeon: conceptualization, methodology, resources, investigation, data curation, validation, writing - review & editing, supervision, project administration, funding acquisition
Conflicts of interest
The authors disclose no conflicts.
Funding
This work was supported by a Biomedical Research Institute grant from Kyungpook National University Hospital (2015).